Free Statistics

of Irreproducible Research!

Author's title

Author*The author of this computation has been verified*
R Software Modulerwasp_multipleregression.wasp
Title produced by softwareMultiple Regression
Date of computationFri, 12 Dec 2014 13:21:34 +0000
Cite this page as followsStatistical Computations at FreeStatistics.org, Office for Research Development and Education, URL https://freestatistics.org/blog/index.php?v=date/2014/Dec/12/t1418390503g42hw1h6rtyy6dn.htm/, Retrieved Thu, 16 May 2024 06:50:04 +0000
Statistical Computations at FreeStatistics.org, Office for Research Development and Education, URL https://freestatistics.org/blog/index.php?pk=266659, Retrieved Thu, 16 May 2024 06:50:04 +0000
QR Codes:

Original text written by user:
IsPrivate?No (this computation is public)
User-defined keywords
Estimated Impact66
Family? (F = Feedback message, R = changed R code, M = changed R Module, P = changed Parameters, D = changed Data)
-     [Multiple Regression] [] [2013-11-04 07:18:26] [0307e7a6407eb638caabc417e3a6b260]
- RMPD    [Multiple Regression] [] [2014-12-12 13:21:34] [0935be2dcbf70771a0c3533f1d231b96] [Current]
Feedback Forum

Post a new message
Dataseries X:
149	7.5
148	6.5
158	1.0
128	1.0
224	5.5
159	8.5
105	6.5
159	4.5
167	2.0
165	5.0
159	0.5
176	5.0
54	2.5
91	5.0
163	5.5
124	3.5
121	4.0
148	6.5
221	4.5
149	5.5
244	4.0
148	7.5
150	4.0
153	5.5
94	2.5
156	5.5
132	3.5
105	4.5
151	4.5
131	6.0
157	5.0
162	6.5
163	5.0
59	6.0
187	4.5
116	5.0
148	5.0
155	6.5
125	7.0
116	4.5
138	8.5
164	3.5
162	6.0
99	1.5
186	3.5
188	7.5
177	5.0
139	6.5
162	6.5
108	6.5
159	7.0
110	1.5
96	4.0
87	4.5
97	0.0
127	3.5
74	4.5
114	0.0
95	3.0
121	3.5
130	3.0
52	1.0
118	5.5


Summary of computational transaction
Raw Inputview raw input (R code)
Raw Outputview raw output of R engine
Computing time5 seconds
R Server'Gertrude Mary Cox' @ cox.wessa.net

\begin{tabular}{lllllllll}
\hline
Summary of computational transaction \tabularnewline
Raw Input & view raw input (R code)  \tabularnewline
Raw Output & view raw output of R engine  \tabularnewline
Computing time & 5 seconds \tabularnewline
R Server & 'Gertrude Mary Cox' @ cox.wessa.net \tabularnewline
\hline
\end{tabular}
%Source: https://freestatistics.org/blog/index.php?pk=266659&T=0

[TABLE]
[ROW][C]Summary of computational transaction[/C][/ROW]
[ROW][C]Raw Input[/C][C]view raw input (R code) [/C][/ROW]
[ROW][C]Raw Output[/C][C]view raw output of R engine [/C][/ROW]
[ROW][C]Computing time[/C][C]5 seconds[/C][/ROW]
[ROW][C]R Server[/C][C]'Gertrude Mary Cox' @ cox.wessa.net[/C][/ROW]
[/TABLE]
Source: https://freestatistics.org/blog/index.php?pk=266659&T=0

Globally Unique Identifier (entire table): ba.freestatistics.org/blog/index.php?pk=266659&T=0

As an alternative you can also use a QR Code:  

The GUIDs for individual cells are displayed in the table below:

Summary of computational transaction
Raw Inputview raw input (R code)
Raw Outputview raw output of R engine
Computing time5 seconds
R Server'Gertrude Mary Cox' @ cox.wessa.net


Multiple Linear Regression - Estimated Regression Equation
Examen[t] = + 2.56135 + 0.014632LFM[t] + e[t]

\begin{tabular}{lllllllll}
\hline
Multiple Linear Regression - Estimated Regression Equation \tabularnewline
Examen[t] =  +  2.56135 +  0.014632LFM[t]  + e[t] \tabularnewline
\hline
\end{tabular}
%Source: https://freestatistics.org/blog/index.php?pk=266659&T=1

[TABLE]
[ROW][C]Multiple Linear Regression - Estimated Regression Equation[/C][/ROW]
[ROW][C]Examen[t] =  +  2.56135 +  0.014632LFM[t]  + e[t][/C][/ROW]
[/TABLE]
Source: https://freestatistics.org/blog/index.php?pk=266659&T=1

Globally Unique Identifier (entire table): ba.freestatistics.org/blog/index.php?pk=266659&T=1

As an alternative you can also use a QR Code:  

The GUIDs for individual cells are displayed in the table below:

Multiple Linear Regression - Estimated Regression Equation
Examen[t] = + 2.56135 + 0.014632LFM[t] + e[t]


Multiple Linear Regression - Ordinary Least Squares
VariableParameterS.D.T-STATH0: parameter = 02-tail p-value1-tail p-value
(Intercept)2.561350.9364052.7350.008149260.00407463
LFM0.0146320.006522542.2430.02852040.0142602

\begin{tabular}{lllllllll}
\hline
Multiple Linear Regression - Ordinary Least Squares \tabularnewline
Variable & Parameter & S.D. & T-STATH0: parameter = 0 & 2-tail p-value & 1-tail p-value \tabularnewline
(Intercept) & 2.56135 & 0.936405 & 2.735 & 0.00814926 & 0.00407463 \tabularnewline
LFM & 0.014632 & 0.00652254 & 2.243 & 0.0285204 & 0.0142602 \tabularnewline
\hline
\end{tabular}
%Source: https://freestatistics.org/blog/index.php?pk=266659&T=2

[TABLE]
[ROW][C]Multiple Linear Regression - Ordinary Least Squares[/C][/ROW]
[ROW][C]Variable[/C][C]Parameter[/C][C]S.D.[/C][C]T-STATH0: parameter = 0[/C][C]2-tail p-value[/C][C]1-tail p-value[/C][/ROW]
[ROW][C](Intercept)[/C][C]2.56135[/C][C]0.936405[/C][C]2.735[/C][C]0.00814926[/C][C]0.00407463[/C][/ROW]
[ROW][C]LFM[/C][C]0.014632[/C][C]0.00652254[/C][C]2.243[/C][C]0.0285204[/C][C]0.0142602[/C][/ROW]
[/TABLE]
Source: https://freestatistics.org/blog/index.php?pk=266659&T=2

Globally Unique Identifier (entire table): ba.freestatistics.org/blog/index.php?pk=266659&T=2

As an alternative you can also use a QR Code:  

The GUIDs for individual cells are displayed in the table below:

Multiple Linear Regression - Ordinary Least Squares
VariableParameterS.D.T-STATH0: parameter = 02-tail p-value1-tail p-value
(Intercept)2.561350.9364052.7350.008149260.00407463
LFM0.0146320.006522542.2430.02852040.0142602


Multiple Linear Regression - Regression Statistics
Multiple R0.276063
R-squared0.0762106
Adjusted R-squared0.0610665
F-TEST (value)5.03237
F-TEST (DF numerator)1
F-TEST (DF denominator)61
p-value0.0285204
Multiple Linear Regression - Residual Statistics
Residual Standard Deviation1.96424
Sum Squared Residuals235.354

\begin{tabular}{lllllllll}
\hline
Multiple Linear Regression - Regression Statistics \tabularnewline
Multiple R & 0.276063 \tabularnewline
R-squared & 0.0762106 \tabularnewline
Adjusted R-squared & 0.0610665 \tabularnewline
F-TEST (value) & 5.03237 \tabularnewline
F-TEST (DF numerator) & 1 \tabularnewline
F-TEST (DF denominator) & 61 \tabularnewline
p-value & 0.0285204 \tabularnewline
Multiple Linear Regression - Residual Statistics \tabularnewline
Residual Standard Deviation & 1.96424 \tabularnewline
Sum Squared Residuals & 235.354 \tabularnewline
\hline
\end{tabular}
%Source: https://freestatistics.org/blog/index.php?pk=266659&T=3

[TABLE]
[ROW][C]Multiple Linear Regression - Regression Statistics[/C][/ROW]
[ROW][C]Multiple R[/C][C]0.276063[/C][/ROW]
[ROW][C]R-squared[/C][C]0.0762106[/C][/ROW]
[ROW][C]Adjusted R-squared[/C][C]0.0610665[/C][/ROW]
[ROW][C]F-TEST (value)[/C][C]5.03237[/C][/ROW]
[ROW][C]F-TEST (DF numerator)[/C][C]1[/C][/ROW]
[ROW][C]F-TEST (DF denominator)[/C][C]61[/C][/ROW]
[ROW][C]p-value[/C][C]0.0285204[/C][/ROW]
[ROW][C]Multiple Linear Regression - Residual Statistics[/C][/ROW]
[ROW][C]Residual Standard Deviation[/C][C]1.96424[/C][/ROW]
[ROW][C]Sum Squared Residuals[/C][C]235.354[/C][/ROW]
[/TABLE]
Source: https://freestatistics.org/blog/index.php?pk=266659&T=3

Globally Unique Identifier (entire table): ba.freestatistics.org/blog/index.php?pk=266659&T=3

As an alternative you can also use a QR Code:  

The GUIDs for individual cells are displayed in the table below:

Multiple Linear Regression - Regression Statistics
Multiple R0.276063
R-squared0.0762106
Adjusted R-squared0.0610665
F-TEST (value)5.03237
F-TEST (DF numerator)1
F-TEST (DF denominator)61
p-value0.0285204
Multiple Linear Regression - Residual Statistics
Residual Standard Deviation1.96424
Sum Squared Residuals235.354


Multiple Linear Regression - Actuals, Interpolation, and Residuals
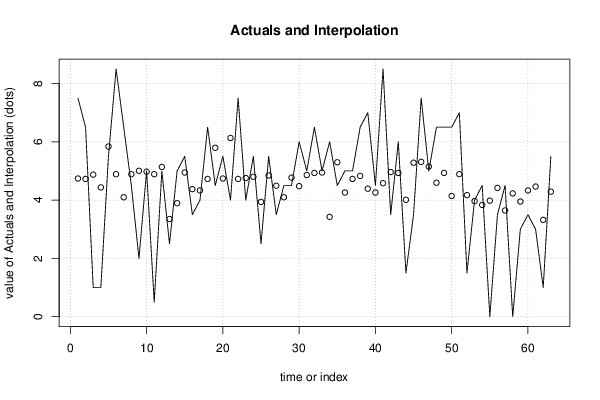
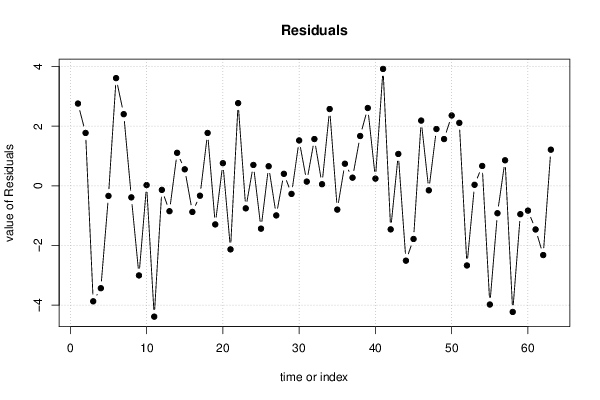
Time or IndexActualsInterpolationForecastResidualsPrediction Error
17.54.741522.75848
26.54.726891.77311
314.87321-3.87321
414.43425-3.43425
55.55.83892-0.338916
68.54.887843.61216
76.54.097712.40229
84.54.88784-0.387838
925.00489-3.00489
1054.975630.0243706
110.54.88784-4.38784
1255.13658-0.136581
132.53.35148-0.851481
1453.892861.10714
155.54.946370.553635
163.54.37572-0.875719
1744.33182-0.331823
186.54.726891.77311
194.55.79502-1.29502
205.54.741520.758482
2146.13156-2.13156
227.54.726892.77311
2344.75615-0.75615
245.54.800050.699954
252.53.93676-1.43676
265.54.843940.656058
273.54.49277-0.992774
284.54.097710.402289
294.54.77078-0.270782
3064.478141.52186
3154.858570.141426
326.54.931731.56827
3354.946370.0536345
3463.424642.57536
354.55.29753-0.797533
3654.258660.741337
3754.726890.273114
386.54.829311.67069
3974.390352.60965
404.54.258660.241337
418.54.580573.91943
423.54.961-1.461
4364.931731.06827
441.54.00992-2.50992
453.55.2829-1.7829
467.55.312162.18784
4755.15121-0.151213
486.54.59521.9048
496.54.931731.56827
506.54.141612.35839
5174.887842.11216
521.54.17087-2.67087
5343.966020.0339765
544.53.834340.665664
5503.98066-3.98066
563.54.41961-0.919615
574.53.644120.85588
5804.2294-4.2294
5933.95139-0.951392
603.54.33182-0.831823
6134.46351-1.46351
6213.32222-2.32222
635.54.287931.21207

\begin{tabular}{lllllllll}
\hline
Multiple Linear Regression - Actuals, Interpolation, and Residuals \tabularnewline
Time or Index & Actuals & InterpolationForecast & ResidualsPrediction Error \tabularnewline
1 & 7.5 & 4.74152 & 2.75848 \tabularnewline
2 & 6.5 & 4.72689 & 1.77311 \tabularnewline
3 & 1 & 4.87321 & -3.87321 \tabularnewline
4 & 1 & 4.43425 & -3.43425 \tabularnewline
5 & 5.5 & 5.83892 & -0.338916 \tabularnewline
6 & 8.5 & 4.88784 & 3.61216 \tabularnewline
7 & 6.5 & 4.09771 & 2.40229 \tabularnewline
8 & 4.5 & 4.88784 & -0.387838 \tabularnewline
9 & 2 & 5.00489 & -3.00489 \tabularnewline
10 & 5 & 4.97563 & 0.0243706 \tabularnewline
11 & 0.5 & 4.88784 & -4.38784 \tabularnewline
12 & 5 & 5.13658 & -0.136581 \tabularnewline
13 & 2.5 & 3.35148 & -0.851481 \tabularnewline
14 & 5 & 3.89286 & 1.10714 \tabularnewline
15 & 5.5 & 4.94637 & 0.553635 \tabularnewline
16 & 3.5 & 4.37572 & -0.875719 \tabularnewline
17 & 4 & 4.33182 & -0.331823 \tabularnewline
18 & 6.5 & 4.72689 & 1.77311 \tabularnewline
19 & 4.5 & 5.79502 & -1.29502 \tabularnewline
20 & 5.5 & 4.74152 & 0.758482 \tabularnewline
21 & 4 & 6.13156 & -2.13156 \tabularnewline
22 & 7.5 & 4.72689 & 2.77311 \tabularnewline
23 & 4 & 4.75615 & -0.75615 \tabularnewline
24 & 5.5 & 4.80005 & 0.699954 \tabularnewline
25 & 2.5 & 3.93676 & -1.43676 \tabularnewline
26 & 5.5 & 4.84394 & 0.656058 \tabularnewline
27 & 3.5 & 4.49277 & -0.992774 \tabularnewline
28 & 4.5 & 4.09771 & 0.402289 \tabularnewline
29 & 4.5 & 4.77078 & -0.270782 \tabularnewline
30 & 6 & 4.47814 & 1.52186 \tabularnewline
31 & 5 & 4.85857 & 0.141426 \tabularnewline
32 & 6.5 & 4.93173 & 1.56827 \tabularnewline
33 & 5 & 4.94637 & 0.0536345 \tabularnewline
34 & 6 & 3.42464 & 2.57536 \tabularnewline
35 & 4.5 & 5.29753 & -0.797533 \tabularnewline
36 & 5 & 4.25866 & 0.741337 \tabularnewline
37 & 5 & 4.72689 & 0.273114 \tabularnewline
38 & 6.5 & 4.82931 & 1.67069 \tabularnewline
39 & 7 & 4.39035 & 2.60965 \tabularnewline
40 & 4.5 & 4.25866 & 0.241337 \tabularnewline
41 & 8.5 & 4.58057 & 3.91943 \tabularnewline
42 & 3.5 & 4.961 & -1.461 \tabularnewline
43 & 6 & 4.93173 & 1.06827 \tabularnewline
44 & 1.5 & 4.00992 & -2.50992 \tabularnewline
45 & 3.5 & 5.2829 & -1.7829 \tabularnewline
46 & 7.5 & 5.31216 & 2.18784 \tabularnewline
47 & 5 & 5.15121 & -0.151213 \tabularnewline
48 & 6.5 & 4.5952 & 1.9048 \tabularnewline
49 & 6.5 & 4.93173 & 1.56827 \tabularnewline
50 & 6.5 & 4.14161 & 2.35839 \tabularnewline
51 & 7 & 4.88784 & 2.11216 \tabularnewline
52 & 1.5 & 4.17087 & -2.67087 \tabularnewline
53 & 4 & 3.96602 & 0.0339765 \tabularnewline
54 & 4.5 & 3.83434 & 0.665664 \tabularnewline
55 & 0 & 3.98066 & -3.98066 \tabularnewline
56 & 3.5 & 4.41961 & -0.919615 \tabularnewline
57 & 4.5 & 3.64412 & 0.85588 \tabularnewline
58 & 0 & 4.2294 & -4.2294 \tabularnewline
59 & 3 & 3.95139 & -0.951392 \tabularnewline
60 & 3.5 & 4.33182 & -0.831823 \tabularnewline
61 & 3 & 4.46351 & -1.46351 \tabularnewline
62 & 1 & 3.32222 & -2.32222 \tabularnewline
63 & 5.5 & 4.28793 & 1.21207 \tabularnewline
\hline
\end{tabular}
%Source: https://freestatistics.org/blog/index.php?pk=266659&T=4

[TABLE]
[ROW][C]Multiple Linear Regression - Actuals, Interpolation, and Residuals[/C][/ROW]
[ROW][C]Time or Index[/C][C]Actuals[/C][C]InterpolationForecast[/C][C]ResidualsPrediction Error[/C][/ROW]
[ROW][C]1[/C][C]7.5[/C][C]4.74152[/C][C]2.75848[/C][/ROW]
[ROW][C]2[/C][C]6.5[/C][C]4.72689[/C][C]1.77311[/C][/ROW]
[ROW][C]3[/C][C]1[/C][C]4.87321[/C][C]-3.87321[/C][/ROW]
[ROW][C]4[/C][C]1[/C][C]4.43425[/C][C]-3.43425[/C][/ROW]
[ROW][C]5[/C][C]5.5[/C][C]5.83892[/C][C]-0.338916[/C][/ROW]
[ROW][C]6[/C][C]8.5[/C][C]4.88784[/C][C]3.61216[/C][/ROW]
[ROW][C]7[/C][C]6.5[/C][C]4.09771[/C][C]2.40229[/C][/ROW]
[ROW][C]8[/C][C]4.5[/C][C]4.88784[/C][C]-0.387838[/C][/ROW]
[ROW][C]9[/C][C]2[/C][C]5.00489[/C][C]-3.00489[/C][/ROW]
[ROW][C]10[/C][C]5[/C][C]4.97563[/C][C]0.0243706[/C][/ROW]
[ROW][C]11[/C][C]0.5[/C][C]4.88784[/C][C]-4.38784[/C][/ROW]
[ROW][C]12[/C][C]5[/C][C]5.13658[/C][C]-0.136581[/C][/ROW]
[ROW][C]13[/C][C]2.5[/C][C]3.35148[/C][C]-0.851481[/C][/ROW]
[ROW][C]14[/C][C]5[/C][C]3.89286[/C][C]1.10714[/C][/ROW]
[ROW][C]15[/C][C]5.5[/C][C]4.94637[/C][C]0.553635[/C][/ROW]
[ROW][C]16[/C][C]3.5[/C][C]4.37572[/C][C]-0.875719[/C][/ROW]
[ROW][C]17[/C][C]4[/C][C]4.33182[/C][C]-0.331823[/C][/ROW]
[ROW][C]18[/C][C]6.5[/C][C]4.72689[/C][C]1.77311[/C][/ROW]
[ROW][C]19[/C][C]4.5[/C][C]5.79502[/C][C]-1.29502[/C][/ROW]
[ROW][C]20[/C][C]5.5[/C][C]4.74152[/C][C]0.758482[/C][/ROW]
[ROW][C]21[/C][C]4[/C][C]6.13156[/C][C]-2.13156[/C][/ROW]
[ROW][C]22[/C][C]7.5[/C][C]4.72689[/C][C]2.77311[/C][/ROW]
[ROW][C]23[/C][C]4[/C][C]4.75615[/C][C]-0.75615[/C][/ROW]
[ROW][C]24[/C][C]5.5[/C][C]4.80005[/C][C]0.699954[/C][/ROW]
[ROW][C]25[/C][C]2.5[/C][C]3.93676[/C][C]-1.43676[/C][/ROW]
[ROW][C]26[/C][C]5.5[/C][C]4.84394[/C][C]0.656058[/C][/ROW]
[ROW][C]27[/C][C]3.5[/C][C]4.49277[/C][C]-0.992774[/C][/ROW]
[ROW][C]28[/C][C]4.5[/C][C]4.09771[/C][C]0.402289[/C][/ROW]
[ROW][C]29[/C][C]4.5[/C][C]4.77078[/C][C]-0.270782[/C][/ROW]
[ROW][C]30[/C][C]6[/C][C]4.47814[/C][C]1.52186[/C][/ROW]
[ROW][C]31[/C][C]5[/C][C]4.85857[/C][C]0.141426[/C][/ROW]
[ROW][C]32[/C][C]6.5[/C][C]4.93173[/C][C]1.56827[/C][/ROW]
[ROW][C]33[/C][C]5[/C][C]4.94637[/C][C]0.0536345[/C][/ROW]
[ROW][C]34[/C][C]6[/C][C]3.42464[/C][C]2.57536[/C][/ROW]
[ROW][C]35[/C][C]4.5[/C][C]5.29753[/C][C]-0.797533[/C][/ROW]
[ROW][C]36[/C][C]5[/C][C]4.25866[/C][C]0.741337[/C][/ROW]
[ROW][C]37[/C][C]5[/C][C]4.72689[/C][C]0.273114[/C][/ROW]
[ROW][C]38[/C][C]6.5[/C][C]4.82931[/C][C]1.67069[/C][/ROW]
[ROW][C]39[/C][C]7[/C][C]4.39035[/C][C]2.60965[/C][/ROW]
[ROW][C]40[/C][C]4.5[/C][C]4.25866[/C][C]0.241337[/C][/ROW]
[ROW][C]41[/C][C]8.5[/C][C]4.58057[/C][C]3.91943[/C][/ROW]
[ROW][C]42[/C][C]3.5[/C][C]4.961[/C][C]-1.461[/C][/ROW]
[ROW][C]43[/C][C]6[/C][C]4.93173[/C][C]1.06827[/C][/ROW]
[ROW][C]44[/C][C]1.5[/C][C]4.00992[/C][C]-2.50992[/C][/ROW]
[ROW][C]45[/C][C]3.5[/C][C]5.2829[/C][C]-1.7829[/C][/ROW]
[ROW][C]46[/C][C]7.5[/C][C]5.31216[/C][C]2.18784[/C][/ROW]
[ROW][C]47[/C][C]5[/C][C]5.15121[/C][C]-0.151213[/C][/ROW]
[ROW][C]48[/C][C]6.5[/C][C]4.5952[/C][C]1.9048[/C][/ROW]
[ROW][C]49[/C][C]6.5[/C][C]4.93173[/C][C]1.56827[/C][/ROW]
[ROW][C]50[/C][C]6.5[/C][C]4.14161[/C][C]2.35839[/C][/ROW]
[ROW][C]51[/C][C]7[/C][C]4.88784[/C][C]2.11216[/C][/ROW]
[ROW][C]52[/C][C]1.5[/C][C]4.17087[/C][C]-2.67087[/C][/ROW]
[ROW][C]53[/C][C]4[/C][C]3.96602[/C][C]0.0339765[/C][/ROW]
[ROW][C]54[/C][C]4.5[/C][C]3.83434[/C][C]0.665664[/C][/ROW]
[ROW][C]55[/C][C]0[/C][C]3.98066[/C][C]-3.98066[/C][/ROW]
[ROW][C]56[/C][C]3.5[/C][C]4.41961[/C][C]-0.919615[/C][/ROW]
[ROW][C]57[/C][C]4.5[/C][C]3.64412[/C][C]0.85588[/C][/ROW]
[ROW][C]58[/C][C]0[/C][C]4.2294[/C][C]-4.2294[/C][/ROW]
[ROW][C]59[/C][C]3[/C][C]3.95139[/C][C]-0.951392[/C][/ROW]
[ROW][C]60[/C][C]3.5[/C][C]4.33182[/C][C]-0.831823[/C][/ROW]
[ROW][C]61[/C][C]3[/C][C]4.46351[/C][C]-1.46351[/C][/ROW]
[ROW][C]62[/C][C]1[/C][C]3.32222[/C][C]-2.32222[/C][/ROW]
[ROW][C]63[/C][C]5.5[/C][C]4.28793[/C][C]1.21207[/C][/ROW]
[/TABLE]
Source: https://freestatistics.org/blog/index.php?pk=266659&T=4

Globally Unique Identifier (entire table): ba.freestatistics.org/blog/index.php?pk=266659&T=4

As an alternative you can also use a QR Code:  

The GUIDs for individual cells are displayed in the table below:

Multiple Linear Regression - Actuals, Interpolation, and Residuals
Time or IndexActualsInterpolationForecastResidualsPrediction Error
17.54.741522.75848
26.54.726891.77311
314.87321-3.87321
414.43425-3.43425
55.55.83892-0.338916
68.54.887843.61216
76.54.097712.40229
84.54.88784-0.387838
925.00489-3.00489
1054.975630.0243706
110.54.88784-4.38784
1255.13658-0.136581
132.53.35148-0.851481
1453.892861.10714
155.54.946370.553635
163.54.37572-0.875719
1744.33182-0.331823
186.54.726891.77311
194.55.79502-1.29502
205.54.741520.758482
2146.13156-2.13156
227.54.726892.77311
2344.75615-0.75615
245.54.800050.699954
252.53.93676-1.43676
265.54.843940.656058
273.54.49277-0.992774
284.54.097710.402289
294.54.77078-0.270782
3064.478141.52186
3154.858570.141426
326.54.931731.56827
3354.946370.0536345
3463.424642.57536
354.55.29753-0.797533
3654.258660.741337
3754.726890.273114
386.54.829311.67069
3974.390352.60965
404.54.258660.241337
418.54.580573.91943
423.54.961-1.461
4364.931731.06827
441.54.00992-2.50992
453.55.2829-1.7829
467.55.312162.18784
4755.15121-0.151213
486.54.59521.9048
496.54.931731.56827
506.54.141612.35839
5174.887842.11216
521.54.17087-2.67087
5343.966020.0339765
544.53.834340.665664
5503.98066-3.98066
563.54.41961-0.919615
574.53.644120.85588
5804.2294-4.2294
5933.95139-0.951392
603.54.33182-0.831823
6134.46351-1.46351
6213.32222-2.32222
635.54.287931.21207


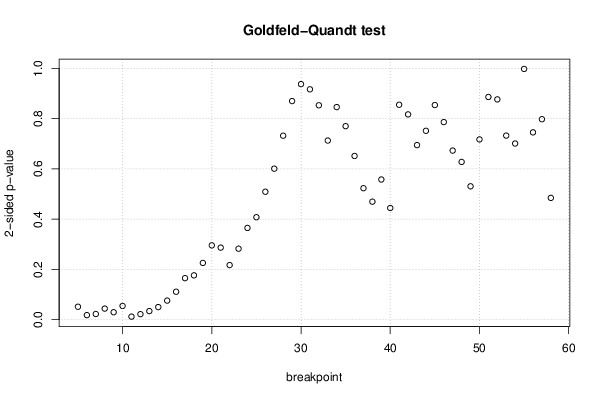
Goldfeld-Quandt test for Heteroskedasticity
p-valuesAlternative Hypothesis
breakpoint indexgreater2-sidedless
50.9742610.05147710.0257386
60.990940.01812010.00906005
70.988730.02253950.0112697
80.9779710.04405720.0220286
90.9852190.0295610.0147805
100.9726690.05466170.0273308
110.9939940.01201170.00600585
120.989040.02191980.0109599
130.9829640.03407110.0170356
140.9749990.05000220.0250011
150.9620230.07595330.0379766
160.9444040.1111920.0555959
170.9173860.1652270.0826136
180.9117860.1764280.0882141
190.8870510.2258980.112949
200.8521250.295750.147875
210.8566360.2867270.143364
220.8913950.2172110.108605
230.8587470.2825060.141253
240.8174450.3651090.182555
250.7961530.4076940.203847
260.7454110.5091780.254589
270.6995190.6009620.300481
280.633940.7321210.36606
290.564970.870060.43503
300.5312110.9375790.468789
310.4584180.9168360.541582
320.426640.8532810.57336
330.3564960.7129920.643504
340.4230160.8460330.576984
350.3850680.7701370.614932
360.3257590.6515190.674241
370.2616180.5232360.738382
380.2348470.4696940.765153
390.2789410.5578830.721059
400.2222220.4444440.777778
410.4276870.8553740.572313
420.4085040.8170080.591496
430.3474230.6948450.652577
440.3758640.7517290.624136
450.4271370.8542730.572863
460.3932330.7864650.606767
470.3364870.6729730.663513
480.3139650.6279310.686035
490.2653920.5307840.734608
500.358730.7174610.64127
510.4431370.8862740.556863
520.4384110.8768220.561589
530.3663460.7326920.633654
540.3505480.7010970.649452
550.4989440.9978870.501056
560.3727530.7455060.627247
570.3988870.7977740.601113
580.7576440.4847120.242356

\begin{tabular}{lllllllll}
\hline
Goldfeld-Quandt test for Heteroskedasticity \tabularnewline
p-values & Alternative Hypothesis \tabularnewline
breakpoint index & greater & 2-sided & less \tabularnewline
5 & 0.974261 & 0.0514771 & 0.0257386 \tabularnewline
6 & 0.99094 & 0.0181201 & 0.00906005 \tabularnewline
7 & 0.98873 & 0.0225395 & 0.0112697 \tabularnewline
8 & 0.977971 & 0.0440572 & 0.0220286 \tabularnewline
9 & 0.985219 & 0.029561 & 0.0147805 \tabularnewline
10 & 0.972669 & 0.0546617 & 0.0273308 \tabularnewline
11 & 0.993994 & 0.0120117 & 0.00600585 \tabularnewline
12 & 0.98904 & 0.0219198 & 0.0109599 \tabularnewline
13 & 0.982964 & 0.0340711 & 0.0170356 \tabularnewline
14 & 0.974999 & 0.0500022 & 0.0250011 \tabularnewline
15 & 0.962023 & 0.0759533 & 0.0379766 \tabularnewline
16 & 0.944404 & 0.111192 & 0.0555959 \tabularnewline
17 & 0.917386 & 0.165227 & 0.0826136 \tabularnewline
18 & 0.911786 & 0.176428 & 0.0882141 \tabularnewline
19 & 0.887051 & 0.225898 & 0.112949 \tabularnewline
20 & 0.852125 & 0.29575 & 0.147875 \tabularnewline
21 & 0.856636 & 0.286727 & 0.143364 \tabularnewline
22 & 0.891395 & 0.217211 & 0.108605 \tabularnewline
23 & 0.858747 & 0.282506 & 0.141253 \tabularnewline
24 & 0.817445 & 0.365109 & 0.182555 \tabularnewline
25 & 0.796153 & 0.407694 & 0.203847 \tabularnewline
26 & 0.745411 & 0.509178 & 0.254589 \tabularnewline
27 & 0.699519 & 0.600962 & 0.300481 \tabularnewline
28 & 0.63394 & 0.732121 & 0.36606 \tabularnewline
29 & 0.56497 & 0.87006 & 0.43503 \tabularnewline
30 & 0.531211 & 0.937579 & 0.468789 \tabularnewline
31 & 0.458418 & 0.916836 & 0.541582 \tabularnewline
32 & 0.42664 & 0.853281 & 0.57336 \tabularnewline
33 & 0.356496 & 0.712992 & 0.643504 \tabularnewline
34 & 0.423016 & 0.846033 & 0.576984 \tabularnewline
35 & 0.385068 & 0.770137 & 0.614932 \tabularnewline
36 & 0.325759 & 0.651519 & 0.674241 \tabularnewline
37 & 0.261618 & 0.523236 & 0.738382 \tabularnewline
38 & 0.234847 & 0.469694 & 0.765153 \tabularnewline
39 & 0.278941 & 0.557883 & 0.721059 \tabularnewline
40 & 0.222222 & 0.444444 & 0.777778 \tabularnewline
41 & 0.427687 & 0.855374 & 0.572313 \tabularnewline
42 & 0.408504 & 0.817008 & 0.591496 \tabularnewline
43 & 0.347423 & 0.694845 & 0.652577 \tabularnewline
44 & 0.375864 & 0.751729 & 0.624136 \tabularnewline
45 & 0.427137 & 0.854273 & 0.572863 \tabularnewline
46 & 0.393233 & 0.786465 & 0.606767 \tabularnewline
47 & 0.336487 & 0.672973 & 0.663513 \tabularnewline
48 & 0.313965 & 0.627931 & 0.686035 \tabularnewline
49 & 0.265392 & 0.530784 & 0.734608 \tabularnewline
50 & 0.35873 & 0.717461 & 0.64127 \tabularnewline
51 & 0.443137 & 0.886274 & 0.556863 \tabularnewline
52 & 0.438411 & 0.876822 & 0.561589 \tabularnewline
53 & 0.366346 & 0.732692 & 0.633654 \tabularnewline
54 & 0.350548 & 0.701097 & 0.649452 \tabularnewline
55 & 0.498944 & 0.997887 & 0.501056 \tabularnewline
56 & 0.372753 & 0.745506 & 0.627247 \tabularnewline
57 & 0.398887 & 0.797774 & 0.601113 \tabularnewline
58 & 0.757644 & 0.484712 & 0.242356 \tabularnewline
\hline
\end{tabular}
%Source: https://freestatistics.org/blog/index.php?pk=266659&T=5

[TABLE]
[ROW][C]Goldfeld-Quandt test for Heteroskedasticity[/C][/ROW]
[ROW][C]p-values[/C][C]Alternative Hypothesis[/C][/ROW]
[ROW][C]breakpoint index[/C][C]greater[/C][C]2-sided[/C][C]less[/C][/ROW]
[ROW][C]5[/C][C]0.974261[/C][C]0.0514771[/C][C]0.0257386[/C][/ROW]
[ROW][C]6[/C][C]0.99094[/C][C]0.0181201[/C][C]0.00906005[/C][/ROW]
[ROW][C]7[/C][C]0.98873[/C][C]0.0225395[/C][C]0.0112697[/C][/ROW]
[ROW][C]8[/C][C]0.977971[/C][C]0.0440572[/C][C]0.0220286[/C][/ROW]
[ROW][C]9[/C][C]0.985219[/C][C]0.029561[/C][C]0.0147805[/C][/ROW]
[ROW][C]10[/C][C]0.972669[/C][C]0.0546617[/C][C]0.0273308[/C][/ROW]
[ROW][C]11[/C][C]0.993994[/C][C]0.0120117[/C][C]0.00600585[/C][/ROW]
[ROW][C]12[/C][C]0.98904[/C][C]0.0219198[/C][C]0.0109599[/C][/ROW]
[ROW][C]13[/C][C]0.982964[/C][C]0.0340711[/C][C]0.0170356[/C][/ROW]
[ROW][C]14[/C][C]0.974999[/C][C]0.0500022[/C][C]0.0250011[/C][/ROW]
[ROW][C]15[/C][C]0.962023[/C][C]0.0759533[/C][C]0.0379766[/C][/ROW]
[ROW][C]16[/C][C]0.944404[/C][C]0.111192[/C][C]0.0555959[/C][/ROW]
[ROW][C]17[/C][C]0.917386[/C][C]0.165227[/C][C]0.0826136[/C][/ROW]
[ROW][C]18[/C][C]0.911786[/C][C]0.176428[/C][C]0.0882141[/C][/ROW]
[ROW][C]19[/C][C]0.887051[/C][C]0.225898[/C][C]0.112949[/C][/ROW]
[ROW][C]20[/C][C]0.852125[/C][C]0.29575[/C][C]0.147875[/C][/ROW]
[ROW][C]21[/C][C]0.856636[/C][C]0.286727[/C][C]0.143364[/C][/ROW]
[ROW][C]22[/C][C]0.891395[/C][C]0.217211[/C][C]0.108605[/C][/ROW]
[ROW][C]23[/C][C]0.858747[/C][C]0.282506[/C][C]0.141253[/C][/ROW]
[ROW][C]24[/C][C]0.817445[/C][C]0.365109[/C][C]0.182555[/C][/ROW]
[ROW][C]25[/C][C]0.796153[/C][C]0.407694[/C][C]0.203847[/C][/ROW]
[ROW][C]26[/C][C]0.745411[/C][C]0.509178[/C][C]0.254589[/C][/ROW]
[ROW][C]27[/C][C]0.699519[/C][C]0.600962[/C][C]0.300481[/C][/ROW]
[ROW][C]28[/C][C]0.63394[/C][C]0.732121[/C][C]0.36606[/C][/ROW]
[ROW][C]29[/C][C]0.56497[/C][C]0.87006[/C][C]0.43503[/C][/ROW]
[ROW][C]30[/C][C]0.531211[/C][C]0.937579[/C][C]0.468789[/C][/ROW]
[ROW][C]31[/C][C]0.458418[/C][C]0.916836[/C][C]0.541582[/C][/ROW]
[ROW][C]32[/C][C]0.42664[/C][C]0.853281[/C][C]0.57336[/C][/ROW]
[ROW][C]33[/C][C]0.356496[/C][C]0.712992[/C][C]0.643504[/C][/ROW]
[ROW][C]34[/C][C]0.423016[/C][C]0.846033[/C][C]0.576984[/C][/ROW]
[ROW][C]35[/C][C]0.385068[/C][C]0.770137[/C][C]0.614932[/C][/ROW]
[ROW][C]36[/C][C]0.325759[/C][C]0.651519[/C][C]0.674241[/C][/ROW]
[ROW][C]37[/C][C]0.261618[/C][C]0.523236[/C][C]0.738382[/C][/ROW]
[ROW][C]38[/C][C]0.234847[/C][C]0.469694[/C][C]0.765153[/C][/ROW]
[ROW][C]39[/C][C]0.278941[/C][C]0.557883[/C][C]0.721059[/C][/ROW]
[ROW][C]40[/C][C]0.222222[/C][C]0.444444[/C][C]0.777778[/C][/ROW]
[ROW][C]41[/C][C]0.427687[/C][C]0.855374[/C][C]0.572313[/C][/ROW]
[ROW][C]42[/C][C]0.408504[/C][C]0.817008[/C][C]0.591496[/C][/ROW]
[ROW][C]43[/C][C]0.347423[/C][C]0.694845[/C][C]0.652577[/C][/ROW]
[ROW][C]44[/C][C]0.375864[/C][C]0.751729[/C][C]0.624136[/C][/ROW]
[ROW][C]45[/C][C]0.427137[/C][C]0.854273[/C][C]0.572863[/C][/ROW]
[ROW][C]46[/C][C]0.393233[/C][C]0.786465[/C][C]0.606767[/C][/ROW]
[ROW][C]47[/C][C]0.336487[/C][C]0.672973[/C][C]0.663513[/C][/ROW]
[ROW][C]48[/C][C]0.313965[/C][C]0.627931[/C][C]0.686035[/C][/ROW]
[ROW][C]49[/C][C]0.265392[/C][C]0.530784[/C][C]0.734608[/C][/ROW]
[ROW][C]50[/C][C]0.35873[/C][C]0.717461[/C][C]0.64127[/C][/ROW]
[ROW][C]51[/C][C]0.443137[/C][C]0.886274[/C][C]0.556863[/C][/ROW]
[ROW][C]52[/C][C]0.438411[/C][C]0.876822[/C][C]0.561589[/C][/ROW]
[ROW][C]53[/C][C]0.366346[/C][C]0.732692[/C][C]0.633654[/C][/ROW]
[ROW][C]54[/C][C]0.350548[/C][C]0.701097[/C][C]0.649452[/C][/ROW]
[ROW][C]55[/C][C]0.498944[/C][C]0.997887[/C][C]0.501056[/C][/ROW]
[ROW][C]56[/C][C]0.372753[/C][C]0.745506[/C][C]0.627247[/C][/ROW]
[ROW][C]57[/C][C]0.398887[/C][C]0.797774[/C][C]0.601113[/C][/ROW]
[ROW][C]58[/C][C]0.757644[/C][C]0.484712[/C][C]0.242356[/C][/ROW]
[/TABLE]
Source: https://freestatistics.org/blog/index.php?pk=266659&T=5

Globally Unique Identifier (entire table): ba.freestatistics.org/blog/index.php?pk=266659&T=5

As an alternative you can also use a QR Code:  

The GUIDs for individual cells are displayed in the table below:

Goldfeld-Quandt test for Heteroskedasticity
p-valuesAlternative Hypothesis
breakpoint indexgreater2-sidedless
50.9742610.05147710.0257386
60.990940.01812010.00906005
70.988730.02253950.0112697
80.9779710.04405720.0220286
90.9852190.0295610.0147805
100.9726690.05466170.0273308
110.9939940.01201170.00600585
120.989040.02191980.0109599
130.9829640.03407110.0170356
140.9749990.05000220.0250011
150.9620230.07595330.0379766
160.9444040.1111920.0555959
170.9173860.1652270.0826136
180.9117860.1764280.0882141
190.8870510.2258980.112949
200.8521250.295750.147875
210.8566360.2867270.143364
220.8913950.2172110.108605
230.8587470.2825060.141253
240.8174450.3651090.182555
250.7961530.4076940.203847
260.7454110.5091780.254589
270.6995190.6009620.300481
280.633940.7321210.36606
290.564970.870060.43503
300.5312110.9375790.468789
310.4584180.9168360.541582
320.426640.8532810.57336
330.3564960.7129920.643504
340.4230160.8460330.576984
350.3850680.7701370.614932
360.3257590.6515190.674241
370.2616180.5232360.738382
380.2348470.4696940.765153
390.2789410.5578830.721059
400.2222220.4444440.777778
410.4276870.8553740.572313
420.4085040.8170080.591496
430.3474230.6948450.652577
440.3758640.7517290.624136
450.4271370.8542730.572863
460.3932330.7864650.606767
470.3364870.6729730.663513
480.3139650.6279310.686035
490.2653920.5307840.734608
500.358730.7174610.64127
510.4431370.8862740.556863
520.4384110.8768220.561589
530.3663460.7326920.633654
540.3505480.7010970.649452
550.4989440.9978870.501056
560.3727530.7455060.627247
570.3988870.7977740.601113
580.7576440.4847120.242356


Meta Analysis of Goldfeld-Quandt test for Heteroskedasticity
Description# significant tests% significant testsOK/NOK
1% type I error level00OK
5% type I error level70.12963NOK
10% type I error level110.203704NOK

\begin{tabular}{lllllllll}
\hline
Meta Analysis of Goldfeld-Quandt test for Heteroskedasticity \tabularnewline
Description & # significant tests & % significant tests & OK/NOK \tabularnewline
1% type I error level & 0 & 0 & OK \tabularnewline
5% type I error level & 7 & 0.12963 & NOK \tabularnewline
10% type I error level & 11 & 0.203704 & NOK \tabularnewline
\hline
\end{tabular}
%Source: https://freestatistics.org/blog/index.php?pk=266659&T=6

[TABLE]
[ROW][C]Meta Analysis of Goldfeld-Quandt test for Heteroskedasticity[/C][/ROW]
[ROW][C]Description[/C][C]# significant tests[/C][C]% significant tests[/C][C]OK/NOK[/C][/ROW]
[ROW][C]1% type I error level[/C][C]0[/C][C]0[/C][C]OK[/C][/ROW]
[ROW][C]5% type I error level[/C][C]7[/C][C]0.12963[/C][C]NOK[/C][/ROW]
[ROW][C]10% type I error level[/C][C]11[/C][C]0.203704[/C][C]NOK[/C][/ROW]
[/TABLE]
Source: https://freestatistics.org/blog/index.php?pk=266659&T=6

Globally Unique Identifier (entire table): ba.freestatistics.org/blog/index.php?pk=266659&T=6

As an alternative you can also use a QR Code:  

The GUIDs for individual cells are displayed in the table below:

Meta Analysis of Goldfeld-Quandt test for Heteroskedasticity
Description# significant tests% significant testsOK/NOK
1% type I error level00OK
5% type I error level70.12963NOK
10% type I error level110.203704NOK


Parameters (Session):
par1 = 2 ; par2 = Do not include Seasonal Dummies ; par3 = No Linear Trend ;
Parameters (R input):
par1 = 2 ; par2 = Do not include Seasonal Dummies ; par3 = No Linear Trend ;
R code (references can be found in the software module):
library(lattice)
library(lmtest)
n25 <- 25 #minimum number of obs. for Goldfeld-Quandt test
par1 <- as.numeric(par1)
x <- t(y)
k <- length(x[1,])
n <- length(x[,1])
x1 <- cbind(x[,par1], x[,1:k!=par1])
mycolnames <- c(colnames(x)[par1], colnames(x)[1:k!=par1])
colnames(x1) <- mycolnames #colnames(x)[par1]
x <- x1
if (par3 == 'First Differences'){
x2 <- array(0, dim=c(n-1,k), dimnames=list(1:(n-1), paste('(1-B)',colnames(x),sep='')))
for (i in 1:n-1) {
for (j in 1:k) {
x2[i,j] <- x[i+1,j] - x[i,j]
}
}
x <- x2
}
if (par2 == 'Include Monthly Dummies'){
x2 <- array(0, dim=c(n,11), dimnames=list(1:n, paste('M', seq(1:11), sep ='')))
for (i in 1:11){
x2[seq(i,n,12),i] <- 1
}
x <- cbind(x, x2)
}
if (par2 == 'Include Quarterly Dummies'){
x2 <- array(0, dim=c(n,3), dimnames=list(1:n, paste('Q', seq(1:3), sep ='')))
for (i in 1:3){
x2[seq(i,n,4),i] <- 1
}
x <- cbind(x, x2)
}
k <- length(x[1,])
if (par3 == 'Linear Trend'){
x <- cbind(x, c(1:n))
colnames(x)[k+1] <- 't'
}
x
k <- length(x[1,])
df <- as.data.frame(x)
(mylm <- lm(df))
(mysum <- summary(mylm))
if (n > n25) {
kp3 <- k + 3
nmkm3 <- n - k - 3
gqarr <- array(NA, dim=c(nmkm3-kp3+1,3))
numgqtests <- 0
numsignificant1 <- 0
numsignificant5 <- 0
numsignificant10 <- 0
for (mypoint in kp3:nmkm3) {
j <- 0
numgqtests <- numgqtests + 1
for (myalt in c('greater', 'two.sided', 'less')) {
j <- j + 1
gqarr[mypoint-kp3+1,j] <- gqtest(mylm, point=mypoint, alternative=myalt)$p.value
}
if (gqarr[mypoint-kp3+1,2] < 0.01) numsignificant1 <- numsignificant1 + 1
if (gqarr[mypoint-kp3+1,2] < 0.05) numsignificant5 <- numsignificant5 + 1
if (gqarr[mypoint-kp3+1,2] < 0.10) numsignificant10 <- numsignificant10 + 1
}
gqarr
}
bitmap(file='test0.png')
plot(x[,1], type='l', main='Actuals and Interpolation', ylab='value of Actuals and Interpolation (dots)', xlab='time or index')
points(x[,1]-mysum$resid)
grid()
dev.off()
bitmap(file='test1.png')
plot(mysum$resid, type='b', pch=19, main='Residuals', ylab='value of Residuals', xlab='time or index')
grid()
dev.off()
bitmap(file='test2.png')
hist(mysum$resid, main='Residual Histogram', xlab='values of Residuals')
grid()
dev.off()
bitmap(file='test3.png')
densityplot(~mysum$resid,col='black',main='Residual Density Plot', xlab='values of Residuals')
dev.off()
bitmap(file='test4.png')
qqnorm(mysum$resid, main='Residual Normal Q-Q Plot')
qqline(mysum$resid)
grid()
dev.off()
(myerror <- as.ts(mysum$resid))
bitmap(file='test5.png')
dum <- cbind(lag(myerror,k=1),myerror)
dum
dum1 <- dum[2:length(myerror),]
dum1
z <- as.data.frame(dum1)
z
plot(z,main=paste('Residual Lag plot, lowess, and regression line'), ylab='values of Residuals', xlab='lagged values of Residuals')
lines(lowess(z))
abline(lm(z))
grid()
dev.off()
bitmap(file='test6.png')
acf(mysum$resid, lag.max=length(mysum$resid)/2, main='Residual Autocorrelation Function')
grid()
dev.off()
bitmap(file='test7.png')
pacf(mysum$resid, lag.max=length(mysum$resid)/2, main='Residual Partial Autocorrelation Function')
grid()
dev.off()
bitmap(file='test8.png')
opar <- par(mfrow = c(2,2), oma = c(0, 0, 1.1, 0))
plot(mylm, las = 1, sub='Residual Diagnostics')
par(opar)
dev.off()
if (n > n25) {
bitmap(file='test9.png')
plot(kp3:nmkm3,gqarr[,2], main='Goldfeld-Quandt test',ylab='2-sided p-value',xlab='breakpoint')
grid()
dev.off()
}
load(file='createtable')
a<-table.start()
a<-table.row.start(a)
a<-table.element(a, 'Multiple Linear Regression - Estimated Regression Equation', 1, TRUE)
a<-table.row.end(a)
myeq <- colnames(x)[1]
myeq <- paste(myeq, '[t] = ', sep='')
for (i in 1:k){
if (mysum$coefficients[i,1] > 0) myeq <- paste(myeq, '+', '')
myeq <- paste(myeq, signif(mysum$coefficients[i,1],6), sep=' ')
if (rownames(mysum$coefficients)[i] != '(Intercept)') {
myeq <- paste(myeq, rownames(mysum$coefficients)[i], sep='')
if (rownames(mysum$coefficients)[i] != 't') myeq <- paste(myeq, '[t]', sep='')
}
}
myeq <- paste(myeq, ' + e[t]')
a<-table.row.start(a)
a<-table.element(a, myeq)
a<-table.row.end(a)
a<-table.end(a)
table.save(a,file='mytable1.tab')
a<-table.start()
a<-table.row.start(a)
a<-table.element(a,hyperlink('ols1.htm','Multiple Linear Regression - Ordinary Least Squares',''), 6, TRUE)
a<-table.row.end(a)
a<-table.row.start(a)
a<-table.element(a,'Variable',header=TRUE)
a<-table.element(a,'Parameter',header=TRUE)
a<-table.element(a,'S.D.',header=TRUE)
a<-table.element(a,'T-STAT
H0: parameter = 0',header=TRUE)
a<-table.element(a,'2-tail p-value',header=TRUE)
a<-table.element(a,'1-tail p-value',header=TRUE)
a<-table.row.end(a)
for (i in 1:k){
a<-table.row.start(a)
a<-table.element(a,rownames(mysum$coefficients)[i],header=TRUE)
a<-table.element(a,signif(mysum$coefficients[i,1],6))
a<-table.element(a, signif(mysum$coefficients[i,2],6))
a<-table.element(a, signif(mysum$coefficients[i,3],4))
a<-table.element(a, signif(mysum$coefficients[i,4],6))
a<-table.element(a, signif(mysum$coefficients[i,4]/2,6))
a<-table.row.end(a)
}
a<-table.end(a)
table.save(a,file='mytable2.tab')
a<-table.start()
a<-table.row.start(a)
a<-table.element(a, 'Multiple Linear Regression - Regression Statistics', 2, TRUE)
a<-table.row.end(a)
a<-table.row.start(a)
a<-table.element(a, 'Multiple R',1,TRUE)
a<-table.element(a, signif(sqrt(mysum$r.squared),6))
a<-table.row.end(a)
a<-table.row.start(a)
a<-table.element(a, 'R-squared',1,TRUE)
a<-table.element(a, signif(mysum$r.squared,6))
a<-table.row.end(a)
a<-table.row.start(a)
a<-table.element(a, 'Adjusted R-squared',1,TRUE)
a<-table.element(a, signif(mysum$adj.r.squared,6))
a<-table.row.end(a)
a<-table.row.start(a)
a<-table.element(a, 'F-TEST (value)',1,TRUE)
a<-table.element(a, signif(mysum$fstatistic[1],6))
a<-table.row.end(a)
a<-table.row.start(a)
a<-table.element(a, 'F-TEST (DF numerator)',1,TRUE)
a<-table.element(a, signif(mysum$fstatistic[2],6))
a<-table.row.end(a)
a<-table.row.start(a)
a<-table.element(a, 'F-TEST (DF denominator)',1,TRUE)
a<-table.element(a, signif(mysum$fstatistic[3],6))
a<-table.row.end(a)
a<-table.row.start(a)
a<-table.element(a, 'p-value',1,TRUE)
a<-table.element(a, signif(1-pf(mysum$fstatistic[1],mysum$fstatistic[2],mysum$fstatistic[3]),6))
a<-table.row.end(a)
a<-table.row.start(a)
a<-table.element(a, 'Multiple Linear Regression - Residual Statistics', 2, TRUE)
a<-table.row.end(a)
a<-table.row.start(a)
a<-table.element(a, 'Residual Standard Deviation',1,TRUE)
a<-table.element(a, signif(mysum$sigma,6))
a<-table.row.end(a)
a<-table.row.start(a)
a<-table.element(a, 'Sum Squared Residuals',1,TRUE)
a<-table.element(a, signif(sum(myerror*myerror),6))
a<-table.row.end(a)
a<-table.end(a)
table.save(a,file='mytable3.tab')
a<-table.start()
a<-table.row.start(a)
a<-table.element(a, 'Multiple Linear Regression - Actuals, Interpolation, and Residuals', 4, TRUE)
a<-table.row.end(a)
a<-table.row.start(a)
a<-table.element(a, 'Time or Index', 1, TRUE)
a<-table.element(a, 'Actuals', 1, TRUE)
a<-table.element(a, 'Interpolation
Forecast', 1, TRUE)
a<-table.element(a, 'Residuals
Prediction Error', 1, TRUE)
a<-table.row.end(a)
for (i in 1:n) {
a<-table.row.start(a)
a<-table.element(a,i, 1, TRUE)
a<-table.element(a,signif(x[i],6))
a<-table.element(a,signif(x[i]-mysum$resid[i],6))
a<-table.element(a,signif(mysum$resid[i],6))
a<-table.row.end(a)
}
a<-table.end(a)
table.save(a,file='mytable4.tab')
if (n > n25) {
a<-table.start()
a<-table.row.start(a)
a<-table.element(a,'Goldfeld-Quandt test for Heteroskedasticity',4,TRUE)
a<-table.row.end(a)
a<-table.row.start(a)
a<-table.element(a,'p-values',header=TRUE)
a<-table.element(a,'Alternative Hypothesis',3,header=TRUE)
a<-table.row.end(a)
a<-table.row.start(a)
a<-table.element(a,'breakpoint index',header=TRUE)
a<-table.element(a,'greater',header=TRUE)
a<-table.element(a,'2-sided',header=TRUE)
a<-table.element(a,'less',header=TRUE)
a<-table.row.end(a)
for (mypoint in kp3:nmkm3) {
a<-table.row.start(a)
a<-table.element(a,mypoint,header=TRUE)
a<-table.element(a,signif(gqarr[mypoint-kp3+1,1],6))
a<-table.element(a,signif(gqarr[mypoint-kp3+1,2],6))
a<-table.element(a,signif(gqarr[mypoint-kp3+1,3],6))
a<-table.row.end(a)
}
a<-table.end(a)
table.save(a,file='mytable5.tab')
a<-table.start()
a<-table.row.start(a)
a<-table.element(a,'Meta Analysis of Goldfeld-Quandt test for Heteroskedasticity',4,TRUE)
a<-table.row.end(a)
a<-table.row.start(a)
a<-table.element(a,'Description',header=TRUE)
a<-table.element(a,'# significant tests',header=TRUE)
a<-table.element(a,'% significant tests',header=TRUE)
a<-table.element(a,'OK/NOK',header=TRUE)
a<-table.row.end(a)
a<-table.row.start(a)
a<-table.element(a,'1% type I error level',header=TRUE)
a<-table.element(a,signif(numsignificant1,6))
a<-table.element(a,signif(numsignificant1/numgqtests,6))
if (numsignificant1/numgqtests < 0.01) dum <- 'OK' else dum <- 'NOK'
a<-table.element(a,dum)
a<-table.row.end(a)
a<-table.row.start(a)
a<-table.element(a,'5% type I error level',header=TRUE)
a<-table.element(a,signif(numsignificant5,6))
a<-table.element(a,signif(numsignificant5/numgqtests,6))
if (numsignificant5/numgqtests < 0.05) dum <- 'OK' else dum <- 'NOK'
a<-table.element(a,dum)
a<-table.row.end(a)
a<-table.row.start(a)
a<-table.element(a,'10% type I error level',header=TRUE)
a<-table.element(a,signif(numsignificant10,6))
a<-table.element(a,signif(numsignificant10/numgqtests,6))
if (numsignificant10/numgqtests < 0.1) dum <- 'OK' else dum <- 'NOK'
a<-table.element(a,dum)
a<-table.row.end(a)
a<-table.end(a)
table.save(a,file='mytable6.tab')
}