Free Statistics

of Irreproducible Research!

Author's title

Author*The author of this computation has been verified*
R Software Modulerwasp_multipleregression.wasp
Title produced by softwareMultiple Regression
Date of computationFri, 12 Dec 2014 13:44:50 +0000
Cite this page as followsStatistical Computations at FreeStatistics.org, Office for Research Development and Education, URL https://freestatistics.org/blog/index.php?v=date/2014/Dec/12/t141839192020ny82j4alz07mn.htm/, Retrieved Thu, 16 May 2024 20:17:40 +0000
Statistical Computations at FreeStatistics.org, Office for Research Development and Education, URL https://freestatistics.org/blog/index.php?pk=266698, Retrieved Thu, 16 May 2024 20:17:40 +0000
QR Codes:

Original text written by user:
IsPrivate?No (this computation is public)
User-defined keywords
Estimated Impact77
Family? (F = Feedback message, R = changed R code, M = changed R Module, P = changed Parameters, D = changed Data)
-       [Multiple Regression] [multiple linair r...] [2014-12-12 13:44:50] [a08b5125cedeffe41bdfc3da279c5f53] [Current]
Feedback Forum

Post a new message
Dataseries X:
13 21 13 26
11 22 14 37
14 18 16 67
15 23 14 43
14 12 13 52
11 20 15 52
13 22 13 43
16 21 20 84
14 19 17 67
14 22 15 49
15 15 16 70
13 19 17 58
14 18 11 68
11 15 16 62
12 20 16 43
14 21 15 56
12 15 14 74
15 23 16 63
14 21 17 58
12 25 15 63
12 9 14 53
12 30 14 57
14 23 15 64
16 16 17 53
12 16 14 29
12 19 16 54
14 25 15 58
15 23 16 51
14 10 8 54
13 14 17 56
16 26 10 47
15 24 16 50
13 24 16 35
16 18 16 30
16 23 8 68
15 23 14 56
13 19 16 43
12 21 19 67
14 18 19 62
14 27 14 57
10 13 13 54
16 28 15 61
14 23 11 56
14 21 9 41
15 19 12 53
16 17 13 46
15 25 17 51
13 14 7 37
12 16 15 42
12 24 12 38
14 20 15 66
15 24 16 53
11 22 14 49
14 22 16 49
16 20 13 59
13 10 16 40
11 22 10 63
12 20 12 34
12 22 14 32
14 20 16 67
12 17 18 61
13 18 12 60
14 19 15 63


Summary of computational transaction
Raw Inputview raw input (R code)
Raw Outputview raw output of R engine
Computing time5 seconds
R Server'Gwilym Jenkins' @ jenkins.wessa.net

\begin{tabular}{lllllllll}
\hline
Summary of computational transaction \tabularnewline
Raw Input & view raw input (R code)  \tabularnewline
Raw Output & view raw output of R engine  \tabularnewline
Computing time & 5 seconds \tabularnewline
R Server & 'Gwilym Jenkins' @ jenkins.wessa.net \tabularnewline
\hline
\end{tabular}
%Source: https://freestatistics.org/blog/index.php?pk=266698&T=0

[TABLE]
[ROW][C]Summary of computational transaction[/C][/ROW]
[ROW][C]Raw Input[/C][C]view raw input (R code) [/C][/ROW]
[ROW][C]Raw Output[/C][C]view raw output of R engine [/C][/ROW]
[ROW][C]Computing time[/C][C]5 seconds[/C][/ROW]
[ROW][C]R Server[/C][C]'Gwilym Jenkins' @ jenkins.wessa.net[/C][/ROW]
[/TABLE]
Source: https://freestatistics.org/blog/index.php?pk=266698&T=0

Globally Unique Identifier (entire table): ba.freestatistics.org/blog/index.php?pk=266698&T=0

As an alternative you can also use a QR Code:  

The GUIDs for individual cells are displayed in the table below:

Summary of computational transaction
Raw Inputview raw input (R code)
Raw Outputview raw output of R engine
Computing time5 seconds
R Server'Gwilym Jenkins' @ jenkins.wessa.net


Multiple Linear Regression - Estimated Regression Equation
NUMERACYTOT[t] = + 10.9022 + 0.628178STRESSTOT[t] + 0.092051CONFSTATTOT[t] -0.0149848AMS.I[t] + e[t]

\begin{tabular}{lllllllll}
\hline
Multiple Linear Regression - Estimated Regression Equation \tabularnewline
NUMERACYTOT[t] =  +  10.9022 +  0.628178STRESSTOT[t] +  0.092051CONFSTATTOT[t] -0.0149848AMS.I[t]  + e[t] \tabularnewline
\hline
\end{tabular}
%Source: https://freestatistics.org/blog/index.php?pk=266698&T=1

[TABLE]
[ROW][C]Multiple Linear Regression - Estimated Regression Equation[/C][/ROW]
[ROW][C]NUMERACYTOT[t] =  +  10.9022 +  0.628178STRESSTOT[t] +  0.092051CONFSTATTOT[t] -0.0149848AMS.I[t]  + e[t][/C][/ROW]
[/TABLE]
Source: https://freestatistics.org/blog/index.php?pk=266698&T=1

Globally Unique Identifier (entire table): ba.freestatistics.org/blog/index.php?pk=266698&T=1

As an alternative you can also use a QR Code:  

The GUIDs for individual cells are displayed in the table below:

Multiple Linear Regression - Estimated Regression Equation
NUMERACYTOT[t] = + 10.9022 + 0.628178STRESSTOT[t] + 0.092051CONFSTATTOT[t] -0.0149848AMS.I[t] + e[t]


Multiple Linear Regression - Ordinary Least Squares
VariableParameterS.D.T-STATH0: parameter = 02-tail p-value1-tail p-value
(Intercept)10.90225.647071.9310.05834270.0291714
STRESSTOT0.6281780.3602581.7440.08642170.0432108
CONFSTATTOT0.0920510.2147010.42870.6696740.334837
AMS.I-0.01498480.0485901-0.30840.758870.379435

\begin{tabular}{lllllllll}
\hline
Multiple Linear Regression - Ordinary Least Squares \tabularnewline
Variable & Parameter & S.D. & T-STATH0: parameter = 0 & 2-tail p-value & 1-tail p-value \tabularnewline
(Intercept) & 10.9022 & 5.64707 & 1.931 & 0.0583427 & 0.0291714 \tabularnewline
STRESSTOT & 0.628178 & 0.360258 & 1.744 & 0.0864217 & 0.0432108 \tabularnewline
CONFSTATTOT & 0.092051 & 0.214701 & 0.4287 & 0.669674 & 0.334837 \tabularnewline
AMS.I & -0.0149848 & 0.0485901 & -0.3084 & 0.75887 & 0.379435 \tabularnewline
\hline
\end{tabular}
%Source: https://freestatistics.org/blog/index.php?pk=266698&T=2

[TABLE]
[ROW][C]Multiple Linear Regression - Ordinary Least Squares[/C][/ROW]
[ROW][C]Variable[/C][C]Parameter[/C][C]S.D.[/C][C]T-STATH0: parameter = 0[/C][C]2-tail p-value[/C][C]1-tail p-value[/C][/ROW]
[ROW][C](Intercept)[/C][C]10.9022[/C][C]5.64707[/C][C]1.931[/C][C]0.0583427[/C][C]0.0291714[/C][/ROW]
[ROW][C]STRESSTOT[/C][C]0.628178[/C][C]0.360258[/C][C]1.744[/C][C]0.0864217[/C][C]0.0432108[/C][/ROW]
[ROW][C]CONFSTATTOT[/C][C]0.092051[/C][C]0.214701[/C][C]0.4287[/C][C]0.669674[/C][C]0.334837[/C][/ROW]
[ROW][C]AMS.I[/C][C]-0.0149848[/C][C]0.0485901[/C][C]-0.3084[/C][C]0.75887[/C][C]0.379435[/C][/ROW]
[/TABLE]
Source: https://freestatistics.org/blog/index.php?pk=266698&T=2

Globally Unique Identifier (entire table): ba.freestatistics.org/blog/index.php?pk=266698&T=2

As an alternative you can also use a QR Code:  

The GUIDs for individual cells are displayed in the table below:

Multiple Linear Regression - Ordinary Least Squares
VariableParameterS.D.T-STATH0: parameter = 02-tail p-value1-tail p-value
(Intercept)10.90225.647071.9310.05834270.0291714
STRESSTOT0.6281780.3602581.7440.08642170.0432108
CONFSTATTOT0.0920510.2147010.42870.6696740.334837
AMS.I-0.01498480.0485901-0.30840.758870.379435


Multiple Linear Regression - Regression Statistics
Multiple R0.227127
R-squared0.0515867
Adjusted R-squared0.00336229
F-TEST (value)1.06972
F-TEST (DF numerator)3
F-TEST (DF denominator)59
p-value0.368909
Multiple Linear Regression - Residual Statistics
Residual Standard Deviation4.31399
Sum Squared Residuals1098.02

\begin{tabular}{lllllllll}
\hline
Multiple Linear Regression - Regression Statistics \tabularnewline
Multiple R & 0.227127 \tabularnewline
R-squared & 0.0515867 \tabularnewline
Adjusted R-squared & 0.00336229 \tabularnewline
F-TEST (value) & 1.06972 \tabularnewline
F-TEST (DF numerator) & 3 \tabularnewline
F-TEST (DF denominator) & 59 \tabularnewline
p-value & 0.368909 \tabularnewline
Multiple Linear Regression - Residual Statistics \tabularnewline
Residual Standard Deviation & 4.31399 \tabularnewline
Sum Squared Residuals & 1098.02 \tabularnewline
\hline
\end{tabular}
%Source: https://freestatistics.org/blog/index.php?pk=266698&T=3

[TABLE]
[ROW][C]Multiple Linear Regression - Regression Statistics[/C][/ROW]
[ROW][C]Multiple R[/C][C]0.227127[/C][/ROW]
[ROW][C]R-squared[/C][C]0.0515867[/C][/ROW]
[ROW][C]Adjusted R-squared[/C][C]0.00336229[/C][/ROW]
[ROW][C]F-TEST (value)[/C][C]1.06972[/C][/ROW]
[ROW][C]F-TEST (DF numerator)[/C][C]3[/C][/ROW]
[ROW][C]F-TEST (DF denominator)[/C][C]59[/C][/ROW]
[ROW][C]p-value[/C][C]0.368909[/C][/ROW]
[ROW][C]Multiple Linear Regression - Residual Statistics[/C][/ROW]
[ROW][C]Residual Standard Deviation[/C][C]4.31399[/C][/ROW]
[ROW][C]Sum Squared Residuals[/C][C]1098.02[/C][/ROW]
[/TABLE]
Source: https://freestatistics.org/blog/index.php?pk=266698&T=3

Globally Unique Identifier (entire table): ba.freestatistics.org/blog/index.php?pk=266698&T=3

As an alternative you can also use a QR Code:  

The GUIDs for individual cells are displayed in the table below:

Multiple Linear Regression - Regression Statistics
Multiple R0.227127
R-squared0.0515867
Adjusted R-squared0.00336229
F-TEST (value)1.06972
F-TEST (DF numerator)3
F-TEST (DF denominator)59
p-value0.368909
Multiple Linear Regression - Residual Statistics
Residual Standard Deviation4.31399
Sum Squared Residuals1098.02


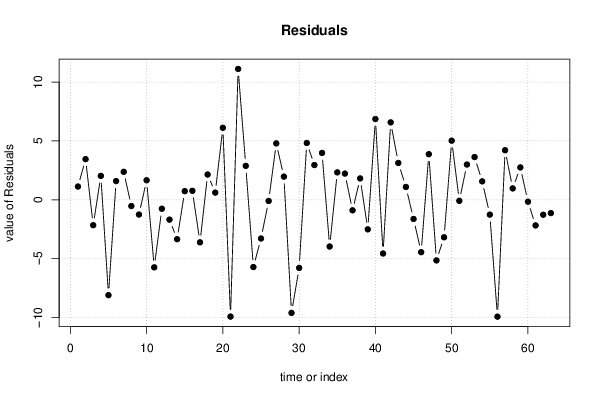
Multiple Linear Regression - Actuals, Interpolation, and Residuals
Time or IndexActualsInterpolationForecastResidualsPrediction Error
12119.87561.12439
22218.54653.45353
31820.1656-2.16556
42320.96932.03073
51220.1142-8.11418
62018.41371.58625
72219.62092.37913
82121.5354-0.53538
91920.2576-1.25761
102220.34321.65676
111520.7488-5.74879
121919.7643-0.764299
131819.6903-1.69032
141518.356-3.35595
152019.26880.731158
162120.23830.761656
171518.6202-3.62021
182320.85372.14632
192120.39250.607523
202518.87716.12291
21918.9349-9.93489
223018.87511.125
232320.11852.88153
241621.7238-5.72376
251619.2945-3.29453
261919.104-0.104009
272520.20844.79163
282321.03351.9665
291019.624-9.62396
301419.7943-5.79427
312621.16934.83069
322421.04852.95152
332420.01693.9831
341821.9764-3.97636
352320.67052.32947
362320.77452.22553
371919.897-0.89702
382119.18541.81464
391820.5166-2.51664
402720.13136.86869
411317.5715-4.5715
422821.41986.58022
432319.87013.12986
442119.91081.08919
451920.6353-1.63532
461721.4604-4.46045
472521.12553.87445
481419.1585-5.15847
491619.1918-3.19178
502418.97565.02444
512020.0885-0.088496
522421.00352.99647
532218.36673.63335
542220.43531.56471
552021.2656-1.26564
561019.942-9.94197
572217.78874.21134
582019.03550.964499
592219.24962.75043
602020.1656-0.165562
611719.1832-2.18322
621819.2741-1.27407
631920.1335-1.13345

\begin{tabular}{lllllllll}
\hline
Multiple Linear Regression - Actuals, Interpolation, and Residuals \tabularnewline
Time or Index & Actuals & InterpolationForecast & ResidualsPrediction Error \tabularnewline
1 & 21 & 19.8756 & 1.12439 \tabularnewline
2 & 22 & 18.5465 & 3.45353 \tabularnewline
3 & 18 & 20.1656 & -2.16556 \tabularnewline
4 & 23 & 20.9693 & 2.03073 \tabularnewline
5 & 12 & 20.1142 & -8.11418 \tabularnewline
6 & 20 & 18.4137 & 1.58625 \tabularnewline
7 & 22 & 19.6209 & 2.37913 \tabularnewline
8 & 21 & 21.5354 & -0.53538 \tabularnewline
9 & 19 & 20.2576 & -1.25761 \tabularnewline
10 & 22 & 20.3432 & 1.65676 \tabularnewline
11 & 15 & 20.7488 & -5.74879 \tabularnewline
12 & 19 & 19.7643 & -0.764299 \tabularnewline
13 & 18 & 19.6903 & -1.69032 \tabularnewline
14 & 15 & 18.356 & -3.35595 \tabularnewline
15 & 20 & 19.2688 & 0.731158 \tabularnewline
16 & 21 & 20.2383 & 0.761656 \tabularnewline
17 & 15 & 18.6202 & -3.62021 \tabularnewline
18 & 23 & 20.8537 & 2.14632 \tabularnewline
19 & 21 & 20.3925 & 0.607523 \tabularnewline
20 & 25 & 18.8771 & 6.12291 \tabularnewline
21 & 9 & 18.9349 & -9.93489 \tabularnewline
22 & 30 & 18.875 & 11.125 \tabularnewline
23 & 23 & 20.1185 & 2.88153 \tabularnewline
24 & 16 & 21.7238 & -5.72376 \tabularnewline
25 & 16 & 19.2945 & -3.29453 \tabularnewline
26 & 19 & 19.104 & -0.104009 \tabularnewline
27 & 25 & 20.2084 & 4.79163 \tabularnewline
28 & 23 & 21.0335 & 1.9665 \tabularnewline
29 & 10 & 19.624 & -9.62396 \tabularnewline
30 & 14 & 19.7943 & -5.79427 \tabularnewline
31 & 26 & 21.1693 & 4.83069 \tabularnewline
32 & 24 & 21.0485 & 2.95152 \tabularnewline
33 & 24 & 20.0169 & 3.9831 \tabularnewline
34 & 18 & 21.9764 & -3.97636 \tabularnewline
35 & 23 & 20.6705 & 2.32947 \tabularnewline
36 & 23 & 20.7745 & 2.22553 \tabularnewline
37 & 19 & 19.897 & -0.89702 \tabularnewline
38 & 21 & 19.1854 & 1.81464 \tabularnewline
39 & 18 & 20.5166 & -2.51664 \tabularnewline
40 & 27 & 20.1313 & 6.86869 \tabularnewline
41 & 13 & 17.5715 & -4.5715 \tabularnewline
42 & 28 & 21.4198 & 6.58022 \tabularnewline
43 & 23 & 19.8701 & 3.12986 \tabularnewline
44 & 21 & 19.9108 & 1.08919 \tabularnewline
45 & 19 & 20.6353 & -1.63532 \tabularnewline
46 & 17 & 21.4604 & -4.46045 \tabularnewline
47 & 25 & 21.1255 & 3.87445 \tabularnewline
48 & 14 & 19.1585 & -5.15847 \tabularnewline
49 & 16 & 19.1918 & -3.19178 \tabularnewline
50 & 24 & 18.9756 & 5.02444 \tabularnewline
51 & 20 & 20.0885 & -0.088496 \tabularnewline
52 & 24 & 21.0035 & 2.99647 \tabularnewline
53 & 22 & 18.3667 & 3.63335 \tabularnewline
54 & 22 & 20.4353 & 1.56471 \tabularnewline
55 & 20 & 21.2656 & -1.26564 \tabularnewline
56 & 10 & 19.942 & -9.94197 \tabularnewline
57 & 22 & 17.7887 & 4.21134 \tabularnewline
58 & 20 & 19.0355 & 0.964499 \tabularnewline
59 & 22 & 19.2496 & 2.75043 \tabularnewline
60 & 20 & 20.1656 & -0.165562 \tabularnewline
61 & 17 & 19.1832 & -2.18322 \tabularnewline
62 & 18 & 19.2741 & -1.27407 \tabularnewline
63 & 19 & 20.1335 & -1.13345 \tabularnewline
\hline
\end{tabular}
%Source: https://freestatistics.org/blog/index.php?pk=266698&T=4

[TABLE]
[ROW][C]Multiple Linear Regression - Actuals, Interpolation, and Residuals[/C][/ROW]
[ROW][C]Time or Index[/C][C]Actuals[/C][C]InterpolationForecast[/C][C]ResidualsPrediction Error[/C][/ROW]
[ROW][C]1[/C][C]21[/C][C]19.8756[/C][C]1.12439[/C][/ROW]
[ROW][C]2[/C][C]22[/C][C]18.5465[/C][C]3.45353[/C][/ROW]
[ROW][C]3[/C][C]18[/C][C]20.1656[/C][C]-2.16556[/C][/ROW]
[ROW][C]4[/C][C]23[/C][C]20.9693[/C][C]2.03073[/C][/ROW]
[ROW][C]5[/C][C]12[/C][C]20.1142[/C][C]-8.11418[/C][/ROW]
[ROW][C]6[/C][C]20[/C][C]18.4137[/C][C]1.58625[/C][/ROW]
[ROW][C]7[/C][C]22[/C][C]19.6209[/C][C]2.37913[/C][/ROW]
[ROW][C]8[/C][C]21[/C][C]21.5354[/C][C]-0.53538[/C][/ROW]
[ROW][C]9[/C][C]19[/C][C]20.2576[/C][C]-1.25761[/C][/ROW]
[ROW][C]10[/C][C]22[/C][C]20.3432[/C][C]1.65676[/C][/ROW]
[ROW][C]11[/C][C]15[/C][C]20.7488[/C][C]-5.74879[/C][/ROW]
[ROW][C]12[/C][C]19[/C][C]19.7643[/C][C]-0.764299[/C][/ROW]
[ROW][C]13[/C][C]18[/C][C]19.6903[/C][C]-1.69032[/C][/ROW]
[ROW][C]14[/C][C]15[/C][C]18.356[/C][C]-3.35595[/C][/ROW]
[ROW][C]15[/C][C]20[/C][C]19.2688[/C][C]0.731158[/C][/ROW]
[ROW][C]16[/C][C]21[/C][C]20.2383[/C][C]0.761656[/C][/ROW]
[ROW][C]17[/C][C]15[/C][C]18.6202[/C][C]-3.62021[/C][/ROW]
[ROW][C]18[/C][C]23[/C][C]20.8537[/C][C]2.14632[/C][/ROW]
[ROW][C]19[/C][C]21[/C][C]20.3925[/C][C]0.607523[/C][/ROW]
[ROW][C]20[/C][C]25[/C][C]18.8771[/C][C]6.12291[/C][/ROW]
[ROW][C]21[/C][C]9[/C][C]18.9349[/C][C]-9.93489[/C][/ROW]
[ROW][C]22[/C][C]30[/C][C]18.875[/C][C]11.125[/C][/ROW]
[ROW][C]23[/C][C]23[/C][C]20.1185[/C][C]2.88153[/C][/ROW]
[ROW][C]24[/C][C]16[/C][C]21.7238[/C][C]-5.72376[/C][/ROW]
[ROW][C]25[/C][C]16[/C][C]19.2945[/C][C]-3.29453[/C][/ROW]
[ROW][C]26[/C][C]19[/C][C]19.104[/C][C]-0.104009[/C][/ROW]
[ROW][C]27[/C][C]25[/C][C]20.2084[/C][C]4.79163[/C][/ROW]
[ROW][C]28[/C][C]23[/C][C]21.0335[/C][C]1.9665[/C][/ROW]
[ROW][C]29[/C][C]10[/C][C]19.624[/C][C]-9.62396[/C][/ROW]
[ROW][C]30[/C][C]14[/C][C]19.7943[/C][C]-5.79427[/C][/ROW]
[ROW][C]31[/C][C]26[/C][C]21.1693[/C][C]4.83069[/C][/ROW]
[ROW][C]32[/C][C]24[/C][C]21.0485[/C][C]2.95152[/C][/ROW]
[ROW][C]33[/C][C]24[/C][C]20.0169[/C][C]3.9831[/C][/ROW]
[ROW][C]34[/C][C]18[/C][C]21.9764[/C][C]-3.97636[/C][/ROW]
[ROW][C]35[/C][C]23[/C][C]20.6705[/C][C]2.32947[/C][/ROW]
[ROW][C]36[/C][C]23[/C][C]20.7745[/C][C]2.22553[/C][/ROW]
[ROW][C]37[/C][C]19[/C][C]19.897[/C][C]-0.89702[/C][/ROW]
[ROW][C]38[/C][C]21[/C][C]19.1854[/C][C]1.81464[/C][/ROW]
[ROW][C]39[/C][C]18[/C][C]20.5166[/C][C]-2.51664[/C][/ROW]
[ROW][C]40[/C][C]27[/C][C]20.1313[/C][C]6.86869[/C][/ROW]
[ROW][C]41[/C][C]13[/C][C]17.5715[/C][C]-4.5715[/C][/ROW]
[ROW][C]42[/C][C]28[/C][C]21.4198[/C][C]6.58022[/C][/ROW]
[ROW][C]43[/C][C]23[/C][C]19.8701[/C][C]3.12986[/C][/ROW]
[ROW][C]44[/C][C]21[/C][C]19.9108[/C][C]1.08919[/C][/ROW]
[ROW][C]45[/C][C]19[/C][C]20.6353[/C][C]-1.63532[/C][/ROW]
[ROW][C]46[/C][C]17[/C][C]21.4604[/C][C]-4.46045[/C][/ROW]
[ROW][C]47[/C][C]25[/C][C]21.1255[/C][C]3.87445[/C][/ROW]
[ROW][C]48[/C][C]14[/C][C]19.1585[/C][C]-5.15847[/C][/ROW]
[ROW][C]49[/C][C]16[/C][C]19.1918[/C][C]-3.19178[/C][/ROW]
[ROW][C]50[/C][C]24[/C][C]18.9756[/C][C]5.02444[/C][/ROW]
[ROW][C]51[/C][C]20[/C][C]20.0885[/C][C]-0.088496[/C][/ROW]
[ROW][C]52[/C][C]24[/C][C]21.0035[/C][C]2.99647[/C][/ROW]
[ROW][C]53[/C][C]22[/C][C]18.3667[/C][C]3.63335[/C][/ROW]
[ROW][C]54[/C][C]22[/C][C]20.4353[/C][C]1.56471[/C][/ROW]
[ROW][C]55[/C][C]20[/C][C]21.2656[/C][C]-1.26564[/C][/ROW]
[ROW][C]56[/C][C]10[/C][C]19.942[/C][C]-9.94197[/C][/ROW]
[ROW][C]57[/C][C]22[/C][C]17.7887[/C][C]4.21134[/C][/ROW]
[ROW][C]58[/C][C]20[/C][C]19.0355[/C][C]0.964499[/C][/ROW]
[ROW][C]59[/C][C]22[/C][C]19.2496[/C][C]2.75043[/C][/ROW]
[ROW][C]60[/C][C]20[/C][C]20.1656[/C][C]-0.165562[/C][/ROW]
[ROW][C]61[/C][C]17[/C][C]19.1832[/C][C]-2.18322[/C][/ROW]
[ROW][C]62[/C][C]18[/C][C]19.2741[/C][C]-1.27407[/C][/ROW]
[ROW][C]63[/C][C]19[/C][C]20.1335[/C][C]-1.13345[/C][/ROW]
[/TABLE]
Source: https://freestatistics.org/blog/index.php?pk=266698&T=4

Globally Unique Identifier (entire table): ba.freestatistics.org/blog/index.php?pk=266698&T=4

As an alternative you can also use a QR Code:  

The GUIDs for individual cells are displayed in the table below:

Multiple Linear Regression - Actuals, Interpolation, and Residuals
Time or IndexActualsInterpolationForecastResidualsPrediction Error
12119.87561.12439
22218.54653.45353
31820.1656-2.16556
42320.96932.03073
51220.1142-8.11418
62018.41371.58625
72219.62092.37913
82121.5354-0.53538
91920.2576-1.25761
102220.34321.65676
111520.7488-5.74879
121919.7643-0.764299
131819.6903-1.69032
141518.356-3.35595
152019.26880.731158
162120.23830.761656
171518.6202-3.62021
182320.85372.14632
192120.39250.607523
202518.87716.12291
21918.9349-9.93489
223018.87511.125
232320.11852.88153
241621.7238-5.72376
251619.2945-3.29453
261919.104-0.104009
272520.20844.79163
282321.03351.9665
291019.624-9.62396
301419.7943-5.79427
312621.16934.83069
322421.04852.95152
332420.01693.9831
341821.9764-3.97636
352320.67052.32947
362320.77452.22553
371919.897-0.89702
382119.18541.81464
391820.5166-2.51664
402720.13136.86869
411317.5715-4.5715
422821.41986.58022
432319.87013.12986
442119.91081.08919
451920.6353-1.63532
461721.4604-4.46045
472521.12553.87445
481419.1585-5.15847
491619.1918-3.19178
502418.97565.02444
512020.0885-0.088496
522421.00352.99647
532218.36673.63335
542220.43531.56471
552021.2656-1.26564
561019.942-9.94197
572217.78874.21134
582019.03550.964499
592219.24962.75043
602020.1656-0.165562
611719.1832-2.18322
621819.2741-1.27407
631920.1335-1.13345


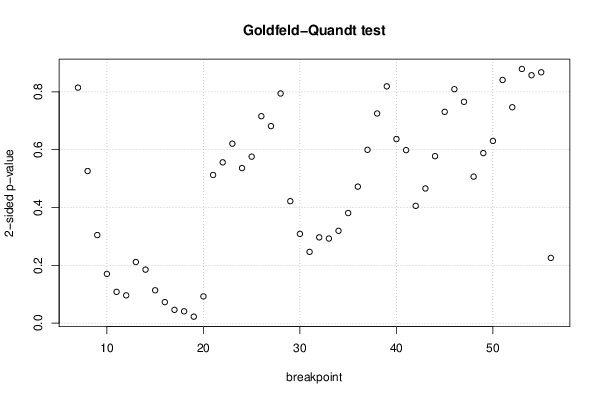
Goldfeld-Quandt test for Heteroskedasticity
p-valuesAlternative Hypothesis
breakpoint indexgreater2-sidedless
70.4072050.8144090.592795
80.2629920.5259850.737008
90.1522660.3045320.847734
100.08506570.1701310.914934
110.05405080.1081020.945949
120.04796580.09593160.952034
130.1056430.2112850.894357
140.09245860.1849170.907541
150.05677620.1135520.943224
160.03627080.07254150.963729
170.02295010.04590030.97705
180.02041670.04083340.979583
190.01116080.02232160.988839
200.04620230.09240450.953798
210.2561350.5122690.743865
220.7219390.5561230.278061
230.6897350.620530.310265
240.7319260.5361480.268074
250.7121680.5756650.287832
260.6422180.7155650.357782
270.6593360.6813280.340664
280.6028980.7942050.397102
290.789140.421720.21086
300.8457050.308590.154295
310.8767940.2464120.123206
320.8516870.2966250.148313
330.8537540.2924910.146246
340.8403840.3192310.159616
350.8096680.3806650.190332
360.7639830.4720350.236017
370.7003210.5993590.299679
380.6374860.7250290.362514
390.5905810.8188390.409419
400.6816670.6366660.318333
410.700810.598380.29919
420.7972740.4054520.202726
430.7672140.4655730.232786
440.7112960.5774080.288704
450.6346770.7306460.365323
460.5954710.8090570.404529
470.6173320.7653350.382668
480.7467080.5065850.253292
490.7059970.5880060.294003
500.6850090.6299820.314991
510.5795440.8409130.420456
520.6267550.7464890.373245
530.5604990.8790020.439501
540.5713740.8572530.428626
550.4337480.8674950.566252
560.8872890.2254230.112711

\begin{tabular}{lllllllll}
\hline
Goldfeld-Quandt test for Heteroskedasticity \tabularnewline
p-values & Alternative Hypothesis \tabularnewline
breakpoint index & greater & 2-sided & less \tabularnewline
7 & 0.407205 & 0.814409 & 0.592795 \tabularnewline
8 & 0.262992 & 0.525985 & 0.737008 \tabularnewline
9 & 0.152266 & 0.304532 & 0.847734 \tabularnewline
10 & 0.0850657 & 0.170131 & 0.914934 \tabularnewline
11 & 0.0540508 & 0.108102 & 0.945949 \tabularnewline
12 & 0.0479658 & 0.0959316 & 0.952034 \tabularnewline
13 & 0.105643 & 0.211285 & 0.894357 \tabularnewline
14 & 0.0924586 & 0.184917 & 0.907541 \tabularnewline
15 & 0.0567762 & 0.113552 & 0.943224 \tabularnewline
16 & 0.0362708 & 0.0725415 & 0.963729 \tabularnewline
17 & 0.0229501 & 0.0459003 & 0.97705 \tabularnewline
18 & 0.0204167 & 0.0408334 & 0.979583 \tabularnewline
19 & 0.0111608 & 0.0223216 & 0.988839 \tabularnewline
20 & 0.0462023 & 0.0924045 & 0.953798 \tabularnewline
21 & 0.256135 & 0.512269 & 0.743865 \tabularnewline
22 & 0.721939 & 0.556123 & 0.278061 \tabularnewline
23 & 0.689735 & 0.62053 & 0.310265 \tabularnewline
24 & 0.731926 & 0.536148 & 0.268074 \tabularnewline
25 & 0.712168 & 0.575665 & 0.287832 \tabularnewline
26 & 0.642218 & 0.715565 & 0.357782 \tabularnewline
27 & 0.659336 & 0.681328 & 0.340664 \tabularnewline
28 & 0.602898 & 0.794205 & 0.397102 \tabularnewline
29 & 0.78914 & 0.42172 & 0.21086 \tabularnewline
30 & 0.845705 & 0.30859 & 0.154295 \tabularnewline
31 & 0.876794 & 0.246412 & 0.123206 \tabularnewline
32 & 0.851687 & 0.296625 & 0.148313 \tabularnewline
33 & 0.853754 & 0.292491 & 0.146246 \tabularnewline
34 & 0.840384 & 0.319231 & 0.159616 \tabularnewline
35 & 0.809668 & 0.380665 & 0.190332 \tabularnewline
36 & 0.763983 & 0.472035 & 0.236017 \tabularnewline
37 & 0.700321 & 0.599359 & 0.299679 \tabularnewline
38 & 0.637486 & 0.725029 & 0.362514 \tabularnewline
39 & 0.590581 & 0.818839 & 0.409419 \tabularnewline
40 & 0.681667 & 0.636666 & 0.318333 \tabularnewline
41 & 0.70081 & 0.59838 & 0.29919 \tabularnewline
42 & 0.797274 & 0.405452 & 0.202726 \tabularnewline
43 & 0.767214 & 0.465573 & 0.232786 \tabularnewline
44 & 0.711296 & 0.577408 & 0.288704 \tabularnewline
45 & 0.634677 & 0.730646 & 0.365323 \tabularnewline
46 & 0.595471 & 0.809057 & 0.404529 \tabularnewline
47 & 0.617332 & 0.765335 & 0.382668 \tabularnewline
48 & 0.746708 & 0.506585 & 0.253292 \tabularnewline
49 & 0.705997 & 0.588006 & 0.294003 \tabularnewline
50 & 0.685009 & 0.629982 & 0.314991 \tabularnewline
51 & 0.579544 & 0.840913 & 0.420456 \tabularnewline
52 & 0.626755 & 0.746489 & 0.373245 \tabularnewline
53 & 0.560499 & 0.879002 & 0.439501 \tabularnewline
54 & 0.571374 & 0.857253 & 0.428626 \tabularnewline
55 & 0.433748 & 0.867495 & 0.566252 \tabularnewline
56 & 0.887289 & 0.225423 & 0.112711 \tabularnewline
\hline
\end{tabular}
%Source: https://freestatistics.org/blog/index.php?pk=266698&T=5

[TABLE]
[ROW][C]Goldfeld-Quandt test for Heteroskedasticity[/C][/ROW]
[ROW][C]p-values[/C][C]Alternative Hypothesis[/C][/ROW]
[ROW][C]breakpoint index[/C][C]greater[/C][C]2-sided[/C][C]less[/C][/ROW]
[ROW][C]7[/C][C]0.407205[/C][C]0.814409[/C][C]0.592795[/C][/ROW]
[ROW][C]8[/C][C]0.262992[/C][C]0.525985[/C][C]0.737008[/C][/ROW]
[ROW][C]9[/C][C]0.152266[/C][C]0.304532[/C][C]0.847734[/C][/ROW]
[ROW][C]10[/C][C]0.0850657[/C][C]0.170131[/C][C]0.914934[/C][/ROW]
[ROW][C]11[/C][C]0.0540508[/C][C]0.108102[/C][C]0.945949[/C][/ROW]
[ROW][C]12[/C][C]0.0479658[/C][C]0.0959316[/C][C]0.952034[/C][/ROW]
[ROW][C]13[/C][C]0.105643[/C][C]0.211285[/C][C]0.894357[/C][/ROW]
[ROW][C]14[/C][C]0.0924586[/C][C]0.184917[/C][C]0.907541[/C][/ROW]
[ROW][C]15[/C][C]0.0567762[/C][C]0.113552[/C][C]0.943224[/C][/ROW]
[ROW][C]16[/C][C]0.0362708[/C][C]0.0725415[/C][C]0.963729[/C][/ROW]
[ROW][C]17[/C][C]0.0229501[/C][C]0.0459003[/C][C]0.97705[/C][/ROW]
[ROW][C]18[/C][C]0.0204167[/C][C]0.0408334[/C][C]0.979583[/C][/ROW]
[ROW][C]19[/C][C]0.0111608[/C][C]0.0223216[/C][C]0.988839[/C][/ROW]
[ROW][C]20[/C][C]0.0462023[/C][C]0.0924045[/C][C]0.953798[/C][/ROW]
[ROW][C]21[/C][C]0.256135[/C][C]0.512269[/C][C]0.743865[/C][/ROW]
[ROW][C]22[/C][C]0.721939[/C][C]0.556123[/C][C]0.278061[/C][/ROW]
[ROW][C]23[/C][C]0.689735[/C][C]0.62053[/C][C]0.310265[/C][/ROW]
[ROW][C]24[/C][C]0.731926[/C][C]0.536148[/C][C]0.268074[/C][/ROW]
[ROW][C]25[/C][C]0.712168[/C][C]0.575665[/C][C]0.287832[/C][/ROW]
[ROW][C]26[/C][C]0.642218[/C][C]0.715565[/C][C]0.357782[/C][/ROW]
[ROW][C]27[/C][C]0.659336[/C][C]0.681328[/C][C]0.340664[/C][/ROW]
[ROW][C]28[/C][C]0.602898[/C][C]0.794205[/C][C]0.397102[/C][/ROW]
[ROW][C]29[/C][C]0.78914[/C][C]0.42172[/C][C]0.21086[/C][/ROW]
[ROW][C]30[/C][C]0.845705[/C][C]0.30859[/C][C]0.154295[/C][/ROW]
[ROW][C]31[/C][C]0.876794[/C][C]0.246412[/C][C]0.123206[/C][/ROW]
[ROW][C]32[/C][C]0.851687[/C][C]0.296625[/C][C]0.148313[/C][/ROW]
[ROW][C]33[/C][C]0.853754[/C][C]0.292491[/C][C]0.146246[/C][/ROW]
[ROW][C]34[/C][C]0.840384[/C][C]0.319231[/C][C]0.159616[/C][/ROW]
[ROW][C]35[/C][C]0.809668[/C][C]0.380665[/C][C]0.190332[/C][/ROW]
[ROW][C]36[/C][C]0.763983[/C][C]0.472035[/C][C]0.236017[/C][/ROW]
[ROW][C]37[/C][C]0.700321[/C][C]0.599359[/C][C]0.299679[/C][/ROW]
[ROW][C]38[/C][C]0.637486[/C][C]0.725029[/C][C]0.362514[/C][/ROW]
[ROW][C]39[/C][C]0.590581[/C][C]0.818839[/C][C]0.409419[/C][/ROW]
[ROW][C]40[/C][C]0.681667[/C][C]0.636666[/C][C]0.318333[/C][/ROW]
[ROW][C]41[/C][C]0.70081[/C][C]0.59838[/C][C]0.29919[/C][/ROW]
[ROW][C]42[/C][C]0.797274[/C][C]0.405452[/C][C]0.202726[/C][/ROW]
[ROW][C]43[/C][C]0.767214[/C][C]0.465573[/C][C]0.232786[/C][/ROW]
[ROW][C]44[/C][C]0.711296[/C][C]0.577408[/C][C]0.288704[/C][/ROW]
[ROW][C]45[/C][C]0.634677[/C][C]0.730646[/C][C]0.365323[/C][/ROW]
[ROW][C]46[/C][C]0.595471[/C][C]0.809057[/C][C]0.404529[/C][/ROW]
[ROW][C]47[/C][C]0.617332[/C][C]0.765335[/C][C]0.382668[/C][/ROW]
[ROW][C]48[/C][C]0.746708[/C][C]0.506585[/C][C]0.253292[/C][/ROW]
[ROW][C]49[/C][C]0.705997[/C][C]0.588006[/C][C]0.294003[/C][/ROW]
[ROW][C]50[/C][C]0.685009[/C][C]0.629982[/C][C]0.314991[/C][/ROW]
[ROW][C]51[/C][C]0.579544[/C][C]0.840913[/C][C]0.420456[/C][/ROW]
[ROW][C]52[/C][C]0.626755[/C][C]0.746489[/C][C]0.373245[/C][/ROW]
[ROW][C]53[/C][C]0.560499[/C][C]0.879002[/C][C]0.439501[/C][/ROW]
[ROW][C]54[/C][C]0.571374[/C][C]0.857253[/C][C]0.428626[/C][/ROW]
[ROW][C]55[/C][C]0.433748[/C][C]0.867495[/C][C]0.566252[/C][/ROW]
[ROW][C]56[/C][C]0.887289[/C][C]0.225423[/C][C]0.112711[/C][/ROW]
[/TABLE]
Source: https://freestatistics.org/blog/index.php?pk=266698&T=5

Globally Unique Identifier (entire table): ba.freestatistics.org/blog/index.php?pk=266698&T=5

As an alternative you can also use a QR Code:  

The GUIDs for individual cells are displayed in the table below:

Goldfeld-Quandt test for Heteroskedasticity
p-valuesAlternative Hypothesis
breakpoint indexgreater2-sidedless
70.4072050.8144090.592795
80.2629920.5259850.737008
90.1522660.3045320.847734
100.08506570.1701310.914934
110.05405080.1081020.945949
120.04796580.09593160.952034
130.1056430.2112850.894357
140.09245860.1849170.907541
150.05677620.1135520.943224
160.03627080.07254150.963729
170.02295010.04590030.97705
180.02041670.04083340.979583
190.01116080.02232160.988839
200.04620230.09240450.953798
210.2561350.5122690.743865
220.7219390.5561230.278061
230.6897350.620530.310265
240.7319260.5361480.268074
250.7121680.5756650.287832
260.6422180.7155650.357782
270.6593360.6813280.340664
280.6028980.7942050.397102
290.789140.421720.21086
300.8457050.308590.154295
310.8767940.2464120.123206
320.8516870.2966250.148313
330.8537540.2924910.146246
340.8403840.3192310.159616
350.8096680.3806650.190332
360.7639830.4720350.236017
370.7003210.5993590.299679
380.6374860.7250290.362514
390.5905810.8188390.409419
400.6816670.6366660.318333
410.700810.598380.29919
420.7972740.4054520.202726
430.7672140.4655730.232786
440.7112960.5774080.288704
450.6346770.7306460.365323
460.5954710.8090570.404529
470.6173320.7653350.382668
480.7467080.5065850.253292
490.7059970.5880060.294003
500.6850090.6299820.314991
510.5795440.8409130.420456
520.6267550.7464890.373245
530.5604990.8790020.439501
540.5713740.8572530.428626
550.4337480.8674950.566252
560.8872890.2254230.112711


Meta Analysis of Goldfeld-Quandt test for Heteroskedasticity
Description# significant tests% significant testsOK/NOK
1% type I error level00OK
5% type I error level30.06NOK
10% type I error level60.12NOK

\begin{tabular}{lllllllll}
\hline
Meta Analysis of Goldfeld-Quandt test for Heteroskedasticity \tabularnewline
Description & # significant tests & % significant tests & OK/NOK \tabularnewline
1% type I error level & 0 & 0 & OK \tabularnewline
5% type I error level & 3 & 0.06 & NOK \tabularnewline
10% type I error level & 6 & 0.12 & NOK \tabularnewline
\hline
\end{tabular}
%Source: https://freestatistics.org/blog/index.php?pk=266698&T=6

[TABLE]
[ROW][C]Meta Analysis of Goldfeld-Quandt test for Heteroskedasticity[/C][/ROW]
[ROW][C]Description[/C][C]# significant tests[/C][C]% significant tests[/C][C]OK/NOK[/C][/ROW]
[ROW][C]1% type I error level[/C][C]0[/C][C]0[/C][C]OK[/C][/ROW]
[ROW][C]5% type I error level[/C][C]3[/C][C]0.06[/C][C]NOK[/C][/ROW]
[ROW][C]10% type I error level[/C][C]6[/C][C]0.12[/C][C]NOK[/C][/ROW]
[/TABLE]
Source: https://freestatistics.org/blog/index.php?pk=266698&T=6

Globally Unique Identifier (entire table): ba.freestatistics.org/blog/index.php?pk=266698&T=6

As an alternative you can also use a QR Code:  

The GUIDs for individual cells are displayed in the table below:

Meta Analysis of Goldfeld-Quandt test for Heteroskedasticity
Description# significant tests% significant testsOK/NOK
1% type I error level00OK
5% type I error level30.06NOK
10% type I error level60.12NOK


Parameters (Session):
par1 = 2 ; par2 = Do not include Seasonal Dummies ; par3 = No Linear Trend ;
Parameters (R input):
par1 = 2 ; par2 = Do not include Seasonal Dummies ; par3 = No Linear Trend ;
R code (references can be found in the software module):
library(lattice)
library(lmtest)
n25 <- 25 #minimum number of obs. for Goldfeld-Quandt test
par1 <- as.numeric(par1)
x <- t(y)
k <- length(x[1,])
n <- length(x[,1])
x1 <- cbind(x[,par1], x[,1:k!=par1])
mycolnames <- c(colnames(x)[par1], colnames(x)[1:k!=par1])
colnames(x1) <- mycolnames #colnames(x)[par1]
x <- x1
if (par3 == 'First Differences'){
x2 <- array(0, dim=c(n-1,k), dimnames=list(1:(n-1), paste('(1-B)',colnames(x),sep='')))
for (i in 1:n-1) {
for (j in 1:k) {
x2[i,j] <- x[i+1,j] - x[i,j]
}
}
x <- x2
}
if (par2 == 'Include Monthly Dummies'){
x2 <- array(0, dim=c(n,11), dimnames=list(1:n, paste('M', seq(1:11), sep ='')))
for (i in 1:11){
x2[seq(i,n,12),i] <- 1
}
x <- cbind(x, x2)
}
if (par2 == 'Include Quarterly Dummies'){
x2 <- array(0, dim=c(n,3), dimnames=list(1:n, paste('Q', seq(1:3), sep ='')))
for (i in 1:3){
x2[seq(i,n,4),i] <- 1
}
x <- cbind(x, x2)
}
k <- length(x[1,])
if (par3 == 'Linear Trend'){
x <- cbind(x, c(1:n))
colnames(x)[k+1] <- 't'
}
x
k <- length(x[1,])
df <- as.data.frame(x)
(mylm <- lm(df))
(mysum <- summary(mylm))
if (n > n25) {
kp3 <- k + 3
nmkm3 <- n - k - 3
gqarr <- array(NA, dim=c(nmkm3-kp3+1,3))
numgqtests <- 0
numsignificant1 <- 0
numsignificant5 <- 0
numsignificant10 <- 0
for (mypoint in kp3:nmkm3) {
j <- 0
numgqtests <- numgqtests + 1
for (myalt in c('greater', 'two.sided', 'less')) {
j <- j + 1
gqarr[mypoint-kp3+1,j] <- gqtest(mylm, point=mypoint, alternative=myalt)$p.value
}
if (gqarr[mypoint-kp3+1,2] < 0.01) numsignificant1 <- numsignificant1 + 1
if (gqarr[mypoint-kp3+1,2] < 0.05) numsignificant5 <- numsignificant5 + 1
if (gqarr[mypoint-kp3+1,2] < 0.10) numsignificant10 <- numsignificant10 + 1
}
gqarr
}
bitmap(file='test0.png')
plot(x[,1], type='l', main='Actuals and Interpolation', ylab='value of Actuals and Interpolation (dots)', xlab='time or index')
points(x[,1]-mysum$resid)
grid()
dev.off()
bitmap(file='test1.png')
plot(mysum$resid, type='b', pch=19, main='Residuals', ylab='value of Residuals', xlab='time or index')
grid()
dev.off()
bitmap(file='test2.png')
hist(mysum$resid, main='Residual Histogram', xlab='values of Residuals')
grid()
dev.off()
bitmap(file='test3.png')
densityplot(~mysum$resid,col='black',main='Residual Density Plot', xlab='values of Residuals')
dev.off()
bitmap(file='test4.png')
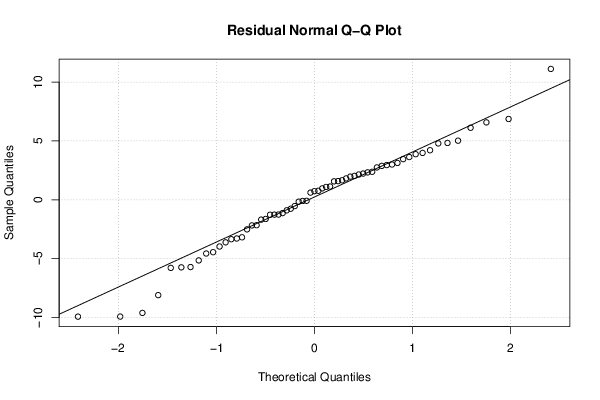
qqnorm(mysum$resid, main='Residual Normal Q-Q Plot')
qqline(mysum$resid)
grid()
dev.off()
(myerror <- as.ts(mysum$resid))
bitmap(file='test5.png')
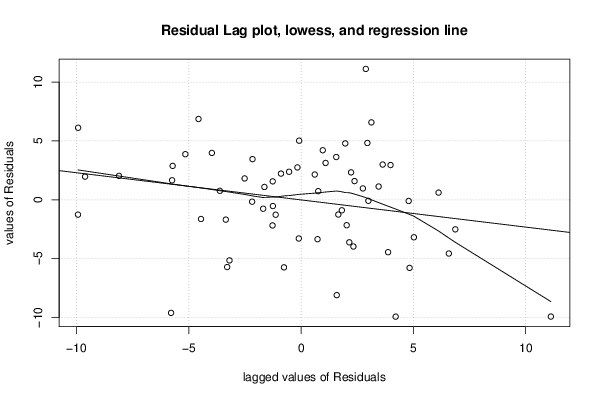
dum <- cbind(lag(myerror,k=1),myerror)
dum
dum1 <- dum[2:length(myerror),]
dum1
z <- as.data.frame(dum1)
z
plot(z,main=paste('Residual Lag plot, lowess, and regression line'), ylab='values of Residuals', xlab='lagged values of Residuals')
lines(lowess(z))
abline(lm(z))
grid()
dev.off()
bitmap(file='test6.png')
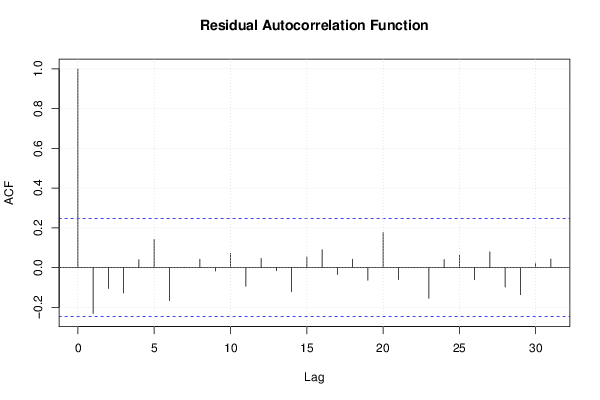
acf(mysum$resid, lag.max=length(mysum$resid)/2, main='Residual Autocorrelation Function')
grid()
dev.off()
bitmap(file='test7.png')
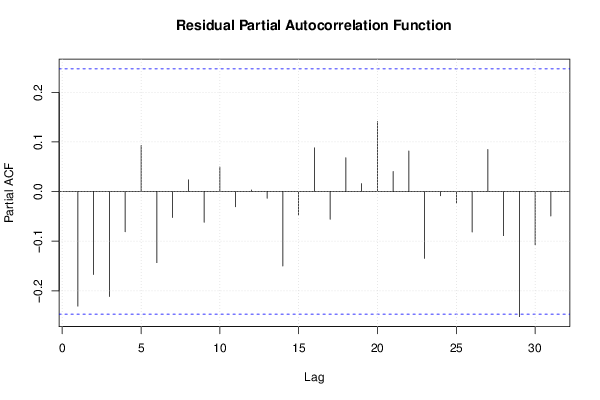
pacf(mysum$resid, lag.max=length(mysum$resid)/2, main='Residual Partial Autocorrelation Function')
grid()
dev.off()
bitmap(file='test8.png')
opar <- par(mfrow = c(2,2), oma = c(0, 0, 1.1, 0))
plot(mylm, las = 1, sub='Residual Diagnostics')
par(opar)
dev.off()
if (n > n25) {
bitmap(file='test9.png')
plot(kp3:nmkm3,gqarr[,2], main='Goldfeld-Quandt test',ylab='2-sided p-value',xlab='breakpoint')
grid()
dev.off()
}
load(file='createtable')
a<-table.start()
a<-table.row.start(a)
a<-table.element(a, 'Multiple Linear Regression - Estimated Regression Equation', 1, TRUE)
a<-table.row.end(a)
myeq <- colnames(x)[1]
myeq <- paste(myeq, '[t] = ', sep='')
for (i in 1:k){
if (mysum$coefficients[i,1] > 0) myeq <- paste(myeq, '+', '')
myeq <- paste(myeq, signif(mysum$coefficients[i,1],6), sep=' ')
if (rownames(mysum$coefficients)[i] != '(Intercept)') {
myeq <- paste(myeq, rownames(mysum$coefficients)[i], sep='')
if (rownames(mysum$coefficients)[i] != 't') myeq <- paste(myeq, '[t]', sep='')
}
}
myeq <- paste(myeq, ' + e[t]')
a<-table.row.start(a)
a<-table.element(a, myeq)
a<-table.row.end(a)
a<-table.end(a)
table.save(a,file='mytable1.tab')
a<-table.start()
a<-table.row.start(a)
a<-table.element(a,hyperlink('ols1.htm','Multiple Linear Regression - Ordinary Least Squares',''), 6, TRUE)
a<-table.row.end(a)
a<-table.row.start(a)
a<-table.element(a,'Variable',header=TRUE)
a<-table.element(a,'Parameter',header=TRUE)
a<-table.element(a,'S.D.',header=TRUE)
a<-table.element(a,'T-STAT
H0: parameter = 0',header=TRUE)
a<-table.element(a,'2-tail p-value',header=TRUE)
a<-table.element(a,'1-tail p-value',header=TRUE)
a<-table.row.end(a)
for (i in 1:k){
a<-table.row.start(a)
a<-table.element(a,rownames(mysum$coefficients)[i],header=TRUE)
a<-table.element(a,signif(mysum$coefficients[i,1],6))
a<-table.element(a, signif(mysum$coefficients[i,2],6))
a<-table.element(a, signif(mysum$coefficients[i,3],4))
a<-table.element(a, signif(mysum$coefficients[i,4],6))
a<-table.element(a, signif(mysum$coefficients[i,4]/2,6))
a<-table.row.end(a)
}
a<-table.end(a)
table.save(a,file='mytable2.tab')
a<-table.start()
a<-table.row.start(a)
a<-table.element(a, 'Multiple Linear Regression - Regression Statistics', 2, TRUE)
a<-table.row.end(a)
a<-table.row.start(a)
a<-table.element(a, 'Multiple R',1,TRUE)
a<-table.element(a, signif(sqrt(mysum$r.squared),6))
a<-table.row.end(a)
a<-table.row.start(a)
a<-table.element(a, 'R-squared',1,TRUE)
a<-table.element(a, signif(mysum$r.squared,6))
a<-table.row.end(a)
a<-table.row.start(a)
a<-table.element(a, 'Adjusted R-squared',1,TRUE)
a<-table.element(a, signif(mysum$adj.r.squared,6))
a<-table.row.end(a)
a<-table.row.start(a)
a<-table.element(a, 'F-TEST (value)',1,TRUE)
a<-table.element(a, signif(mysum$fstatistic[1],6))
a<-table.row.end(a)
a<-table.row.start(a)
a<-table.element(a, 'F-TEST (DF numerator)',1,TRUE)
a<-table.element(a, signif(mysum$fstatistic[2],6))
a<-table.row.end(a)
a<-table.row.start(a)
a<-table.element(a, 'F-TEST (DF denominator)',1,TRUE)
a<-table.element(a, signif(mysum$fstatistic[3],6))
a<-table.row.end(a)
a<-table.row.start(a)
a<-table.element(a, 'p-value',1,TRUE)
a<-table.element(a, signif(1-pf(mysum$fstatistic[1],mysum$fstatistic[2],mysum$fstatistic[3]),6))
a<-table.row.end(a)
a<-table.row.start(a)
a<-table.element(a, 'Multiple Linear Regression - Residual Statistics', 2, TRUE)
a<-table.row.end(a)
a<-table.row.start(a)
a<-table.element(a, 'Residual Standard Deviation',1,TRUE)
a<-table.element(a, signif(mysum$sigma,6))
a<-table.row.end(a)
a<-table.row.start(a)
a<-table.element(a, 'Sum Squared Residuals',1,TRUE)
a<-table.element(a, signif(sum(myerror*myerror),6))
a<-table.row.end(a)
a<-table.end(a)
table.save(a,file='mytable3.tab')
a<-table.start()
a<-table.row.start(a)
a<-table.element(a, 'Multiple Linear Regression - Actuals, Interpolation, and Residuals', 4, TRUE)
a<-table.row.end(a)
a<-table.row.start(a)
a<-table.element(a, 'Time or Index', 1, TRUE)
a<-table.element(a, 'Actuals', 1, TRUE)
a<-table.element(a, 'Interpolation
Forecast', 1, TRUE)
a<-table.element(a, 'Residuals
Prediction Error', 1, TRUE)
a<-table.row.end(a)
for (i in 1:n) {
a<-table.row.start(a)
a<-table.element(a,i, 1, TRUE)
a<-table.element(a,signif(x[i],6))
a<-table.element(a,signif(x[i]-mysum$resid[i],6))
a<-table.element(a,signif(mysum$resid[i],6))
a<-table.row.end(a)
}
a<-table.end(a)
table.save(a,file='mytable4.tab')
if (n > n25) {
a<-table.start()
a<-table.row.start(a)
a<-table.element(a,'Goldfeld-Quandt test for Heteroskedasticity',4,TRUE)
a<-table.row.end(a)
a<-table.row.start(a)
a<-table.element(a,'p-values',header=TRUE)
a<-table.element(a,'Alternative Hypothesis',3,header=TRUE)
a<-table.row.end(a)
a<-table.row.start(a)
a<-table.element(a,'breakpoint index',header=TRUE)
a<-table.element(a,'greater',header=TRUE)
a<-table.element(a,'2-sided',header=TRUE)
a<-table.element(a,'less',header=TRUE)
a<-table.row.end(a)
for (mypoint in kp3:nmkm3) {
a<-table.row.start(a)
a<-table.element(a,mypoint,header=TRUE)
a<-table.element(a,signif(gqarr[mypoint-kp3+1,1],6))
a<-table.element(a,signif(gqarr[mypoint-kp3+1,2],6))
a<-table.element(a,signif(gqarr[mypoint-kp3+1,3],6))
a<-table.row.end(a)
}
a<-table.end(a)
table.save(a,file='mytable5.tab')
a<-table.start()
a<-table.row.start(a)
a<-table.element(a,'Meta Analysis of Goldfeld-Quandt test for Heteroskedasticity',4,TRUE)
a<-table.row.end(a)
a<-table.row.start(a)
a<-table.element(a,'Description',header=TRUE)
a<-table.element(a,'# significant tests',header=TRUE)
a<-table.element(a,'% significant tests',header=TRUE)
a<-table.element(a,'OK/NOK',header=TRUE)
a<-table.row.end(a)
a<-table.row.start(a)
a<-table.element(a,'1% type I error level',header=TRUE)
a<-table.element(a,signif(numsignificant1,6))
a<-table.element(a,signif(numsignificant1/numgqtests,6))
if (numsignificant1/numgqtests < 0.01) dum <- 'OK' else dum <- 'NOK'
a<-table.element(a,dum)
a<-table.row.end(a)
a<-table.row.start(a)
a<-table.element(a,'5% type I error level',header=TRUE)
a<-table.element(a,signif(numsignificant5,6))
a<-table.element(a,signif(numsignificant5/numgqtests,6))
if (numsignificant5/numgqtests < 0.05) dum <- 'OK' else dum <- 'NOK'
a<-table.element(a,dum)
a<-table.row.end(a)
a<-table.row.start(a)
a<-table.element(a,'10% type I error level',header=TRUE)
a<-table.element(a,signif(numsignificant10,6))
a<-table.element(a,signif(numsignificant10/numgqtests,6))
if (numsignificant10/numgqtests < 0.1) dum <- 'OK' else dum <- 'NOK'
a<-table.element(a,dum)
a<-table.row.end(a)
a<-table.end(a)
table.save(a,file='mytable6.tab')
}