Free Statistics

of Irreproducible Research!

Author's title

Author*The author of this computation has been verified*
R Software Modulerwasp_multipleregression.wasp
Title produced by softwareMultiple Regression
Date of computationSat, 13 Dec 2014 12:17:16 +0000
Cite this page as followsStatistical Computations at FreeStatistics.org, Office for Research Development and Education, URL https://freestatistics.org/blog/index.php?v=date/2014/Dec/13/t1418474694shzgokhr0m5kf1p.htm/, Retrieved Thu, 16 May 2024 18:46:42 +0000
Statistical Computations at FreeStatistics.org, Office for Research Development and Education, URL https://freestatistics.org/blog/index.php?pk=267043, Retrieved Thu, 16 May 2024 18:46:42 +0000
QR Codes:

Original text written by user:
IsPrivate?No (this computation is public)
User-defined keywords
Estimated Impact90
Family? (F = Feedback message, R = changed R code, M = changed R Module, P = changed Parameters, D = changed Data)
-     [Percentiles] [Intrinsic Motivat...] [2010-10-12 12:10:58] [b98453cac15ba1066b407e146608df68]
- RMPD  [Kernel Density Estimation] [] [2011-10-18 22:42:23] [b98453cac15ba1066b407e146608df68]
- RMPD    [Percentiles] [] [2011-10-18 22:46:45] [b98453cac15ba1066b407e146608df68]
- RMPD      [Notched Boxplots] [] [2011-10-18 22:58:56] [b98453cac15ba1066b407e146608df68]
- RMPD        [Notched Boxplots] [Task4.2 WS3] [2014-10-15 16:59:07] [805021881bfa5340347077d26b077617]
-   PD          [Notched Boxplots] [Paper 12] [2014-12-13 11:13:17] [805021881bfa5340347077d26b077617]
- RMPD              [Multiple Regression] [paper 13] [2014-12-13 12:17:16] [3e8c20c2e60277acd0ccfb10a62c3907] [Current]
Feedback Forum

Post a new message
Dataseries X:
149 1.5
148 2.1
158 1.9
128 1.6
224 2.1
159 2.1
105 2.2
159 1.5
167 1.9
165 2.2
159 1.6
176 1.9
54 0.1
91 2.2
163 1.8
124 1.6
121 2.1
148 1.6
221 1.9
149 1.8
244 2.4
148 2.4
150 1.9
153 2.1
94 1.9
156 2.1
132 1.5
105 2.1
151 2.1
131 2.1
157 2.4
162 2.1
163 1.9
59 2.4
187 2.1
116 2.4
148 2.1
155 1.5
125 1.9
116 1.8
138 1.6
164 1.5
162 2.1
99 2.4
186 1.5
188 2.1
177 2.1
139 1.9
162 2.1
108 1.8
159 2.1
110 2.1
96 2.2
87 2.2
97 1.6
127 2.4
74 2.4
114 1.8
95 1.9
121 1.8
130 2.2
52 1.9


Summary of computational transaction
Raw Inputview raw input (R code)
Raw Outputview raw output of R engine
Computing time5 seconds
R Server'Gertrude Mary Cox' @ cox.wessa.net

\begin{tabular}{lllllllll}
\hline
Summary of computational transaction \tabularnewline
Raw Input & view raw input (R code)  \tabularnewline
Raw Output & view raw output of R engine  \tabularnewline
Computing time & 5 seconds \tabularnewline
R Server & 'Gertrude Mary Cox' @ cox.wessa.net \tabularnewline
\hline
\end{tabular}
%Source: https://freestatistics.org/blog/index.php?pk=267043&T=0

[TABLE]
[ROW][C]Summary of computational transaction[/C][/ROW]
[ROW][C]Raw Input[/C][C]view raw input (R code) [/C][/ROW]
[ROW][C]Raw Output[/C][C]view raw output of R engine [/C][/ROW]
[ROW][C]Computing time[/C][C]5 seconds[/C][/ROW]
[ROW][C]R Server[/C][C]'Gertrude Mary Cox' @ cox.wessa.net[/C][/ROW]
[/TABLE]
Source: https://freestatistics.org/blog/index.php?pk=267043&T=0

Globally Unique Identifier (entire table): ba.freestatistics.org/blog/index.php?pk=267043&T=0

As an alternative you can also use a QR Code:  

The GUIDs for individual cells are displayed in the table below:

Summary of computational transaction
Raw Inputview raw input (R code)
Raw Outputview raw output of R engine
Computing time5 seconds
R Server'Gertrude Mary Cox' @ cox.wessa.net


Multiple Linear Regression - Estimated Regression Equation
PA[t] = + 1.79803 + 0.00106008LFM[t] + e[t]

\begin{tabular}{lllllllll}
\hline
Multiple Linear Regression - Estimated Regression Equation \tabularnewline
PA[t] =  +  1.79803 +  0.00106008LFM[t]  + e[t] \tabularnewline
\hline
\end{tabular}
%Source: https://freestatistics.org/blog/index.php?pk=267043&T=1

[TABLE]
[ROW][C]Multiple Linear Regression - Estimated Regression Equation[/C][/ROW]
[ROW][C]PA[t] =  +  1.79803 +  0.00106008LFM[t]  + e[t][/C][/ROW]
[/TABLE]
Source: https://freestatistics.org/blog/index.php?pk=267043&T=1

Globally Unique Identifier (entire table): ba.freestatistics.org/blog/index.php?pk=267043&T=1

As an alternative you can also use a QR Code:  

The GUIDs for individual cells are displayed in the table below:

Multiple Linear Regression - Estimated Regression Equation
PA[t] = + 1.79803 + 0.00106008LFM[t] + e[t]


Multiple Linear Regression - Ordinary Least Squares
VariableParameterS.D.T-STATH0: parameter = 02-tail p-value1-tail p-value
(Intercept)1.798030.17309610.394.96881e-152.48441e-15
LFM0.001060080.001202560.88150.3815550.190777

\begin{tabular}{lllllllll}
\hline
Multiple Linear Regression - Ordinary Least Squares \tabularnewline
Variable & Parameter & S.D. & T-STATH0: parameter = 0 & 2-tail p-value & 1-tail p-value \tabularnewline
(Intercept) & 1.79803 & 0.173096 & 10.39 & 4.96881e-15 & 2.48441e-15 \tabularnewline
LFM & 0.00106008 & 0.00120256 & 0.8815 & 0.381555 & 0.190777 \tabularnewline
\hline
\end{tabular}
%Source: https://freestatistics.org/blog/index.php?pk=267043&T=2

[TABLE]
[ROW][C]Multiple Linear Regression - Ordinary Least Squares[/C][/ROW]
[ROW][C]Variable[/C][C]Parameter[/C][C]S.D.[/C][C]T-STATH0: parameter = 0[/C][C]2-tail p-value[/C][C]1-tail p-value[/C][/ROW]
[ROW][C](Intercept)[/C][C]1.79803[/C][C]0.173096[/C][C]10.39[/C][C]4.96881e-15[/C][C]2.48441e-15[/C][/ROW]
[ROW][C]LFM[/C][C]0.00106008[/C][C]0.00120256[/C][C]0.8815[/C][C]0.381555[/C][C]0.190777[/C][/ROW]
[/TABLE]
Source: https://freestatistics.org/blog/index.php?pk=267043&T=2

Globally Unique Identifier (entire table): ba.freestatistics.org/blog/index.php?pk=267043&T=2

As an alternative you can also use a QR Code:  

The GUIDs for individual cells are displayed in the table below:

Multiple Linear Regression - Ordinary Least Squares
VariableParameterS.D.T-STATH0: parameter = 02-tail p-value1-tail p-value
(Intercept)1.798030.17309610.394.96881e-152.48441e-15
LFM0.001060080.001202560.88150.3815550.190777


Multiple Linear Regression - Regression Statistics
Multiple R0.113074
R-squared0.0127857
Adjusted R-squared-0.00366791
F-TEST (value)0.777075
F-TEST (DF numerator)1
F-TEST (DF denominator)60
p-value0.381555
Multiple Linear Regression - Residual Statistics
Residual Standard Deviation0.361297
Sum Squared Residuals7.83211

\begin{tabular}{lllllllll}
\hline
Multiple Linear Regression - Regression Statistics \tabularnewline
Multiple R & 0.113074 \tabularnewline
R-squared & 0.0127857 \tabularnewline
Adjusted R-squared & -0.00366791 \tabularnewline
F-TEST (value) & 0.777075 \tabularnewline
F-TEST (DF numerator) & 1 \tabularnewline
F-TEST (DF denominator) & 60 \tabularnewline
p-value & 0.381555 \tabularnewline
Multiple Linear Regression - Residual Statistics \tabularnewline
Residual Standard Deviation & 0.361297 \tabularnewline
Sum Squared Residuals & 7.83211 \tabularnewline
\hline
\end{tabular}
%Source: https://freestatistics.org/blog/index.php?pk=267043&T=3

[TABLE]
[ROW][C]Multiple Linear Regression - Regression Statistics[/C][/ROW]
[ROW][C]Multiple R[/C][C]0.113074[/C][/ROW]
[ROW][C]R-squared[/C][C]0.0127857[/C][/ROW]
[ROW][C]Adjusted R-squared[/C][C]-0.00366791[/C][/ROW]
[ROW][C]F-TEST (value)[/C][C]0.777075[/C][/ROW]
[ROW][C]F-TEST (DF numerator)[/C][C]1[/C][/ROW]
[ROW][C]F-TEST (DF denominator)[/C][C]60[/C][/ROW]
[ROW][C]p-value[/C][C]0.381555[/C][/ROW]
[ROW][C]Multiple Linear Regression - Residual Statistics[/C][/ROW]
[ROW][C]Residual Standard Deviation[/C][C]0.361297[/C][/ROW]
[ROW][C]Sum Squared Residuals[/C][C]7.83211[/C][/ROW]
[/TABLE]
Source: https://freestatistics.org/blog/index.php?pk=267043&T=3

Globally Unique Identifier (entire table): ba.freestatistics.org/blog/index.php?pk=267043&T=3

As an alternative you can also use a QR Code:  

The GUIDs for individual cells are displayed in the table below:

Multiple Linear Regression - Regression Statistics
Multiple R0.113074
R-squared0.0127857
Adjusted R-squared-0.00366791
F-TEST (value)0.777075
F-TEST (DF numerator)1
F-TEST (DF denominator)60
p-value0.381555
Multiple Linear Regression - Residual Statistics
Residual Standard Deviation0.361297
Sum Squared Residuals7.83211


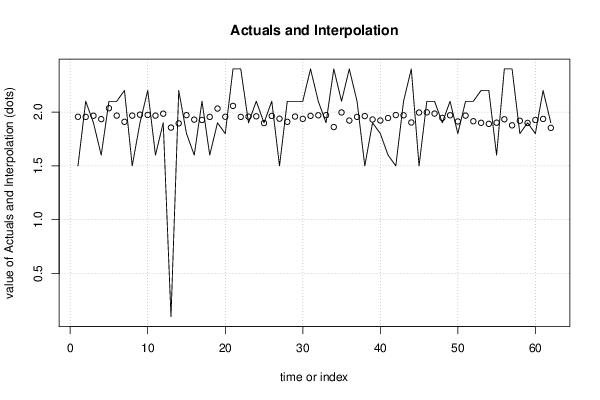
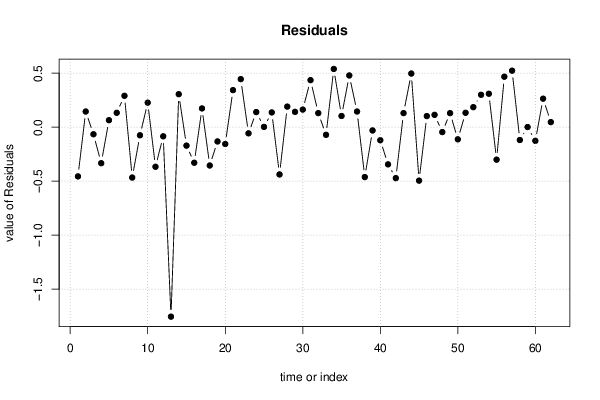
Multiple Linear Regression - Actuals, Interpolation, and Residuals
Time or IndexActualsInterpolationForecastResidualsPrediction Error
11.51.95598-0.455984
22.11.954920.145076
31.91.96553-0.065525
41.61.93372-0.333723
52.12.035490.0645099
62.11.966590.133415
72.21.909340.290659
81.51.96659-0.466585
91.91.97507-0.0750657
102.21.972950.227054
111.61.96659-0.366585
121.91.98461-0.0846064
130.11.85528-1.75528
142.21.89450.3055
151.81.97083-0.170825
161.61.92948-0.329482
172.11.92630.173698
181.61.95492-0.354924
191.92.03231-0.13231
201.81.95598-0.155984
212.42.056690.343308
222.41.954920.445076
231.91.95704-0.0570444
242.11.960220.139775
251.91.897680.00231991
262.11.96340.136595
271.51.93796-0.437963
282.11.909340.190659
292.11.95810.141896
302.11.93690.163097
312.41.964460.435535
322.11.969770.130235
331.91.97083-0.0708254
342.41.860580.539423
352.11.996270.103733
362.41.9210.478998
372.11.954920.145076
381.51.96234-0.462345
391.91.93054-0.0305425
401.81.921-0.121002
411.61.94432-0.344323
421.51.97189-0.471885
432.11.969770.130235
442.41.902980.49702
451.51.99521-0.495207
462.11.997330.102673
472.11.985670.114334
481.91.94538-0.0453836
492.11.969770.130235
501.81.91252-0.112521
512.11.966590.133415
522.11.914640.185359
532.21.89980.3002
542.21.890260.30974
551.61.90086-0.30086
562.41.932660.467337
572.41.876480.523521
581.81.91888-0.118882
591.91.898740.00125983
601.81.9263-0.126302
612.21.935840.264157
621.91.853160.0468431

\begin{tabular}{lllllllll}
\hline
Multiple Linear Regression - Actuals, Interpolation, and Residuals \tabularnewline
Time or Index & Actuals & InterpolationForecast & ResidualsPrediction Error \tabularnewline
1 & 1.5 & 1.95598 & -0.455984 \tabularnewline
2 & 2.1 & 1.95492 & 0.145076 \tabularnewline
3 & 1.9 & 1.96553 & -0.065525 \tabularnewline
4 & 1.6 & 1.93372 & -0.333723 \tabularnewline
5 & 2.1 & 2.03549 & 0.0645099 \tabularnewline
6 & 2.1 & 1.96659 & 0.133415 \tabularnewline
7 & 2.2 & 1.90934 & 0.290659 \tabularnewline
8 & 1.5 & 1.96659 & -0.466585 \tabularnewline
9 & 1.9 & 1.97507 & -0.0750657 \tabularnewline
10 & 2.2 & 1.97295 & 0.227054 \tabularnewline
11 & 1.6 & 1.96659 & -0.366585 \tabularnewline
12 & 1.9 & 1.98461 & -0.0846064 \tabularnewline
13 & 0.1 & 1.85528 & -1.75528 \tabularnewline
14 & 2.2 & 1.8945 & 0.3055 \tabularnewline
15 & 1.8 & 1.97083 & -0.170825 \tabularnewline
16 & 1.6 & 1.92948 & -0.329482 \tabularnewline
17 & 2.1 & 1.9263 & 0.173698 \tabularnewline
18 & 1.6 & 1.95492 & -0.354924 \tabularnewline
19 & 1.9 & 2.03231 & -0.13231 \tabularnewline
20 & 1.8 & 1.95598 & -0.155984 \tabularnewline
21 & 2.4 & 2.05669 & 0.343308 \tabularnewline
22 & 2.4 & 1.95492 & 0.445076 \tabularnewline
23 & 1.9 & 1.95704 & -0.0570444 \tabularnewline
24 & 2.1 & 1.96022 & 0.139775 \tabularnewline
25 & 1.9 & 1.89768 & 0.00231991 \tabularnewline
26 & 2.1 & 1.9634 & 0.136595 \tabularnewline
27 & 1.5 & 1.93796 & -0.437963 \tabularnewline
28 & 2.1 & 1.90934 & 0.190659 \tabularnewline
29 & 2.1 & 1.9581 & 0.141896 \tabularnewline
30 & 2.1 & 1.9369 & 0.163097 \tabularnewline
31 & 2.4 & 1.96446 & 0.435535 \tabularnewline
32 & 2.1 & 1.96977 & 0.130235 \tabularnewline
33 & 1.9 & 1.97083 & -0.0708254 \tabularnewline
34 & 2.4 & 1.86058 & 0.539423 \tabularnewline
35 & 2.1 & 1.99627 & 0.103733 \tabularnewline
36 & 2.4 & 1.921 & 0.478998 \tabularnewline
37 & 2.1 & 1.95492 & 0.145076 \tabularnewline
38 & 1.5 & 1.96234 & -0.462345 \tabularnewline
39 & 1.9 & 1.93054 & -0.0305425 \tabularnewline
40 & 1.8 & 1.921 & -0.121002 \tabularnewline
41 & 1.6 & 1.94432 & -0.344323 \tabularnewline
42 & 1.5 & 1.97189 & -0.471885 \tabularnewline
43 & 2.1 & 1.96977 & 0.130235 \tabularnewline
44 & 2.4 & 1.90298 & 0.49702 \tabularnewline
45 & 1.5 & 1.99521 & -0.495207 \tabularnewline
46 & 2.1 & 1.99733 & 0.102673 \tabularnewline
47 & 2.1 & 1.98567 & 0.114334 \tabularnewline
48 & 1.9 & 1.94538 & -0.0453836 \tabularnewline
49 & 2.1 & 1.96977 & 0.130235 \tabularnewline
50 & 1.8 & 1.91252 & -0.112521 \tabularnewline
51 & 2.1 & 1.96659 & 0.133415 \tabularnewline
52 & 2.1 & 1.91464 & 0.185359 \tabularnewline
53 & 2.2 & 1.8998 & 0.3002 \tabularnewline
54 & 2.2 & 1.89026 & 0.30974 \tabularnewline
55 & 1.6 & 1.90086 & -0.30086 \tabularnewline
56 & 2.4 & 1.93266 & 0.467337 \tabularnewline
57 & 2.4 & 1.87648 & 0.523521 \tabularnewline
58 & 1.8 & 1.91888 & -0.118882 \tabularnewline
59 & 1.9 & 1.89874 & 0.00125983 \tabularnewline
60 & 1.8 & 1.9263 & -0.126302 \tabularnewline
61 & 2.2 & 1.93584 & 0.264157 \tabularnewline
62 & 1.9 & 1.85316 & 0.0468431 \tabularnewline
\hline
\end{tabular}
%Source: https://freestatistics.org/blog/index.php?pk=267043&T=4

[TABLE]
[ROW][C]Multiple Linear Regression - Actuals, Interpolation, and Residuals[/C][/ROW]
[ROW][C]Time or Index[/C][C]Actuals[/C][C]InterpolationForecast[/C][C]ResidualsPrediction Error[/C][/ROW]
[ROW][C]1[/C][C]1.5[/C][C]1.95598[/C][C]-0.455984[/C][/ROW]
[ROW][C]2[/C][C]2.1[/C][C]1.95492[/C][C]0.145076[/C][/ROW]
[ROW][C]3[/C][C]1.9[/C][C]1.96553[/C][C]-0.065525[/C][/ROW]
[ROW][C]4[/C][C]1.6[/C][C]1.93372[/C][C]-0.333723[/C][/ROW]
[ROW][C]5[/C][C]2.1[/C][C]2.03549[/C][C]0.0645099[/C][/ROW]
[ROW][C]6[/C][C]2.1[/C][C]1.96659[/C][C]0.133415[/C][/ROW]
[ROW][C]7[/C][C]2.2[/C][C]1.90934[/C][C]0.290659[/C][/ROW]
[ROW][C]8[/C][C]1.5[/C][C]1.96659[/C][C]-0.466585[/C][/ROW]
[ROW][C]9[/C][C]1.9[/C][C]1.97507[/C][C]-0.0750657[/C][/ROW]
[ROW][C]10[/C][C]2.2[/C][C]1.97295[/C][C]0.227054[/C][/ROW]
[ROW][C]11[/C][C]1.6[/C][C]1.96659[/C][C]-0.366585[/C][/ROW]
[ROW][C]12[/C][C]1.9[/C][C]1.98461[/C][C]-0.0846064[/C][/ROW]
[ROW][C]13[/C][C]0.1[/C][C]1.85528[/C][C]-1.75528[/C][/ROW]
[ROW][C]14[/C][C]2.2[/C][C]1.8945[/C][C]0.3055[/C][/ROW]
[ROW][C]15[/C][C]1.8[/C][C]1.97083[/C][C]-0.170825[/C][/ROW]
[ROW][C]16[/C][C]1.6[/C][C]1.92948[/C][C]-0.329482[/C][/ROW]
[ROW][C]17[/C][C]2.1[/C][C]1.9263[/C][C]0.173698[/C][/ROW]
[ROW][C]18[/C][C]1.6[/C][C]1.95492[/C][C]-0.354924[/C][/ROW]
[ROW][C]19[/C][C]1.9[/C][C]2.03231[/C][C]-0.13231[/C][/ROW]
[ROW][C]20[/C][C]1.8[/C][C]1.95598[/C][C]-0.155984[/C][/ROW]
[ROW][C]21[/C][C]2.4[/C][C]2.05669[/C][C]0.343308[/C][/ROW]
[ROW][C]22[/C][C]2.4[/C][C]1.95492[/C][C]0.445076[/C][/ROW]
[ROW][C]23[/C][C]1.9[/C][C]1.95704[/C][C]-0.0570444[/C][/ROW]
[ROW][C]24[/C][C]2.1[/C][C]1.96022[/C][C]0.139775[/C][/ROW]
[ROW][C]25[/C][C]1.9[/C][C]1.89768[/C][C]0.00231991[/C][/ROW]
[ROW][C]26[/C][C]2.1[/C][C]1.9634[/C][C]0.136595[/C][/ROW]
[ROW][C]27[/C][C]1.5[/C][C]1.93796[/C][C]-0.437963[/C][/ROW]
[ROW][C]28[/C][C]2.1[/C][C]1.90934[/C][C]0.190659[/C][/ROW]
[ROW][C]29[/C][C]2.1[/C][C]1.9581[/C][C]0.141896[/C][/ROW]
[ROW][C]30[/C][C]2.1[/C][C]1.9369[/C][C]0.163097[/C][/ROW]
[ROW][C]31[/C][C]2.4[/C][C]1.96446[/C][C]0.435535[/C][/ROW]
[ROW][C]32[/C][C]2.1[/C][C]1.96977[/C][C]0.130235[/C][/ROW]
[ROW][C]33[/C][C]1.9[/C][C]1.97083[/C][C]-0.0708254[/C][/ROW]
[ROW][C]34[/C][C]2.4[/C][C]1.86058[/C][C]0.539423[/C][/ROW]
[ROW][C]35[/C][C]2.1[/C][C]1.99627[/C][C]0.103733[/C][/ROW]
[ROW][C]36[/C][C]2.4[/C][C]1.921[/C][C]0.478998[/C][/ROW]
[ROW][C]37[/C][C]2.1[/C][C]1.95492[/C][C]0.145076[/C][/ROW]
[ROW][C]38[/C][C]1.5[/C][C]1.96234[/C][C]-0.462345[/C][/ROW]
[ROW][C]39[/C][C]1.9[/C][C]1.93054[/C][C]-0.0305425[/C][/ROW]
[ROW][C]40[/C][C]1.8[/C][C]1.921[/C][C]-0.121002[/C][/ROW]
[ROW][C]41[/C][C]1.6[/C][C]1.94432[/C][C]-0.344323[/C][/ROW]
[ROW][C]42[/C][C]1.5[/C][C]1.97189[/C][C]-0.471885[/C][/ROW]
[ROW][C]43[/C][C]2.1[/C][C]1.96977[/C][C]0.130235[/C][/ROW]
[ROW][C]44[/C][C]2.4[/C][C]1.90298[/C][C]0.49702[/C][/ROW]
[ROW][C]45[/C][C]1.5[/C][C]1.99521[/C][C]-0.495207[/C][/ROW]
[ROW][C]46[/C][C]2.1[/C][C]1.99733[/C][C]0.102673[/C][/ROW]
[ROW][C]47[/C][C]2.1[/C][C]1.98567[/C][C]0.114334[/C][/ROW]
[ROW][C]48[/C][C]1.9[/C][C]1.94538[/C][C]-0.0453836[/C][/ROW]
[ROW][C]49[/C][C]2.1[/C][C]1.96977[/C][C]0.130235[/C][/ROW]
[ROW][C]50[/C][C]1.8[/C][C]1.91252[/C][C]-0.112521[/C][/ROW]
[ROW][C]51[/C][C]2.1[/C][C]1.96659[/C][C]0.133415[/C][/ROW]
[ROW][C]52[/C][C]2.1[/C][C]1.91464[/C][C]0.185359[/C][/ROW]
[ROW][C]53[/C][C]2.2[/C][C]1.8998[/C][C]0.3002[/C][/ROW]
[ROW][C]54[/C][C]2.2[/C][C]1.89026[/C][C]0.30974[/C][/ROW]
[ROW][C]55[/C][C]1.6[/C][C]1.90086[/C][C]-0.30086[/C][/ROW]
[ROW][C]56[/C][C]2.4[/C][C]1.93266[/C][C]0.467337[/C][/ROW]
[ROW][C]57[/C][C]2.4[/C][C]1.87648[/C][C]0.523521[/C][/ROW]
[ROW][C]58[/C][C]1.8[/C][C]1.91888[/C][C]-0.118882[/C][/ROW]
[ROW][C]59[/C][C]1.9[/C][C]1.89874[/C][C]0.00125983[/C][/ROW]
[ROW][C]60[/C][C]1.8[/C][C]1.9263[/C][C]-0.126302[/C][/ROW]
[ROW][C]61[/C][C]2.2[/C][C]1.93584[/C][C]0.264157[/C][/ROW]
[ROW][C]62[/C][C]1.9[/C][C]1.85316[/C][C]0.0468431[/C][/ROW]
[/TABLE]
Source: https://freestatistics.org/blog/index.php?pk=267043&T=4

Globally Unique Identifier (entire table): ba.freestatistics.org/blog/index.php?pk=267043&T=4

As an alternative you can also use a QR Code:  

The GUIDs for individual cells are displayed in the table below:

Multiple Linear Regression - Actuals, Interpolation, and Residuals
Time or IndexActualsInterpolationForecastResidualsPrediction Error
11.51.95598-0.455984
22.11.954920.145076
31.91.96553-0.065525
41.61.93372-0.333723
52.12.035490.0645099
62.11.966590.133415
72.21.909340.290659
81.51.96659-0.466585
91.91.97507-0.0750657
102.21.972950.227054
111.61.96659-0.366585
121.91.98461-0.0846064
130.11.85528-1.75528
142.21.89450.3055
151.81.97083-0.170825
161.61.92948-0.329482
172.11.92630.173698
181.61.95492-0.354924
191.92.03231-0.13231
201.81.95598-0.155984
212.42.056690.343308
222.41.954920.445076
231.91.95704-0.0570444
242.11.960220.139775
251.91.897680.00231991
262.11.96340.136595
271.51.93796-0.437963
282.11.909340.190659
292.11.95810.141896
302.11.93690.163097
312.41.964460.435535
322.11.969770.130235
331.91.97083-0.0708254
342.41.860580.539423
352.11.996270.103733
362.41.9210.478998
372.11.954920.145076
381.51.96234-0.462345
391.91.93054-0.0305425
401.81.921-0.121002
411.61.94432-0.344323
421.51.97189-0.471885
432.11.969770.130235
442.41.902980.49702
451.51.99521-0.495207
462.11.997330.102673
472.11.985670.114334
481.91.94538-0.0453836
492.11.969770.130235
501.81.91252-0.112521
512.11.966590.133415
522.11.914640.185359
532.21.89980.3002
542.21.890260.30974
551.61.90086-0.30086
562.41.932660.467337
572.41.876480.523521
581.81.91888-0.118882
591.91.898740.00125983
601.81.9263-0.126302
612.21.935840.264157
621.91.853160.0468431


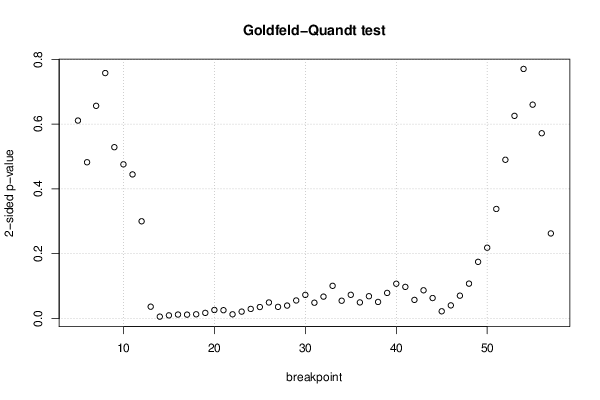
Goldfeld-Quandt test for Heteroskedasticity
p-valuesAlternative Hypothesis
breakpoint indexgreater2-sidedless
50.3054220.6108440.694578
60.2411130.4822270.758887
70.3281770.6563530.671823
80.3787610.7575210.621239
90.2643330.5286660.735667
100.2378820.4757640.762118
110.2223450.4446910.777655
120.1500150.3000310.849985
130.9818510.03629720.0181486
140.9971880.005623130.00281157
150.9951990.009601420.00480071
160.9939560.01208830.00604414
170.9940780.01184420.00592211
180.9935140.01297110.00648554
190.9913740.01725180.0086259
200.9869060.02618750.0130937
210.987220.02555960.0127798
220.9935740.01285140.00642569
230.9894350.02112990.010565
240.9852660.02946740.0147337
250.9823330.03533370.0176669
260.9753180.04936330.0246816
270.982110.03577970.0178899
280.9800970.0398060.019903
290.9722220.05555640.0277782
300.9635680.07286310.0364315
310.9756920.04861570.0243078
320.9663250.06735040.0336752
330.9496110.1007770.0503885
340.9726320.05473580.0273679
350.9635020.07299560.0364978
360.9751930.04961320.0248066
370.9656620.06867570.0343378
380.9744940.05101210.025506
390.9605610.07887840.0394392
400.9464270.1071450.0535725
410.9512640.09747220.0487361
420.9713180.05736380.0286819
430.9564850.08703080.0435154
440.9684770.06304620.0315231
450.9889020.0221960.011098
460.979780.04044010.0202201
470.964820.07035920.0351796
480.9462580.1074840.0537418
490.9126160.1747680.0873842
500.8908310.2183380.109169
510.8310250.3379510.168975
520.7550980.4898040.244902
530.6873190.6253620.312681
540.6149220.7701560.385078
550.6700480.6599030.329952
560.7141250.5717490.285875
570.8687440.2625120.131256

\begin{tabular}{lllllllll}
\hline
Goldfeld-Quandt test for Heteroskedasticity \tabularnewline
p-values & Alternative Hypothesis \tabularnewline
breakpoint index & greater & 2-sided & less \tabularnewline
5 & 0.305422 & 0.610844 & 0.694578 \tabularnewline
6 & 0.241113 & 0.482227 & 0.758887 \tabularnewline
7 & 0.328177 & 0.656353 & 0.671823 \tabularnewline
8 & 0.378761 & 0.757521 & 0.621239 \tabularnewline
9 & 0.264333 & 0.528666 & 0.735667 \tabularnewline
10 & 0.237882 & 0.475764 & 0.762118 \tabularnewline
11 & 0.222345 & 0.444691 & 0.777655 \tabularnewline
12 & 0.150015 & 0.300031 & 0.849985 \tabularnewline
13 & 0.981851 & 0.0362972 & 0.0181486 \tabularnewline
14 & 0.997188 & 0.00562313 & 0.00281157 \tabularnewline
15 & 0.995199 & 0.00960142 & 0.00480071 \tabularnewline
16 & 0.993956 & 0.0120883 & 0.00604414 \tabularnewline
17 & 0.994078 & 0.0118442 & 0.00592211 \tabularnewline
18 & 0.993514 & 0.0129711 & 0.00648554 \tabularnewline
19 & 0.991374 & 0.0172518 & 0.0086259 \tabularnewline
20 & 0.986906 & 0.0261875 & 0.0130937 \tabularnewline
21 & 0.98722 & 0.0255596 & 0.0127798 \tabularnewline
22 & 0.993574 & 0.0128514 & 0.00642569 \tabularnewline
23 & 0.989435 & 0.0211299 & 0.010565 \tabularnewline
24 & 0.985266 & 0.0294674 & 0.0147337 \tabularnewline
25 & 0.982333 & 0.0353337 & 0.0176669 \tabularnewline
26 & 0.975318 & 0.0493633 & 0.0246816 \tabularnewline
27 & 0.98211 & 0.0357797 & 0.0178899 \tabularnewline
28 & 0.980097 & 0.039806 & 0.019903 \tabularnewline
29 & 0.972222 & 0.0555564 & 0.0277782 \tabularnewline
30 & 0.963568 & 0.0728631 & 0.0364315 \tabularnewline
31 & 0.975692 & 0.0486157 & 0.0243078 \tabularnewline
32 & 0.966325 & 0.0673504 & 0.0336752 \tabularnewline
33 & 0.949611 & 0.100777 & 0.0503885 \tabularnewline
34 & 0.972632 & 0.0547358 & 0.0273679 \tabularnewline
35 & 0.963502 & 0.0729956 & 0.0364978 \tabularnewline
36 & 0.975193 & 0.0496132 & 0.0248066 \tabularnewline
37 & 0.965662 & 0.0686757 & 0.0343378 \tabularnewline
38 & 0.974494 & 0.0510121 & 0.025506 \tabularnewline
39 & 0.960561 & 0.0788784 & 0.0394392 \tabularnewline
40 & 0.946427 & 0.107145 & 0.0535725 \tabularnewline
41 & 0.951264 & 0.0974722 & 0.0487361 \tabularnewline
42 & 0.971318 & 0.0573638 & 0.0286819 \tabularnewline
43 & 0.956485 & 0.0870308 & 0.0435154 \tabularnewline
44 & 0.968477 & 0.0630462 & 0.0315231 \tabularnewline
45 & 0.988902 & 0.022196 & 0.011098 \tabularnewline
46 & 0.97978 & 0.0404401 & 0.0202201 \tabularnewline
47 & 0.96482 & 0.0703592 & 0.0351796 \tabularnewline
48 & 0.946258 & 0.107484 & 0.0537418 \tabularnewline
49 & 0.912616 & 0.174768 & 0.0873842 \tabularnewline
50 & 0.890831 & 0.218338 & 0.109169 \tabularnewline
51 & 0.831025 & 0.337951 & 0.168975 \tabularnewline
52 & 0.755098 & 0.489804 & 0.244902 \tabularnewline
53 & 0.687319 & 0.625362 & 0.312681 \tabularnewline
54 & 0.614922 & 0.770156 & 0.385078 \tabularnewline
55 & 0.670048 & 0.659903 & 0.329952 \tabularnewline
56 & 0.714125 & 0.571749 & 0.285875 \tabularnewline
57 & 0.868744 & 0.262512 & 0.131256 \tabularnewline
\hline
\end{tabular}
%Source: https://freestatistics.org/blog/index.php?pk=267043&T=5

[TABLE]
[ROW][C]Goldfeld-Quandt test for Heteroskedasticity[/C][/ROW]
[ROW][C]p-values[/C][C]Alternative Hypothesis[/C][/ROW]
[ROW][C]breakpoint index[/C][C]greater[/C][C]2-sided[/C][C]less[/C][/ROW]
[ROW][C]5[/C][C]0.305422[/C][C]0.610844[/C][C]0.694578[/C][/ROW]
[ROW][C]6[/C][C]0.241113[/C][C]0.482227[/C][C]0.758887[/C][/ROW]
[ROW][C]7[/C][C]0.328177[/C][C]0.656353[/C][C]0.671823[/C][/ROW]
[ROW][C]8[/C][C]0.378761[/C][C]0.757521[/C][C]0.621239[/C][/ROW]
[ROW][C]9[/C][C]0.264333[/C][C]0.528666[/C][C]0.735667[/C][/ROW]
[ROW][C]10[/C][C]0.237882[/C][C]0.475764[/C][C]0.762118[/C][/ROW]
[ROW][C]11[/C][C]0.222345[/C][C]0.444691[/C][C]0.777655[/C][/ROW]
[ROW][C]12[/C][C]0.150015[/C][C]0.300031[/C][C]0.849985[/C][/ROW]
[ROW][C]13[/C][C]0.981851[/C][C]0.0362972[/C][C]0.0181486[/C][/ROW]
[ROW][C]14[/C][C]0.997188[/C][C]0.00562313[/C][C]0.00281157[/C][/ROW]
[ROW][C]15[/C][C]0.995199[/C][C]0.00960142[/C][C]0.00480071[/C][/ROW]
[ROW][C]16[/C][C]0.993956[/C][C]0.0120883[/C][C]0.00604414[/C][/ROW]
[ROW][C]17[/C][C]0.994078[/C][C]0.0118442[/C][C]0.00592211[/C][/ROW]
[ROW][C]18[/C][C]0.993514[/C][C]0.0129711[/C][C]0.00648554[/C][/ROW]
[ROW][C]19[/C][C]0.991374[/C][C]0.0172518[/C][C]0.0086259[/C][/ROW]
[ROW][C]20[/C][C]0.986906[/C][C]0.0261875[/C][C]0.0130937[/C][/ROW]
[ROW][C]21[/C][C]0.98722[/C][C]0.0255596[/C][C]0.0127798[/C][/ROW]
[ROW][C]22[/C][C]0.993574[/C][C]0.0128514[/C][C]0.00642569[/C][/ROW]
[ROW][C]23[/C][C]0.989435[/C][C]0.0211299[/C][C]0.010565[/C][/ROW]
[ROW][C]24[/C][C]0.985266[/C][C]0.0294674[/C][C]0.0147337[/C][/ROW]
[ROW][C]25[/C][C]0.982333[/C][C]0.0353337[/C][C]0.0176669[/C][/ROW]
[ROW][C]26[/C][C]0.975318[/C][C]0.0493633[/C][C]0.0246816[/C][/ROW]
[ROW][C]27[/C][C]0.98211[/C][C]0.0357797[/C][C]0.0178899[/C][/ROW]
[ROW][C]28[/C][C]0.980097[/C][C]0.039806[/C][C]0.019903[/C][/ROW]
[ROW][C]29[/C][C]0.972222[/C][C]0.0555564[/C][C]0.0277782[/C][/ROW]
[ROW][C]30[/C][C]0.963568[/C][C]0.0728631[/C][C]0.0364315[/C][/ROW]
[ROW][C]31[/C][C]0.975692[/C][C]0.0486157[/C][C]0.0243078[/C][/ROW]
[ROW][C]32[/C][C]0.966325[/C][C]0.0673504[/C][C]0.0336752[/C][/ROW]
[ROW][C]33[/C][C]0.949611[/C][C]0.100777[/C][C]0.0503885[/C][/ROW]
[ROW][C]34[/C][C]0.972632[/C][C]0.0547358[/C][C]0.0273679[/C][/ROW]
[ROW][C]35[/C][C]0.963502[/C][C]0.0729956[/C][C]0.0364978[/C][/ROW]
[ROW][C]36[/C][C]0.975193[/C][C]0.0496132[/C][C]0.0248066[/C][/ROW]
[ROW][C]37[/C][C]0.965662[/C][C]0.0686757[/C][C]0.0343378[/C][/ROW]
[ROW][C]38[/C][C]0.974494[/C][C]0.0510121[/C][C]0.025506[/C][/ROW]
[ROW][C]39[/C][C]0.960561[/C][C]0.0788784[/C][C]0.0394392[/C][/ROW]
[ROW][C]40[/C][C]0.946427[/C][C]0.107145[/C][C]0.0535725[/C][/ROW]
[ROW][C]41[/C][C]0.951264[/C][C]0.0974722[/C][C]0.0487361[/C][/ROW]
[ROW][C]42[/C][C]0.971318[/C][C]0.0573638[/C][C]0.0286819[/C][/ROW]
[ROW][C]43[/C][C]0.956485[/C][C]0.0870308[/C][C]0.0435154[/C][/ROW]
[ROW][C]44[/C][C]0.968477[/C][C]0.0630462[/C][C]0.0315231[/C][/ROW]
[ROW][C]45[/C][C]0.988902[/C][C]0.022196[/C][C]0.011098[/C][/ROW]
[ROW][C]46[/C][C]0.97978[/C][C]0.0404401[/C][C]0.0202201[/C][/ROW]
[ROW][C]47[/C][C]0.96482[/C][C]0.0703592[/C][C]0.0351796[/C][/ROW]
[ROW][C]48[/C][C]0.946258[/C][C]0.107484[/C][C]0.0537418[/C][/ROW]
[ROW][C]49[/C][C]0.912616[/C][C]0.174768[/C][C]0.0873842[/C][/ROW]
[ROW][C]50[/C][C]0.890831[/C][C]0.218338[/C][C]0.109169[/C][/ROW]
[ROW][C]51[/C][C]0.831025[/C][C]0.337951[/C][C]0.168975[/C][/ROW]
[ROW][C]52[/C][C]0.755098[/C][C]0.489804[/C][C]0.244902[/C][/ROW]
[ROW][C]53[/C][C]0.687319[/C][C]0.625362[/C][C]0.312681[/C][/ROW]
[ROW][C]54[/C][C]0.614922[/C][C]0.770156[/C][C]0.385078[/C][/ROW]
[ROW][C]55[/C][C]0.670048[/C][C]0.659903[/C][C]0.329952[/C][/ROW]
[ROW][C]56[/C][C]0.714125[/C][C]0.571749[/C][C]0.285875[/C][/ROW]
[ROW][C]57[/C][C]0.868744[/C][C]0.262512[/C][C]0.131256[/C][/ROW]
[/TABLE]
Source: https://freestatistics.org/blog/index.php?pk=267043&T=5

Globally Unique Identifier (entire table): ba.freestatistics.org/blog/index.php?pk=267043&T=5

As an alternative you can also use a QR Code:  

The GUIDs for individual cells are displayed in the table below:

Goldfeld-Quandt test for Heteroskedasticity
p-valuesAlternative Hypothesis
breakpoint indexgreater2-sidedless
50.3054220.6108440.694578
60.2411130.4822270.758887
70.3281770.6563530.671823
80.3787610.7575210.621239
90.2643330.5286660.735667
100.2378820.4757640.762118
110.2223450.4446910.777655
120.1500150.3000310.849985
130.9818510.03629720.0181486
140.9971880.005623130.00281157
150.9951990.009601420.00480071
160.9939560.01208830.00604414
170.9940780.01184420.00592211
180.9935140.01297110.00648554
190.9913740.01725180.0086259
200.9869060.02618750.0130937
210.987220.02555960.0127798
220.9935740.01285140.00642569
230.9894350.02112990.010565
240.9852660.02946740.0147337
250.9823330.03533370.0176669
260.9753180.04936330.0246816
270.982110.03577970.0178899
280.9800970.0398060.019903
290.9722220.05555640.0277782
300.9635680.07286310.0364315
310.9756920.04861570.0243078
320.9663250.06735040.0336752
330.9496110.1007770.0503885
340.9726320.05473580.0273679
350.9635020.07299560.0364978
360.9751930.04961320.0248066
370.9656620.06867570.0343378
380.9744940.05101210.025506
390.9605610.07887840.0394392
400.9464270.1071450.0535725
410.9512640.09747220.0487361
420.9713180.05736380.0286819
430.9564850.08703080.0435154
440.9684770.06304620.0315231
450.9889020.0221960.011098
460.979780.04044010.0202201
470.964820.07035920.0351796
480.9462580.1074840.0537418
490.9126160.1747680.0873842
500.8908310.2183380.109169
510.8310250.3379510.168975
520.7550980.4898040.244902
530.6873190.6253620.312681
540.6149220.7701560.385078
550.6700480.6599030.329952
560.7141250.5717490.285875
570.8687440.2625120.131256


Meta Analysis of Goldfeld-Quandt test for Heteroskedasticity
Description# significant tests% significant testsOK/NOK
1% type I error level20.0377358NOK
5% type I error level200.377358NOK
10% type I error level330.622642NOK

\begin{tabular}{lllllllll}
\hline
Meta Analysis of Goldfeld-Quandt test for Heteroskedasticity \tabularnewline
Description & # significant tests & % significant tests & OK/NOK \tabularnewline
1% type I error level & 2 & 0.0377358 & NOK \tabularnewline
5% type I error level & 20 & 0.377358 & NOK \tabularnewline
10% type I error level & 33 & 0.622642 & NOK \tabularnewline
\hline
\end{tabular}
%Source: https://freestatistics.org/blog/index.php?pk=267043&T=6

[TABLE]
[ROW][C]Meta Analysis of Goldfeld-Quandt test for Heteroskedasticity[/C][/ROW]
[ROW][C]Description[/C][C]# significant tests[/C][C]% significant tests[/C][C]OK/NOK[/C][/ROW]
[ROW][C]1% type I error level[/C][C]2[/C][C]0.0377358[/C][C]NOK[/C][/ROW]
[ROW][C]5% type I error level[/C][C]20[/C][C]0.377358[/C][C]NOK[/C][/ROW]
[ROW][C]10% type I error level[/C][C]33[/C][C]0.622642[/C][C]NOK[/C][/ROW]
[/TABLE]
Source: https://freestatistics.org/blog/index.php?pk=267043&T=6

Globally Unique Identifier (entire table): ba.freestatistics.org/blog/index.php?pk=267043&T=6

As an alternative you can also use a QR Code:  

The GUIDs for individual cells are displayed in the table below:

Meta Analysis of Goldfeld-Quandt test for Heteroskedasticity
Description# significant tests% significant testsOK/NOK
1% type I error level20.0377358NOK
5% type I error level200.377358NOK
10% type I error level330.622642NOK


Parameters (Session):
Parameters (R input):
par1 = 2 ; par2 = Do not include Seasonal Dummies ; par3 = No Linear Trend ;
R code (references can be found in the software module):
library(lattice)
library(lmtest)
n25 <- 25 #minimum number of obs. for Goldfeld-Quandt test
par1 <- as.numeric(par1)
x <- t(y)
k <- length(x[1,])
n <- length(x[,1])
x1 <- cbind(x[,par1], x[,1:k!=par1])
mycolnames <- c(colnames(x)[par1], colnames(x)[1:k!=par1])
colnames(x1) <- mycolnames #colnames(x)[par1]
x <- x1
if (par3 == 'First Differences'){
x2 <- array(0, dim=c(n-1,k), dimnames=list(1:(n-1), paste('(1-B)',colnames(x),sep='')))
for (i in 1:n-1) {
for (j in 1:k) {
x2[i,j] <- x[i+1,j] - x[i,j]
}
}
x <- x2
}
if (par2 == 'Include Monthly Dummies'){
x2 <- array(0, dim=c(n,11), dimnames=list(1:n, paste('M', seq(1:11), sep ='')))
for (i in 1:11){
x2[seq(i,n,12),i] <- 1
}
x <- cbind(x, x2)
}
if (par2 == 'Include Quarterly Dummies'){
x2 <- array(0, dim=c(n,3), dimnames=list(1:n, paste('Q', seq(1:3), sep ='')))
for (i in 1:3){
x2[seq(i,n,4),i] <- 1
}
x <- cbind(x, x2)
}
k <- length(x[1,])
if (par3 == 'Linear Trend'){
x <- cbind(x, c(1:n))
colnames(x)[k+1] <- 't'
}
x
k <- length(x[1,])
df <- as.data.frame(x)
(mylm <- lm(df))
(mysum <- summary(mylm))
if (n > n25) {
kp3 <- k + 3
nmkm3 <- n - k - 3
gqarr <- array(NA, dim=c(nmkm3-kp3+1,3))
numgqtests <- 0
numsignificant1 <- 0
numsignificant5 <- 0
numsignificant10 <- 0
for (mypoint in kp3:nmkm3) {
j <- 0
numgqtests <- numgqtests + 1
for (myalt in c('greater', 'two.sided', 'less')) {
j <- j + 1
gqarr[mypoint-kp3+1,j] <- gqtest(mylm, point=mypoint, alternative=myalt)$p.value
}
if (gqarr[mypoint-kp3+1,2] < 0.01) numsignificant1 <- numsignificant1 + 1
if (gqarr[mypoint-kp3+1,2] < 0.05) numsignificant5 <- numsignificant5 + 1
if (gqarr[mypoint-kp3+1,2] < 0.10) numsignificant10 <- numsignificant10 + 1
}
gqarr
}
bitmap(file='test0.png')
plot(x[,1], type='l', main='Actuals and Interpolation', ylab='value of Actuals and Interpolation (dots)', xlab='time or index')
points(x[,1]-mysum$resid)
grid()
dev.off()
bitmap(file='test1.png')
plot(mysum$resid, type='b', pch=19, main='Residuals', ylab='value of Residuals', xlab='time or index')
grid()
dev.off()
bitmap(file='test2.png')
hist(mysum$resid, main='Residual Histogram', xlab='values of Residuals')
grid()
dev.off()
bitmap(file='test3.png')
densityplot(~mysum$resid,col='black',main='Residual Density Plot', xlab='values of Residuals')
dev.off()
bitmap(file='test4.png')
qqnorm(mysum$resid, main='Residual Normal Q-Q Plot')
qqline(mysum$resid)
grid()
dev.off()
(myerror <- as.ts(mysum$resid))
bitmap(file='test5.png')
dum <- cbind(lag(myerror,k=1),myerror)
dum
dum1 <- dum[2:length(myerror),]
dum1
z <- as.data.frame(dum1)
z
plot(z,main=paste('Residual Lag plot, lowess, and regression line'), ylab='values of Residuals', xlab='lagged values of Residuals')
lines(lowess(z))
abline(lm(z))
grid()
dev.off()
bitmap(file='test6.png')
acf(mysum$resid, lag.max=length(mysum$resid)/2, main='Residual Autocorrelation Function')
grid()
dev.off()
bitmap(file='test7.png')
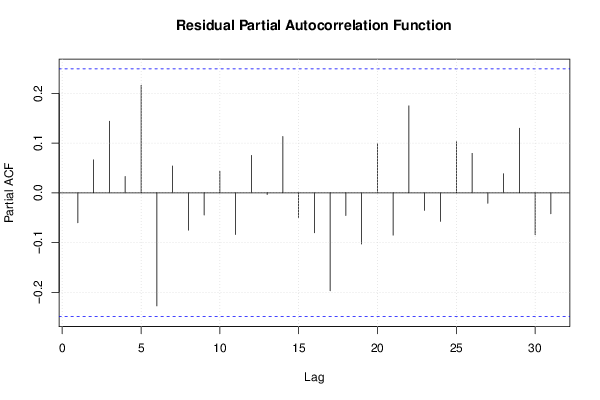
pacf(mysum$resid, lag.max=length(mysum$resid)/2, main='Residual Partial Autocorrelation Function')
grid()
dev.off()
bitmap(file='test8.png')
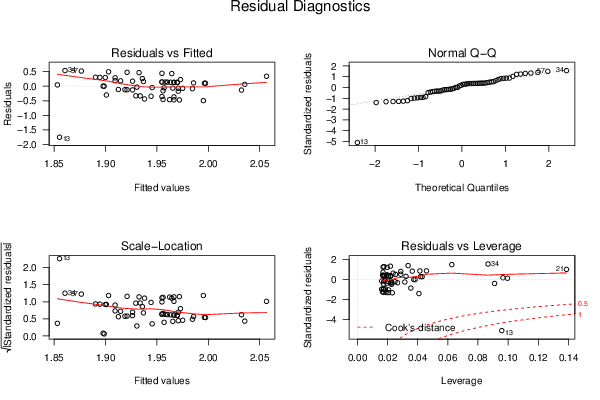
opar <- par(mfrow = c(2,2), oma = c(0, 0, 1.1, 0))
plot(mylm, las = 1, sub='Residual Diagnostics')
par(opar)
dev.off()
if (n > n25) {
bitmap(file='test9.png')
plot(kp3:nmkm3,gqarr[,2], main='Goldfeld-Quandt test',ylab='2-sided p-value',xlab='breakpoint')
grid()
dev.off()
}
load(file='createtable')
a<-table.start()
a<-table.row.start(a)
a<-table.element(a, 'Multiple Linear Regression - Estimated Regression Equation', 1, TRUE)
a<-table.row.end(a)
myeq <- colnames(x)[1]
myeq <- paste(myeq, '[t] = ', sep='')
for (i in 1:k){
if (mysum$coefficients[i,1] > 0) myeq <- paste(myeq, '+', '')
myeq <- paste(myeq, signif(mysum$coefficients[i,1],6), sep=' ')
if (rownames(mysum$coefficients)[i] != '(Intercept)') {
myeq <- paste(myeq, rownames(mysum$coefficients)[i], sep='')
if (rownames(mysum$coefficients)[i] != 't') myeq <- paste(myeq, '[t]', sep='')
}
}
myeq <- paste(myeq, ' + e[t]')
a<-table.row.start(a)
a<-table.element(a, myeq)
a<-table.row.end(a)
a<-table.end(a)
table.save(a,file='mytable1.tab')
a<-table.start()
a<-table.row.start(a)
a<-table.element(a,hyperlink('ols1.htm','Multiple Linear Regression - Ordinary Least Squares',''), 6, TRUE)
a<-table.row.end(a)
a<-table.row.start(a)
a<-table.element(a,'Variable',header=TRUE)
a<-table.element(a,'Parameter',header=TRUE)
a<-table.element(a,'S.D.',header=TRUE)
a<-table.element(a,'T-STAT
H0: parameter = 0',header=TRUE)
a<-table.element(a,'2-tail p-value',header=TRUE)
a<-table.element(a,'1-tail p-value',header=TRUE)
a<-table.row.end(a)
for (i in 1:k){
a<-table.row.start(a)
a<-table.element(a,rownames(mysum$coefficients)[i],header=TRUE)
a<-table.element(a,signif(mysum$coefficients[i,1],6))
a<-table.element(a, signif(mysum$coefficients[i,2],6))
a<-table.element(a, signif(mysum$coefficients[i,3],4))
a<-table.element(a, signif(mysum$coefficients[i,4],6))
a<-table.element(a, signif(mysum$coefficients[i,4]/2,6))
a<-table.row.end(a)
}
a<-table.end(a)
table.save(a,file='mytable2.tab')
a<-table.start()
a<-table.row.start(a)
a<-table.element(a, 'Multiple Linear Regression - Regression Statistics', 2, TRUE)
a<-table.row.end(a)
a<-table.row.start(a)
a<-table.element(a, 'Multiple R',1,TRUE)
a<-table.element(a, signif(sqrt(mysum$r.squared),6))
a<-table.row.end(a)
a<-table.row.start(a)
a<-table.element(a, 'R-squared',1,TRUE)
a<-table.element(a, signif(mysum$r.squared,6))
a<-table.row.end(a)
a<-table.row.start(a)
a<-table.element(a, 'Adjusted R-squared',1,TRUE)
a<-table.element(a, signif(mysum$adj.r.squared,6))
a<-table.row.end(a)
a<-table.row.start(a)
a<-table.element(a, 'F-TEST (value)',1,TRUE)
a<-table.element(a, signif(mysum$fstatistic[1],6))
a<-table.row.end(a)
a<-table.row.start(a)
a<-table.element(a, 'F-TEST (DF numerator)',1,TRUE)
a<-table.element(a, signif(mysum$fstatistic[2],6))
a<-table.row.end(a)
a<-table.row.start(a)
a<-table.element(a, 'F-TEST (DF denominator)',1,TRUE)
a<-table.element(a, signif(mysum$fstatistic[3],6))
a<-table.row.end(a)
a<-table.row.start(a)
a<-table.element(a, 'p-value',1,TRUE)
a<-table.element(a, signif(1-pf(mysum$fstatistic[1],mysum$fstatistic[2],mysum$fstatistic[3]),6))
a<-table.row.end(a)
a<-table.row.start(a)
a<-table.element(a, 'Multiple Linear Regression - Residual Statistics', 2, TRUE)
a<-table.row.end(a)
a<-table.row.start(a)
a<-table.element(a, 'Residual Standard Deviation',1,TRUE)
a<-table.element(a, signif(mysum$sigma,6))
a<-table.row.end(a)
a<-table.row.start(a)
a<-table.element(a, 'Sum Squared Residuals',1,TRUE)
a<-table.element(a, signif(sum(myerror*myerror),6))
a<-table.row.end(a)
a<-table.end(a)
table.save(a,file='mytable3.tab')
a<-table.start()
a<-table.row.start(a)
a<-table.element(a, 'Multiple Linear Regression - Actuals, Interpolation, and Residuals', 4, TRUE)
a<-table.row.end(a)
a<-table.row.start(a)
a<-table.element(a, 'Time or Index', 1, TRUE)
a<-table.element(a, 'Actuals', 1, TRUE)
a<-table.element(a, 'Interpolation
Forecast', 1, TRUE)
a<-table.element(a, 'Residuals
Prediction Error', 1, TRUE)
a<-table.row.end(a)
for (i in 1:n) {
a<-table.row.start(a)
a<-table.element(a,i, 1, TRUE)
a<-table.element(a,signif(x[i],6))
a<-table.element(a,signif(x[i]-mysum$resid[i],6))
a<-table.element(a,signif(mysum$resid[i],6))
a<-table.row.end(a)
}
a<-table.end(a)
table.save(a,file='mytable4.tab')
if (n > n25) {
a<-table.start()
a<-table.row.start(a)
a<-table.element(a,'Goldfeld-Quandt test for Heteroskedasticity',4,TRUE)
a<-table.row.end(a)
a<-table.row.start(a)
a<-table.element(a,'p-values',header=TRUE)
a<-table.element(a,'Alternative Hypothesis',3,header=TRUE)
a<-table.row.end(a)
a<-table.row.start(a)
a<-table.element(a,'breakpoint index',header=TRUE)
a<-table.element(a,'greater',header=TRUE)
a<-table.element(a,'2-sided',header=TRUE)
a<-table.element(a,'less',header=TRUE)
a<-table.row.end(a)
for (mypoint in kp3:nmkm3) {
a<-table.row.start(a)
a<-table.element(a,mypoint,header=TRUE)
a<-table.element(a,signif(gqarr[mypoint-kp3+1,1],6))
a<-table.element(a,signif(gqarr[mypoint-kp3+1,2],6))
a<-table.element(a,signif(gqarr[mypoint-kp3+1,3],6))
a<-table.row.end(a)
}
a<-table.end(a)
table.save(a,file='mytable5.tab')
a<-table.start()
a<-table.row.start(a)
a<-table.element(a,'Meta Analysis of Goldfeld-Quandt test for Heteroskedasticity',4,TRUE)
a<-table.row.end(a)
a<-table.row.start(a)
a<-table.element(a,'Description',header=TRUE)
a<-table.element(a,'# significant tests',header=TRUE)
a<-table.element(a,'% significant tests',header=TRUE)
a<-table.element(a,'OK/NOK',header=TRUE)
a<-table.row.end(a)
a<-table.row.start(a)
a<-table.element(a,'1% type I error level',header=TRUE)
a<-table.element(a,signif(numsignificant1,6))
a<-table.element(a,signif(numsignificant1/numgqtests,6))
if (numsignificant1/numgqtests < 0.01) dum <- 'OK' else dum <- 'NOK'
a<-table.element(a,dum)
a<-table.row.end(a)
a<-table.row.start(a)
a<-table.element(a,'5% type I error level',header=TRUE)
a<-table.element(a,signif(numsignificant5,6))
a<-table.element(a,signif(numsignificant5/numgqtests,6))
if (numsignificant5/numgqtests < 0.05) dum <- 'OK' else dum <- 'NOK'
a<-table.element(a,dum)
a<-table.row.end(a)
a<-table.row.start(a)
a<-table.element(a,'10% type I error level',header=TRUE)
a<-table.element(a,signif(numsignificant10,6))
a<-table.element(a,signif(numsignificant10/numgqtests,6))
if (numsignificant10/numgqtests < 0.1) dum <- 'OK' else dum <- 'NOK'
a<-table.element(a,dum)
a<-table.row.end(a)
a<-table.end(a)
table.save(a,file='mytable6.tab')
}