Free Statistics

of Irreproducible Research!

Author's title

Author*Unverified author*
R Software Modulerwasp_autocorrelation.wasp
Title produced by software(Partial) Autocorrelation Function
Date of computationSat, 13 Dec 2014 16:20:44 +0000
Cite this page as followsStatistical Computations at FreeStatistics.org, Office for Research Development and Education, URL https://freestatistics.org/blog/index.php?v=date/2014/Dec/13/t1418487726d0gcc3d28z5m80c.htm/, Retrieved Thu, 16 May 2024 08:07:55 +0000
Statistical Computations at FreeStatistics.org, Office for Research Development and Education, URL https://freestatistics.org/blog/index.php?pk=267204, Retrieved Thu, 16 May 2024 08:07:55 +0000
QR Codes:

Original text written by user:
IsPrivate?No (this computation is public)
User-defined keywords
Estimated Impact70
Family? (F = Feedback message, R = changed R code, M = changed R Module, P = changed Parameters, D = changed Data)
-       [(Partial) Autocorrelation Function] [] [2014-12-13 16:20:44] [e5757b82694375e1f239be852782e5f7] [Current]
Feedback Forum

Post a new message
Dataseries X:
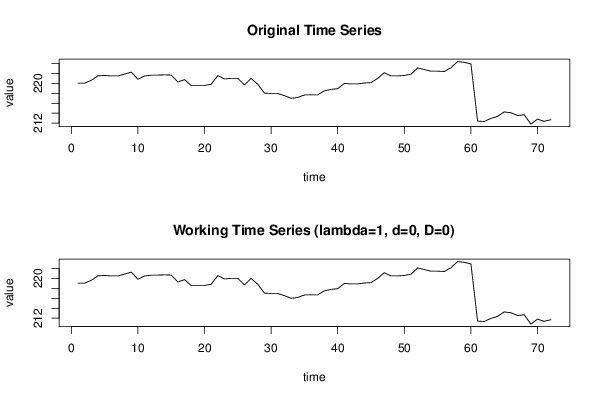
220.05
220.05
220.62
221.53
221.61
221.5
221.5
221.87
222.27
220.86
221.49
221.67
221.67
221.72
221.67
220.29
220.75
219.59
219.59
219.59
219.82
221.59
220.9
221.01
221.01
219.69
221
219.82
218.04
217.97
217.97
217.53
217
217.18
217.68
217.71
217.71
218.5
218.8
218.94
220
219.89
219.89
220.08
220.16
221
222.16
221.5
221.5
221.6
221.85
223.11
222.79
222.45
222.45
222.4
223.15
224.4
224.24
223.92
212.42
212.34
212.95
213.37
214.26
214.1
213.54
213.69
211.82
212.82
212.36
212.7


Summary of computational transaction
Raw Inputview raw input (R code)
Raw Outputview raw output of R engine
Computing time1 seconds
R Server'Sir Ronald Aylmer Fisher' @ fisher.wessa.net

\begin{tabular}{lllllllll}
\hline
Summary of computational transaction \tabularnewline
Raw Input & view raw input (R code)  \tabularnewline
Raw Output & view raw output of R engine  \tabularnewline
Computing time & 1 seconds \tabularnewline
R Server & 'Sir Ronald Aylmer Fisher' @ fisher.wessa.net \tabularnewline
\hline
\end{tabular}
%Source: https://freestatistics.org/blog/index.php?pk=267204&T=0

[TABLE]
[ROW][C]Summary of computational transaction[/C][/ROW]
[ROW][C]Raw Input[/C][C]view raw input (R code) [/C][/ROW]
[ROW][C]Raw Output[/C][C]view raw output of R engine [/C][/ROW]
[ROW][C]Computing time[/C][C]1 seconds[/C][/ROW]
[ROW][C]R Server[/C][C]'Sir Ronald Aylmer Fisher' @ fisher.wessa.net[/C][/ROW]
[/TABLE]
Source: https://freestatistics.org/blog/index.php?pk=267204&T=0

Globally Unique Identifier (entire table): ba.freestatistics.org/blog/index.php?pk=267204&T=0

As an alternative you can also use a QR Code:  

The GUIDs for individual cells are displayed in the table below:

Summary of computational transaction
Raw Inputview raw input (R code)
Raw Outputview raw output of R engine
Computing time1 seconds
R Server'Sir Ronald Aylmer Fisher' @ fisher.wessa.net


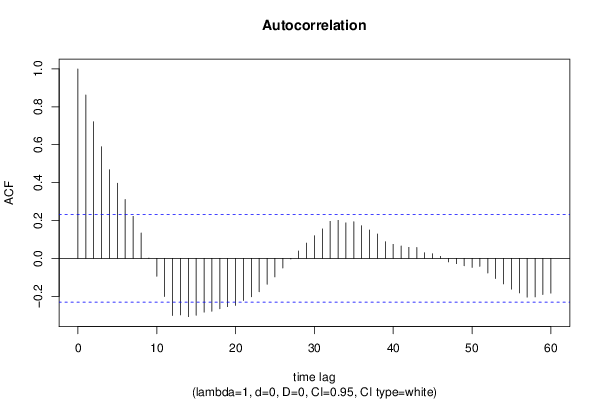
Autocorrelation Function
Time lag kACF(k)T-STATP-value
10.8624657.31830
20.7216396.12330
30.5894045.00132e-06
40.4680843.97188.4e-05
50.396183.36170.000621
60.3110692.63950.005086
70.2217721.88180.031953
80.1337731.13510.130048
90.0007960.00680.497315
10-0.094891-0.80520.211684
11-0.200943-1.70510.046248
12-0.30198-2.56240.006244
13-0.298297-2.53110.006777
14-0.307713-2.6110.005489
15-0.300204-2.54730.006496
16-0.283935-2.40930.009272
17-0.279652-2.37290.01016
18-0.266497-2.26130.013381
19-0.254742-2.16160.016989
20-0.248168-2.10580.019356
21-0.222101-1.88460.031761
22-0.202686-1.71980.044878
23-0.176397-1.49680.069411
24-0.136739-1.16030.124887
25-0.097691-0.82890.20494
26-0.050762-0.43070.333977
27-0.003069-0.0260.489647
280.038870.32980.371247
290.0805050.68310.248365
300.119761.01620.15647
310.1555661.320.095505
320.19521.65630.051004
330.2005531.70180.046558
340.1873811.590.05811
350.1935731.64250.052421
360.171871.45840.074544
370.1493781.26750.104528
380.1285981.09120.139414
390.0879390.74620.228992
400.0738990.62710.266304
410.0657390.55780.289351
420.0581930.49380.311481
430.0573590.48670.313971
440.0295440.25070.401384
450.0246150.20890.417571
460.0106050.090.464276
47-0.018571-0.15760.437614
48-0.027747-0.23540.407267
49-0.038657-0.3280.371925
50-0.047585-0.40380.343788
51-0.042159-0.35770.360796
52-0.077733-0.65960.255811
53-0.106616-0.90470.18433
54-0.134665-1.14270.128481
55-0.162527-1.37910.086068
56-0.182114-1.54530.06333
57-0.204684-1.73680.04335
58-0.203513-1.72690.04424
59-0.191262-1.62290.05449
60-0.183677-1.55850.061744

\begin{tabular}{lllllllll}
\hline
Autocorrelation Function \tabularnewline
Time lag k & ACF(k) & T-STAT & P-value \tabularnewline
1 & 0.862465 & 7.3183 & 0 \tabularnewline
2 & 0.721639 & 6.1233 & 0 \tabularnewline
3 & 0.589404 & 5.0013 & 2e-06 \tabularnewline
4 & 0.468084 & 3.9718 & 8.4e-05 \tabularnewline
5 & 0.39618 & 3.3617 & 0.000621 \tabularnewline
6 & 0.311069 & 2.6395 & 0.005086 \tabularnewline
7 & 0.221772 & 1.8818 & 0.031953 \tabularnewline
8 & 0.133773 & 1.1351 & 0.130048 \tabularnewline
9 & 0.000796 & 0.0068 & 0.497315 \tabularnewline
10 & -0.094891 & -0.8052 & 0.211684 \tabularnewline
11 & -0.200943 & -1.7051 & 0.046248 \tabularnewline
12 & -0.30198 & -2.5624 & 0.006244 \tabularnewline
13 & -0.298297 & -2.5311 & 0.006777 \tabularnewline
14 & -0.307713 & -2.611 & 0.005489 \tabularnewline
15 & -0.300204 & -2.5473 & 0.006496 \tabularnewline
16 & -0.283935 & -2.4093 & 0.009272 \tabularnewline
17 & -0.279652 & -2.3729 & 0.01016 \tabularnewline
18 & -0.266497 & -2.2613 & 0.013381 \tabularnewline
19 & -0.254742 & -2.1616 & 0.016989 \tabularnewline
20 & -0.248168 & -2.1058 & 0.019356 \tabularnewline
21 & -0.222101 & -1.8846 & 0.031761 \tabularnewline
22 & -0.202686 & -1.7198 & 0.044878 \tabularnewline
23 & -0.176397 & -1.4968 & 0.069411 \tabularnewline
24 & -0.136739 & -1.1603 & 0.124887 \tabularnewline
25 & -0.097691 & -0.8289 & 0.20494 \tabularnewline
26 & -0.050762 & -0.4307 & 0.333977 \tabularnewline
27 & -0.003069 & -0.026 & 0.489647 \tabularnewline
28 & 0.03887 & 0.3298 & 0.371247 \tabularnewline
29 & 0.080505 & 0.6831 & 0.248365 \tabularnewline
30 & 0.11976 & 1.0162 & 0.15647 \tabularnewline
31 & 0.155566 & 1.32 & 0.095505 \tabularnewline
32 & 0.1952 & 1.6563 & 0.051004 \tabularnewline
33 & 0.200553 & 1.7018 & 0.046558 \tabularnewline
34 & 0.187381 & 1.59 & 0.05811 \tabularnewline
35 & 0.193573 & 1.6425 & 0.052421 \tabularnewline
36 & 0.17187 & 1.4584 & 0.074544 \tabularnewline
37 & 0.149378 & 1.2675 & 0.104528 \tabularnewline
38 & 0.128598 & 1.0912 & 0.139414 \tabularnewline
39 & 0.087939 & 0.7462 & 0.228992 \tabularnewline
40 & 0.073899 & 0.6271 & 0.266304 \tabularnewline
41 & 0.065739 & 0.5578 & 0.289351 \tabularnewline
42 & 0.058193 & 0.4938 & 0.311481 \tabularnewline
43 & 0.057359 & 0.4867 & 0.313971 \tabularnewline
44 & 0.029544 & 0.2507 & 0.401384 \tabularnewline
45 & 0.024615 & 0.2089 & 0.417571 \tabularnewline
46 & 0.010605 & 0.09 & 0.464276 \tabularnewline
47 & -0.018571 & -0.1576 & 0.437614 \tabularnewline
48 & -0.027747 & -0.2354 & 0.407267 \tabularnewline
49 & -0.038657 & -0.328 & 0.371925 \tabularnewline
50 & -0.047585 & -0.4038 & 0.343788 \tabularnewline
51 & -0.042159 & -0.3577 & 0.360796 \tabularnewline
52 & -0.077733 & -0.6596 & 0.255811 \tabularnewline
53 & -0.106616 & -0.9047 & 0.18433 \tabularnewline
54 & -0.134665 & -1.1427 & 0.128481 \tabularnewline
55 & -0.162527 & -1.3791 & 0.086068 \tabularnewline
56 & -0.182114 & -1.5453 & 0.06333 \tabularnewline
57 & -0.204684 & -1.7368 & 0.04335 \tabularnewline
58 & -0.203513 & -1.7269 & 0.04424 \tabularnewline
59 & -0.191262 & -1.6229 & 0.05449 \tabularnewline
60 & -0.183677 & -1.5585 & 0.061744 \tabularnewline
\hline
\end{tabular}
%Source: https://freestatistics.org/blog/index.php?pk=267204&T=1

[TABLE]
[ROW][C]Autocorrelation Function[/C][/ROW]
[ROW][C]Time lag k[/C][C]ACF(k)[/C][C]T-STAT[/C][C]P-value[/C][/ROW]
[ROW][C]1[/C][C]0.862465[/C][C]7.3183[/C][C]0[/C][/ROW]
[ROW][C]2[/C][C]0.721639[/C][C]6.1233[/C][C]0[/C][/ROW]
[ROW][C]3[/C][C]0.589404[/C][C]5.0013[/C][C]2e-06[/C][/ROW]
[ROW][C]4[/C][C]0.468084[/C][C]3.9718[/C][C]8.4e-05[/C][/ROW]
[ROW][C]5[/C][C]0.39618[/C][C]3.3617[/C][C]0.000621[/C][/ROW]
[ROW][C]6[/C][C]0.311069[/C][C]2.6395[/C][C]0.005086[/C][/ROW]
[ROW][C]7[/C][C]0.221772[/C][C]1.8818[/C][C]0.031953[/C][/ROW]
[ROW][C]8[/C][C]0.133773[/C][C]1.1351[/C][C]0.130048[/C][/ROW]
[ROW][C]9[/C][C]0.000796[/C][C]0.0068[/C][C]0.497315[/C][/ROW]
[ROW][C]10[/C][C]-0.094891[/C][C]-0.8052[/C][C]0.211684[/C][/ROW]
[ROW][C]11[/C][C]-0.200943[/C][C]-1.7051[/C][C]0.046248[/C][/ROW]
[ROW][C]12[/C][C]-0.30198[/C][C]-2.5624[/C][C]0.006244[/C][/ROW]
[ROW][C]13[/C][C]-0.298297[/C][C]-2.5311[/C][C]0.006777[/C][/ROW]
[ROW][C]14[/C][C]-0.307713[/C][C]-2.611[/C][C]0.005489[/C][/ROW]
[ROW][C]15[/C][C]-0.300204[/C][C]-2.5473[/C][C]0.006496[/C][/ROW]
[ROW][C]16[/C][C]-0.283935[/C][C]-2.4093[/C][C]0.009272[/C][/ROW]
[ROW][C]17[/C][C]-0.279652[/C][C]-2.3729[/C][C]0.01016[/C][/ROW]
[ROW][C]18[/C][C]-0.266497[/C][C]-2.2613[/C][C]0.013381[/C][/ROW]
[ROW][C]19[/C][C]-0.254742[/C][C]-2.1616[/C][C]0.016989[/C][/ROW]
[ROW][C]20[/C][C]-0.248168[/C][C]-2.1058[/C][C]0.019356[/C][/ROW]
[ROW][C]21[/C][C]-0.222101[/C][C]-1.8846[/C][C]0.031761[/C][/ROW]
[ROW][C]22[/C][C]-0.202686[/C][C]-1.7198[/C][C]0.044878[/C][/ROW]
[ROW][C]23[/C][C]-0.176397[/C][C]-1.4968[/C][C]0.069411[/C][/ROW]
[ROW][C]24[/C][C]-0.136739[/C][C]-1.1603[/C][C]0.124887[/C][/ROW]
[ROW][C]25[/C][C]-0.097691[/C][C]-0.8289[/C][C]0.20494[/C][/ROW]
[ROW][C]26[/C][C]-0.050762[/C][C]-0.4307[/C][C]0.333977[/C][/ROW]
[ROW][C]27[/C][C]-0.003069[/C][C]-0.026[/C][C]0.489647[/C][/ROW]
[ROW][C]28[/C][C]0.03887[/C][C]0.3298[/C][C]0.371247[/C][/ROW]
[ROW][C]29[/C][C]0.080505[/C][C]0.6831[/C][C]0.248365[/C][/ROW]
[ROW][C]30[/C][C]0.11976[/C][C]1.0162[/C][C]0.15647[/C][/ROW]
[ROW][C]31[/C][C]0.155566[/C][C]1.32[/C][C]0.095505[/C][/ROW]
[ROW][C]32[/C][C]0.1952[/C][C]1.6563[/C][C]0.051004[/C][/ROW]
[ROW][C]33[/C][C]0.200553[/C][C]1.7018[/C][C]0.046558[/C][/ROW]
[ROW][C]34[/C][C]0.187381[/C][C]1.59[/C][C]0.05811[/C][/ROW]
[ROW][C]35[/C][C]0.193573[/C][C]1.6425[/C][C]0.052421[/C][/ROW]
[ROW][C]36[/C][C]0.17187[/C][C]1.4584[/C][C]0.074544[/C][/ROW]
[ROW][C]37[/C][C]0.149378[/C][C]1.2675[/C][C]0.104528[/C][/ROW]
[ROW][C]38[/C][C]0.128598[/C][C]1.0912[/C][C]0.139414[/C][/ROW]
[ROW][C]39[/C][C]0.087939[/C][C]0.7462[/C][C]0.228992[/C][/ROW]
[ROW][C]40[/C][C]0.073899[/C][C]0.6271[/C][C]0.266304[/C][/ROW]
[ROW][C]41[/C][C]0.065739[/C][C]0.5578[/C][C]0.289351[/C][/ROW]
[ROW][C]42[/C][C]0.058193[/C][C]0.4938[/C][C]0.311481[/C][/ROW]
[ROW][C]43[/C][C]0.057359[/C][C]0.4867[/C][C]0.313971[/C][/ROW]
[ROW][C]44[/C][C]0.029544[/C][C]0.2507[/C][C]0.401384[/C][/ROW]
[ROW][C]45[/C][C]0.024615[/C][C]0.2089[/C][C]0.417571[/C][/ROW]
[ROW][C]46[/C][C]0.010605[/C][C]0.09[/C][C]0.464276[/C][/ROW]
[ROW][C]47[/C][C]-0.018571[/C][C]-0.1576[/C][C]0.437614[/C][/ROW]
[ROW][C]48[/C][C]-0.027747[/C][C]-0.2354[/C][C]0.407267[/C][/ROW]
[ROW][C]49[/C][C]-0.038657[/C][C]-0.328[/C][C]0.371925[/C][/ROW]
[ROW][C]50[/C][C]-0.047585[/C][C]-0.4038[/C][C]0.343788[/C][/ROW]
[ROW][C]51[/C][C]-0.042159[/C][C]-0.3577[/C][C]0.360796[/C][/ROW]
[ROW][C]52[/C][C]-0.077733[/C][C]-0.6596[/C][C]0.255811[/C][/ROW]
[ROW][C]53[/C][C]-0.106616[/C][C]-0.9047[/C][C]0.18433[/C][/ROW]
[ROW][C]54[/C][C]-0.134665[/C][C]-1.1427[/C][C]0.128481[/C][/ROW]
[ROW][C]55[/C][C]-0.162527[/C][C]-1.3791[/C][C]0.086068[/C][/ROW]
[ROW][C]56[/C][C]-0.182114[/C][C]-1.5453[/C][C]0.06333[/C][/ROW]
[ROW][C]57[/C][C]-0.204684[/C][C]-1.7368[/C][C]0.04335[/C][/ROW]
[ROW][C]58[/C][C]-0.203513[/C][C]-1.7269[/C][C]0.04424[/C][/ROW]
[ROW][C]59[/C][C]-0.191262[/C][C]-1.6229[/C][C]0.05449[/C][/ROW]
[ROW][C]60[/C][C]-0.183677[/C][C]-1.5585[/C][C]0.061744[/C][/ROW]
[/TABLE]
Source: https://freestatistics.org/blog/index.php?pk=267204&T=1

Globally Unique Identifier (entire table): ba.freestatistics.org/blog/index.php?pk=267204&T=1

As an alternative you can also use a QR Code:  

The GUIDs for individual cells are displayed in the table below:

Autocorrelation Function
Time lag kACF(k)T-STATP-value
10.8624657.31830
20.7216396.12330
30.5894045.00132e-06
40.4680843.97188.4e-05
50.396183.36170.000621
60.3110692.63950.005086
70.2217721.88180.031953
80.1337731.13510.130048
90.0007960.00680.497315
10-0.094891-0.80520.211684
11-0.200943-1.70510.046248
12-0.30198-2.56240.006244
13-0.298297-2.53110.006777
14-0.307713-2.6110.005489
15-0.300204-2.54730.006496
16-0.283935-2.40930.009272
17-0.279652-2.37290.01016
18-0.266497-2.26130.013381
19-0.254742-2.16160.016989
20-0.248168-2.10580.019356
21-0.222101-1.88460.031761
22-0.202686-1.71980.044878
23-0.176397-1.49680.069411
24-0.136739-1.16030.124887
25-0.097691-0.82890.20494
26-0.050762-0.43070.333977
27-0.003069-0.0260.489647
280.038870.32980.371247
290.0805050.68310.248365
300.119761.01620.15647
310.1555661.320.095505
320.19521.65630.051004
330.2005531.70180.046558
340.1873811.590.05811
350.1935731.64250.052421
360.171871.45840.074544
370.1493781.26750.104528
380.1285981.09120.139414
390.0879390.74620.228992
400.0738990.62710.266304
410.0657390.55780.289351
420.0581930.49380.311481
430.0573590.48670.313971
440.0295440.25070.401384
450.0246150.20890.417571
460.0106050.090.464276
47-0.018571-0.15760.437614
48-0.027747-0.23540.407267
49-0.038657-0.3280.371925
50-0.047585-0.40380.343788
51-0.042159-0.35770.360796
52-0.077733-0.65960.255811
53-0.106616-0.90470.18433
54-0.134665-1.14270.128481
55-0.162527-1.37910.086068
56-0.182114-1.54530.06333
57-0.204684-1.73680.04335
58-0.203513-1.72690.04424
59-0.191262-1.62290.05449
60-0.183677-1.55850.061744


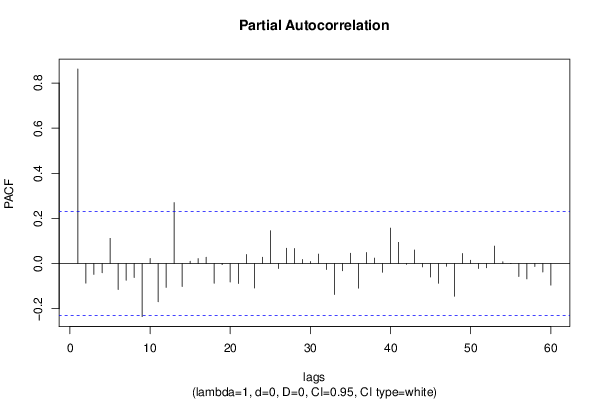
Partial Autocorrelation Function
Time lag kPACF(k)T-STATP-value
10.8624657.31830
2-0.086691-0.73560.232183
3-0.047879-0.40630.342876
4-0.041031-0.34820.364368
50.1117920.94860.173001
6-0.114645-0.97280.166956
7-0.073786-0.62610.266617
8-0.061821-0.52460.300747
9-0.235256-1.99620.024847
100.0222110.18850.425519
11-0.168969-1.43370.077986
12-0.105615-0.89620.186572
130.2701022.29190.012419
14-0.101647-0.86250.195636
150.0102020.08660.465628
160.0218780.18560.426624
170.0276680.23480.407526
18-0.087262-0.74040.23072
19-0.004621-0.03920.484416
20-0.081784-0.6940.24497
21-0.088584-0.75170.227353
220.039960.33910.36777
23-0.108137-0.91760.180953
240.0279520.23720.406595
250.1457281.23650.110138
26-0.022167-0.18810.425667
270.0676070.57370.283991
280.0664470.56380.287313
290.0184030.15620.438173
300.0094160.07990.468269
310.0417810.35450.361992
32-0.026448-0.22440.411533
33-0.136969-1.16220.124492
34-0.032194-0.27320.392749
350.04540.38520.350602
36-0.10901-0.9250.179033
370.0490820.41650.339151
380.0242790.2060.41868
39-0.038471-0.32640.372522
400.1572351.33420.093174
410.0940410.7980.213759
42-0.003596-0.03050.48787
430.0601260.51020.305741
44-0.014597-0.12390.450884
45-0.059369-0.50380.307982
46-0.086944-0.73770.231534
47-0.012078-0.10250.459329
48-0.144518-1.22630.112045
490.04460.37840.353109
500.0151110.12820.449166
51-0.021758-0.18460.427023
52-0.018428-0.15640.43809
530.0772290.65530.257179
540.0077920.06610.473734
55-0.000852-0.00720.497127
56-0.057012-0.48380.315011
57-0.067998-0.5770.282876
58-0.012692-0.10770.457267
59-0.037492-0.31810.375653
60-0.095523-0.81050.21015

\begin{tabular}{lllllllll}
\hline
Partial Autocorrelation Function \tabularnewline
Time lag k & PACF(k) & T-STAT & P-value \tabularnewline
1 & 0.862465 & 7.3183 & 0 \tabularnewline
2 & -0.086691 & -0.7356 & 0.232183 \tabularnewline
3 & -0.047879 & -0.4063 & 0.342876 \tabularnewline
4 & -0.041031 & -0.3482 & 0.364368 \tabularnewline
5 & 0.111792 & 0.9486 & 0.173001 \tabularnewline
6 & -0.114645 & -0.9728 & 0.166956 \tabularnewline
7 & -0.073786 & -0.6261 & 0.266617 \tabularnewline
8 & -0.061821 & -0.5246 & 0.300747 \tabularnewline
9 & -0.235256 & -1.9962 & 0.024847 \tabularnewline
10 & 0.022211 & 0.1885 & 0.425519 \tabularnewline
11 & -0.168969 & -1.4337 & 0.077986 \tabularnewline
12 & -0.105615 & -0.8962 & 0.186572 \tabularnewline
13 & 0.270102 & 2.2919 & 0.012419 \tabularnewline
14 & -0.101647 & -0.8625 & 0.195636 \tabularnewline
15 & 0.010202 & 0.0866 & 0.465628 \tabularnewline
16 & 0.021878 & 0.1856 & 0.426624 \tabularnewline
17 & 0.027668 & 0.2348 & 0.407526 \tabularnewline
18 & -0.087262 & -0.7404 & 0.23072 \tabularnewline
19 & -0.004621 & -0.0392 & 0.484416 \tabularnewline
20 & -0.081784 & -0.694 & 0.24497 \tabularnewline
21 & -0.088584 & -0.7517 & 0.227353 \tabularnewline
22 & 0.03996 & 0.3391 & 0.36777 \tabularnewline
23 & -0.108137 & -0.9176 & 0.180953 \tabularnewline
24 & 0.027952 & 0.2372 & 0.406595 \tabularnewline
25 & 0.145728 & 1.2365 & 0.110138 \tabularnewline
26 & -0.022167 & -0.1881 & 0.425667 \tabularnewline
27 & 0.067607 & 0.5737 & 0.283991 \tabularnewline
28 & 0.066447 & 0.5638 & 0.287313 \tabularnewline
29 & 0.018403 & 0.1562 & 0.438173 \tabularnewline
30 & 0.009416 & 0.0799 & 0.468269 \tabularnewline
31 & 0.041781 & 0.3545 & 0.361992 \tabularnewline
32 & -0.026448 & -0.2244 & 0.411533 \tabularnewline
33 & -0.136969 & -1.1622 & 0.124492 \tabularnewline
34 & -0.032194 & -0.2732 & 0.392749 \tabularnewline
35 & 0.0454 & 0.3852 & 0.350602 \tabularnewline
36 & -0.10901 & -0.925 & 0.179033 \tabularnewline
37 & 0.049082 & 0.4165 & 0.339151 \tabularnewline
38 & 0.024279 & 0.206 & 0.41868 \tabularnewline
39 & -0.038471 & -0.3264 & 0.372522 \tabularnewline
40 & 0.157235 & 1.3342 & 0.093174 \tabularnewline
41 & 0.094041 & 0.798 & 0.213759 \tabularnewline
42 & -0.003596 & -0.0305 & 0.48787 \tabularnewline
43 & 0.060126 & 0.5102 & 0.305741 \tabularnewline
44 & -0.014597 & -0.1239 & 0.450884 \tabularnewline
45 & -0.059369 & -0.5038 & 0.307982 \tabularnewline
46 & -0.086944 & -0.7377 & 0.231534 \tabularnewline
47 & -0.012078 & -0.1025 & 0.459329 \tabularnewline
48 & -0.144518 & -1.2263 & 0.112045 \tabularnewline
49 & 0.0446 & 0.3784 & 0.353109 \tabularnewline
50 & 0.015111 & 0.1282 & 0.449166 \tabularnewline
51 & -0.021758 & -0.1846 & 0.427023 \tabularnewline
52 & -0.018428 & -0.1564 & 0.43809 \tabularnewline
53 & 0.077229 & 0.6553 & 0.257179 \tabularnewline
54 & 0.007792 & 0.0661 & 0.473734 \tabularnewline
55 & -0.000852 & -0.0072 & 0.497127 \tabularnewline
56 & -0.057012 & -0.4838 & 0.315011 \tabularnewline
57 & -0.067998 & -0.577 & 0.282876 \tabularnewline
58 & -0.012692 & -0.1077 & 0.457267 \tabularnewline
59 & -0.037492 & -0.3181 & 0.375653 \tabularnewline
60 & -0.095523 & -0.8105 & 0.21015 \tabularnewline
\hline
\end{tabular}
%Source: https://freestatistics.org/blog/index.php?pk=267204&T=2

[TABLE]
[ROW][C]Partial Autocorrelation Function[/C][/ROW]
[ROW][C]Time lag k[/C][C]PACF(k)[/C][C]T-STAT[/C][C]P-value[/C][/ROW]
[ROW][C]1[/C][C]0.862465[/C][C]7.3183[/C][C]0[/C][/ROW]
[ROW][C]2[/C][C]-0.086691[/C][C]-0.7356[/C][C]0.232183[/C][/ROW]
[ROW][C]3[/C][C]-0.047879[/C][C]-0.4063[/C][C]0.342876[/C][/ROW]
[ROW][C]4[/C][C]-0.041031[/C][C]-0.3482[/C][C]0.364368[/C][/ROW]
[ROW][C]5[/C][C]0.111792[/C][C]0.9486[/C][C]0.173001[/C][/ROW]
[ROW][C]6[/C][C]-0.114645[/C][C]-0.9728[/C][C]0.166956[/C][/ROW]
[ROW][C]7[/C][C]-0.073786[/C][C]-0.6261[/C][C]0.266617[/C][/ROW]
[ROW][C]8[/C][C]-0.061821[/C][C]-0.5246[/C][C]0.300747[/C][/ROW]
[ROW][C]9[/C][C]-0.235256[/C][C]-1.9962[/C][C]0.024847[/C][/ROW]
[ROW][C]10[/C][C]0.022211[/C][C]0.1885[/C][C]0.425519[/C][/ROW]
[ROW][C]11[/C][C]-0.168969[/C][C]-1.4337[/C][C]0.077986[/C][/ROW]
[ROW][C]12[/C][C]-0.105615[/C][C]-0.8962[/C][C]0.186572[/C][/ROW]
[ROW][C]13[/C][C]0.270102[/C][C]2.2919[/C][C]0.012419[/C][/ROW]
[ROW][C]14[/C][C]-0.101647[/C][C]-0.8625[/C][C]0.195636[/C][/ROW]
[ROW][C]15[/C][C]0.010202[/C][C]0.0866[/C][C]0.465628[/C][/ROW]
[ROW][C]16[/C][C]0.021878[/C][C]0.1856[/C][C]0.426624[/C][/ROW]
[ROW][C]17[/C][C]0.027668[/C][C]0.2348[/C][C]0.407526[/C][/ROW]
[ROW][C]18[/C][C]-0.087262[/C][C]-0.7404[/C][C]0.23072[/C][/ROW]
[ROW][C]19[/C][C]-0.004621[/C][C]-0.0392[/C][C]0.484416[/C][/ROW]
[ROW][C]20[/C][C]-0.081784[/C][C]-0.694[/C][C]0.24497[/C][/ROW]
[ROW][C]21[/C][C]-0.088584[/C][C]-0.7517[/C][C]0.227353[/C][/ROW]
[ROW][C]22[/C][C]0.03996[/C][C]0.3391[/C][C]0.36777[/C][/ROW]
[ROW][C]23[/C][C]-0.108137[/C][C]-0.9176[/C][C]0.180953[/C][/ROW]
[ROW][C]24[/C][C]0.027952[/C][C]0.2372[/C][C]0.406595[/C][/ROW]
[ROW][C]25[/C][C]0.145728[/C][C]1.2365[/C][C]0.110138[/C][/ROW]
[ROW][C]26[/C][C]-0.022167[/C][C]-0.1881[/C][C]0.425667[/C][/ROW]
[ROW][C]27[/C][C]0.067607[/C][C]0.5737[/C][C]0.283991[/C][/ROW]
[ROW][C]28[/C][C]0.066447[/C][C]0.5638[/C][C]0.287313[/C][/ROW]
[ROW][C]29[/C][C]0.018403[/C][C]0.1562[/C][C]0.438173[/C][/ROW]
[ROW][C]30[/C][C]0.009416[/C][C]0.0799[/C][C]0.468269[/C][/ROW]
[ROW][C]31[/C][C]0.041781[/C][C]0.3545[/C][C]0.361992[/C][/ROW]
[ROW][C]32[/C][C]-0.026448[/C][C]-0.2244[/C][C]0.411533[/C][/ROW]
[ROW][C]33[/C][C]-0.136969[/C][C]-1.1622[/C][C]0.124492[/C][/ROW]
[ROW][C]34[/C][C]-0.032194[/C][C]-0.2732[/C][C]0.392749[/C][/ROW]
[ROW][C]35[/C][C]0.0454[/C][C]0.3852[/C][C]0.350602[/C][/ROW]
[ROW][C]36[/C][C]-0.10901[/C][C]-0.925[/C][C]0.179033[/C][/ROW]
[ROW][C]37[/C][C]0.049082[/C][C]0.4165[/C][C]0.339151[/C][/ROW]
[ROW][C]38[/C][C]0.024279[/C][C]0.206[/C][C]0.41868[/C][/ROW]
[ROW][C]39[/C][C]-0.038471[/C][C]-0.3264[/C][C]0.372522[/C][/ROW]
[ROW][C]40[/C][C]0.157235[/C][C]1.3342[/C][C]0.093174[/C][/ROW]
[ROW][C]41[/C][C]0.094041[/C][C]0.798[/C][C]0.213759[/C][/ROW]
[ROW][C]42[/C][C]-0.003596[/C][C]-0.0305[/C][C]0.48787[/C][/ROW]
[ROW][C]43[/C][C]0.060126[/C][C]0.5102[/C][C]0.305741[/C][/ROW]
[ROW][C]44[/C][C]-0.014597[/C][C]-0.1239[/C][C]0.450884[/C][/ROW]
[ROW][C]45[/C][C]-0.059369[/C][C]-0.5038[/C][C]0.307982[/C][/ROW]
[ROW][C]46[/C][C]-0.086944[/C][C]-0.7377[/C][C]0.231534[/C][/ROW]
[ROW][C]47[/C][C]-0.012078[/C][C]-0.1025[/C][C]0.459329[/C][/ROW]
[ROW][C]48[/C][C]-0.144518[/C][C]-1.2263[/C][C]0.112045[/C][/ROW]
[ROW][C]49[/C][C]0.0446[/C][C]0.3784[/C][C]0.353109[/C][/ROW]
[ROW][C]50[/C][C]0.015111[/C][C]0.1282[/C][C]0.449166[/C][/ROW]
[ROW][C]51[/C][C]-0.021758[/C][C]-0.1846[/C][C]0.427023[/C][/ROW]
[ROW][C]52[/C][C]-0.018428[/C][C]-0.1564[/C][C]0.43809[/C][/ROW]
[ROW][C]53[/C][C]0.077229[/C][C]0.6553[/C][C]0.257179[/C][/ROW]
[ROW][C]54[/C][C]0.007792[/C][C]0.0661[/C][C]0.473734[/C][/ROW]
[ROW][C]55[/C][C]-0.000852[/C][C]-0.0072[/C][C]0.497127[/C][/ROW]
[ROW][C]56[/C][C]-0.057012[/C][C]-0.4838[/C][C]0.315011[/C][/ROW]
[ROW][C]57[/C][C]-0.067998[/C][C]-0.577[/C][C]0.282876[/C][/ROW]
[ROW][C]58[/C][C]-0.012692[/C][C]-0.1077[/C][C]0.457267[/C][/ROW]
[ROW][C]59[/C][C]-0.037492[/C][C]-0.3181[/C][C]0.375653[/C][/ROW]
[ROW][C]60[/C][C]-0.095523[/C][C]-0.8105[/C][C]0.21015[/C][/ROW]
[/TABLE]
Source: https://freestatistics.org/blog/index.php?pk=267204&T=2

Globally Unique Identifier (entire table): ba.freestatistics.org/blog/index.php?pk=267204&T=2

As an alternative you can also use a QR Code:  

The GUIDs for individual cells are displayed in the table below:

Partial Autocorrelation Function
Time lag kPACF(k)T-STATP-value
10.8624657.31830
2-0.086691-0.73560.232183
3-0.047879-0.40630.342876
4-0.041031-0.34820.364368
50.1117920.94860.173001
6-0.114645-0.97280.166956
7-0.073786-0.62610.266617
8-0.061821-0.52460.300747
9-0.235256-1.99620.024847
100.0222110.18850.425519
11-0.168969-1.43370.077986
12-0.105615-0.89620.186572
130.2701022.29190.012419
14-0.101647-0.86250.195636
150.0102020.08660.465628
160.0218780.18560.426624
170.0276680.23480.407526
18-0.087262-0.74040.23072
19-0.004621-0.03920.484416
20-0.081784-0.6940.24497
21-0.088584-0.75170.227353
220.039960.33910.36777
23-0.108137-0.91760.180953
240.0279520.23720.406595
250.1457281.23650.110138
26-0.022167-0.18810.425667
270.0676070.57370.283991
280.0664470.56380.287313
290.0184030.15620.438173
300.0094160.07990.468269
310.0417810.35450.361992
32-0.026448-0.22440.411533
33-0.136969-1.16220.124492
34-0.032194-0.27320.392749
350.04540.38520.350602
36-0.10901-0.9250.179033
370.0490820.41650.339151
380.0242790.2060.41868
39-0.038471-0.32640.372522
400.1572351.33420.093174
410.0940410.7980.213759
42-0.003596-0.03050.48787
430.0601260.51020.305741
44-0.014597-0.12390.450884
45-0.059369-0.50380.307982
46-0.086944-0.73770.231534
47-0.012078-0.10250.459329
48-0.144518-1.22630.112045
490.04460.37840.353109
500.0151110.12820.449166
51-0.021758-0.18460.427023
52-0.018428-0.15640.43809
530.0772290.65530.257179
540.0077920.06610.473734
55-0.000852-0.00720.497127
56-0.057012-0.48380.315011
57-0.067998-0.5770.282876
58-0.012692-0.10770.457267
59-0.037492-0.31810.375653
60-0.095523-0.81050.21015


Parameters (Session):
par1 = 12 ;
Parameters (R input):
par1 = 60 ; par2 = 1 ; par3 = 0 ; par4 = 0 ; par5 = 12 ; par6 = White Noise ; par7 = 0.95 ; par8 = ;
R code (references can be found in the software module):
par8 <- ''
par7 <- '0.95'
par6 <- 'White Noise'
par5 <- '12'
par4 <- '0'
par3 <- '1'
par2 <- '1'
par1 <- '60'
if (par1 == 'Default') {
par1 = 10*log10(length(x))
} else {
par1 <- as.numeric(par1)
}
par2 <- as.numeric(par2)
par3 <- as.numeric(par3)
par4 <- as.numeric(par4)
par5 <- as.numeric(par5)
if (par6 == 'White Noise') par6 <- 'white' else par6 <- 'ma'
par7 <- as.numeric(par7)
if (par8 != '') par8 <- as.numeric(par8)
ox <- x
if (par8 == '') {
if (par2 == 0) {
x <- log(x)
} else {
x <- (x ^ par2 - 1) / par2
}
} else {
x <- log(x,base=par8)
}
if (par3 > 0) x <- diff(x,lag=1,difference=par3)
if (par4 > 0) x <- diff(x,lag=par5,difference=par4)
bitmap(file='picts.png')
op <- par(mfrow=c(2,1))
plot(ox,type='l',main='Original Time Series',xlab='time',ylab='value')
if (par8=='') {
mytitle <- paste('Working Time Series (lambda=',par2,', d=',par3,', D=',par4,')',sep='')
mysub <- paste('(lambda=',par2,', d=',par3,', D=',par4,', CI=', par7, ', CI type=',par6,')',sep='')
} else {
mytitle <- paste('Working Time Series (base=',par8,', d=',par3,', D=',par4,')',sep='')
mysub <- paste('(base=',par8,', d=',par3,', D=',par4,', CI=', par7, ', CI type=',par6,')',sep='')
}
plot(x,type='l', main=mytitle,xlab='time',ylab='value')
par(op)
dev.off()
bitmap(file='pic1.png')
racf <- acf(x, par1, main='Autocorrelation', xlab='time lag', ylab='ACF', ci.type=par6, ci=par7, sub=mysub)
dev.off()
bitmap(file='pic2.png')
rpacf <- pacf(x,par1,main='Partial Autocorrelation',xlab='lags',ylab='PACF',sub=mysub)
dev.off()
(myacf <- c(racf$acf))
(mypacf <- c(rpacf$acf))
lengthx <- length(x)
sqrtn <- sqrt(lengthx)
load(file='createtable')
a<-table.start()
a<-table.row.start(a)
a<-table.element(a,'Autocorrelation Function',4,TRUE)
a<-table.row.end(a)
a<-table.row.start(a)
a<-table.element(a,'Time lag k',header=TRUE)
a<-table.element(a,hyperlink('basics.htm','ACF(k)','click here for more information about the Autocorrelation Function'),header=TRUE)
a<-table.element(a,'T-STAT',header=TRUE)
a<-table.element(a,'P-value',header=TRUE)
a<-table.row.end(a)
for (i in 2:(par1+1)) {
a<-table.row.start(a)
a<-table.element(a,i-1,header=TRUE)
a<-table.element(a,round(myacf[i],6))
mytstat <- myacf[i]*sqrtn
a<-table.element(a,round(mytstat,4))
a<-table.element(a,round(1-pt(abs(mytstat),lengthx),6))
a<-table.row.end(a)
}
a<-table.end(a)
table.save(a,file='mytable.tab')
a<-table.start()
a<-table.row.start(a)
a<-table.element(a,'Partial Autocorrelation Function',4,TRUE)
a<-table.row.end(a)
a<-table.row.start(a)
a<-table.element(a,'Time lag k',header=TRUE)
a<-table.element(a,hyperlink('basics.htm','PACF(k)','click here for more information about the Partial Autocorrelation Function'),header=TRUE)
a<-table.element(a,'T-STAT',header=TRUE)
a<-table.element(a,'P-value',header=TRUE)
a<-table.row.end(a)
for (i in 1:par1) {
a<-table.row.start(a)
a<-table.element(a,i,header=TRUE)
a<-table.element(a,round(mypacf[i],6))
mytstat <- mypacf[i]*sqrtn
a<-table.element(a,round(mytstat,4))
a<-table.element(a,round(1-pt(abs(mytstat),lengthx),6))
a<-table.row.end(a)
}
a<-table.end(a)
table.save(a,file='mytable1.tab')