Free Statistics

of Irreproducible Research!

Author's title

Author*The author of this computation has been verified*
R Software Modulerwasp_multipleregression.wasp
Title produced by softwareMultiple Regression
Date of computationSun, 14 Dec 2014 10:22:22 +0000
Cite this page as followsStatistical Computations at FreeStatistics.org, Office for Research Development and Education, URL https://freestatistics.org/blog/index.php?v=date/2014/Dec/14/t1418552567ksm738p20dtap05.htm/, Retrieved Thu, 16 May 2024 13:14:44 +0000
Statistical Computations at FreeStatistics.org, Office for Research Development and Education, URL https://freestatistics.org/blog/index.php?pk=267401, Retrieved Thu, 16 May 2024 13:14:44 +0000
QR Codes:

Original text written by user:
IsPrivate?No (this computation is public)
User-defined keywords
Estimated Impact90
Family? (F = Feedback message, R = changed R code, M = changed R Module, P = changed Parameters, D = changed Data)
-       [Multiple Regression] [] [2014-12-14 10:22:22] [c7f962214140f976f2c4b1bb2571d9df] [Current]
Feedback Forum

Post a new message
Dataseries X:
325.87 285.90 387.35 3.40 5.70 4.00
302.25 325.87 316.17 4.80 3.40 5.90
294.00 302.25 283.48 6.50 4.80 7.10
285.43 294.00 280.57 8.50 6.50 10.80
286.19 285.43 266.03 13.60 8.50 15.10
276.70 286.19 273.23 15.70 13.60 16.80
267.77 276.70 265.68 18.80 15.70 15.30
267.03 267.77 266.23 19.20 18.80 18.30
257.87 267.03 257.77 12.90 19.20 16.10
257.19 257.87 269.87 14.40 12.90 11.30
275.60 257.19 287.53 6.20 14.40 7.90
305.68 275.60 285.90 2.40 6.20 5.70
358.06 305.68 325.87 4.60 2.40 3.40
320.07 358.06 302.25 7.10 4.60 4.80
295.90 320.07 294.00 7.80 7.10 6.50
291.27 295.90 285.43 9.90 7.80 8.50
272.87 291.27 286.19 13.90 9.90 13.60
269.27 272.87 276.70 17.10 13.90 15.70
271.32 269.27 267.77 17.80 17.10 18.80
267.45 271.32 267.03 18.30 17.80 19.20
260.33 267.45 257.87 14.70 18.30 12.90
277.94 260.33 257.19 10.50 14.70 14.40
277.07 277.94 275.60 8.60 10.50 6.20
312.65 277.07 305.68 4.40 8.60 2.40
319.71 312.65 358.06 2.30 4.40 4.60
318.39 319.71 320.07 2.80 2.30 7.10
304.90 318.39 295.90 8.80 2.80 7.80
303.73 304.90 291.27 10.70 8.80 9.90
273.29 303.73 272.87 12.80 10.70 13.90
274.33 273.29 269.27 19.30 12.80 17.10
270.45 274.33 271.32 19.50 19.30 17.80
278.23 270.45 267.45 20.30 19.50 18.30
274.03 278.23 260.33 15.30 20.30 14.70
279.00 274.03 277.94 7.90 15.30 10.50
287.50 279.00 277.07 8.30 7.90 8.60
336.87 287.50 312.65 4.50 8.30 4.40
334.10 336.87 319.71 3.20 4.50 2.30
296.07 334.10 318.39 5.00 3.20 2.80
286.84 296.07 304.90 6.60 5.00 8.80
277.63 286.84 303.73 11.10 6.60 10.70
261.32 277.63 273.29 13.40 11.10 12.80
264.07 261.32 274.33 16.30 13.40 19.30
261.94 264.07 270.45 17.40 16.30 19.50
252.84 261.94 278.23 18.90 17.40 20.30
257.83 252.84 274.03 15.80 18.90 15.30
271.16 257.83 279.00 11.70 15.80 7.90
273.63 271.16 287.50 6.40 11.70 8.30
304.87 273.63 336.87 2.90 6.40 4.50
323.90 304.87 334.10 4.70 2.90 3.20
336.11 323.90 296.07 2.40 4.70 5.00
335.65 336.11 286.84 7.00 2.40 6.60
282.23 335.65 277.63 10.60 7.00 11.10
273.03 282.23 261.32 12.80 10.60 13.40
270.07 273.03 264.07 17.70 12.80 16.30
246.03 270.07 261.94 18.20 17.70 17.40
242.35 246.03 252.84 16.50 18.20 18.90
250.33 242.35 257.83 16.20 16.50 15.80
267.45 250.33 271.16 13.90 16.20 11.70
268.80 267.45 273.63 6.60 13.90 6.40
302.68 268.80 304.87 3.60 6.60 2.90
313.10 302.68 323.90 1.40 3.60 4.70
306.39 313.10 336.11 2.60 1.40 2.40
305.61 306.39 335.65 4.30 2.60 7.00
277.27 305.61 282.23 8.80 4.30 10.60
264.94 277.27 273.03 14.50 8.80 12.80
268.63 264.94 270.07 16.80 14.50 17.70
293.90 268.63 246.03 22.70 16.80 18.20
248.65 293.90 242.35 15.70 22.70 16.50
256.00 248.65 250.33 18.20 15.70 16.20
258.52 256.00 267.45 14.20 18.20 13.90
266.90 258.52 268.80 9.10 14.20 6.60
281.23 266.90 302.68 5.90 9.10 3.60
306.00 281.23 313.10 7.00 5.90 1.40
325.46 306.00 306.39 6.20 7.00 2.60
291.13 325.46 305.61 7.80 6.20 4.30
282.53 291.13 277.27 14.30 7.80 8.80
256.52 282.53 264.94 14.60 14.30 14.50
258.63 256.52 268.63 17.30 14.60 16.80
252.74 258.63 293.90 17.10 17.30 22.70
245.16 252.74 248.65 17.00 17.10 15.70
255.03 245.16 256.00 13.90 17.00 18.20
268.35 255.03 258.52 10.30 13.90 14.20
293.73 268.35 266.90 6.70 10.30 9.10
278.39 293.73 281.23 3.90 6.70 5.90


Summary of computational transaction
Raw Inputview raw input (R code)
Raw Outputview raw output of R engine
Computing time5 seconds
R Server'Gertrude Mary Cox' @ cox.wessa.net

\begin{tabular}{lllllllll}
\hline
Summary of computational transaction \tabularnewline
Raw Input & view raw input (R code)  \tabularnewline
Raw Output & view raw output of R engine  \tabularnewline
Computing time & 5 seconds \tabularnewline
R Server & 'Gertrude Mary Cox' @ cox.wessa.net \tabularnewline
\hline
\end{tabular}
%Source: https://freestatistics.org/blog/index.php?pk=267401&T=0

[TABLE]
[ROW][C]Summary of computational transaction[/C][/ROW]
[ROW][C]Raw Input[/C][C]view raw input (R code) [/C][/ROW]
[ROW][C]Raw Output[/C][C]view raw output of R engine [/C][/ROW]
[ROW][C]Computing time[/C][C]5 seconds[/C][/ROW]
[ROW][C]R Server[/C][C]'Gertrude Mary Cox' @ cox.wessa.net[/C][/ROW]
[/TABLE]
Source: https://freestatistics.org/blog/index.php?pk=267401&T=0

Globally Unique Identifier (entire table): ba.freestatistics.org/blog/index.php?pk=267401&T=0

As an alternative you can also use a QR Code:  

The GUIDs for individual cells are displayed in the table below:

Summary of computational transaction
Raw Inputview raw input (R code)
Raw Outputview raw output of R engine
Computing time5 seconds
R Server'Gertrude Mary Cox' @ cox.wessa.net


Multiple Linear Regression - Estimated Regression Equation
St[t] = + 153.902 + 0.260904`St-1`[t] + 0.270638`St-12`[t] -0.0722158Tt[t] -0.644101`T-1`[t] -1.25528`T-12`[t] + e[t]

\begin{tabular}{lllllllll}
\hline
Multiple Linear Regression - Estimated Regression Equation \tabularnewline
St[t] =  +  153.902 +  0.260904`St-1`[t] +  0.270638`St-12`[t] -0.0722158Tt[t] -0.644101`T-1`[t] -1.25528`T-12`[t]  + e[t] \tabularnewline
\hline
\end{tabular}
%Source: https://freestatistics.org/blog/index.php?pk=267401&T=1

[TABLE]
[ROW][C]Multiple Linear Regression - Estimated Regression Equation[/C][/ROW]
[ROW][C]St[t] =  +  153.902 +  0.260904`St-1`[t] +  0.270638`St-12`[t] -0.0722158Tt[t] -0.644101`T-1`[t] -1.25528`T-12`[t]  + e[t][/C][/ROW]
[/TABLE]
Source: https://freestatistics.org/blog/index.php?pk=267401&T=1

Globally Unique Identifier (entire table): ba.freestatistics.org/blog/index.php?pk=267401&T=1

As an alternative you can also use a QR Code:  

The GUIDs for individual cells are displayed in the table below:

Multiple Linear Regression - Estimated Regression Equation
St[t] = + 153.902 + 0.260904`St-1`[t] + 0.270638`St-12`[t] -0.0722158Tt[t] -0.644101`T-1`[t] -1.25528`T-12`[t] + e[t]


Multiple Linear Regression - Ordinary Least Squares
VariableParameterS.D.T-STATH0: parameter = 02-tail p-value1-tail p-value
(Intercept)153.90240.84793.7680.0003182990.00015915
`St-1`0.2609040.08894072.9330.004399580.00219979
`St-12`0.2706380.0888563.0460.003164810.00158241
Tt-0.07221580.689369-0.10480.9168380.458419
`T-1`-0.6441010.590652-1.090.2788540.139427
`T-12`-1.255280.662419-1.8950.0617990.0308995

\begin{tabular}{lllllllll}
\hline
Multiple Linear Regression - Ordinary Least Squares \tabularnewline
Variable & Parameter & S.D. & T-STATH0: parameter = 0 & 2-tail p-value & 1-tail p-value \tabularnewline
(Intercept) & 153.902 & 40.8479 & 3.768 & 0.000318299 & 0.00015915 \tabularnewline
`St-1` & 0.260904 & 0.0889407 & 2.933 & 0.00439958 & 0.00219979 \tabularnewline
`St-12` & 0.270638 & 0.088856 & 3.046 & 0.00316481 & 0.00158241 \tabularnewline
Tt & -0.0722158 & 0.689369 & -0.1048 & 0.916838 & 0.458419 \tabularnewline
`T-1` & -0.644101 & 0.590652 & -1.09 & 0.278854 & 0.139427 \tabularnewline
`T-12` & -1.25528 & 0.662419 & -1.895 & 0.061799 & 0.0308995 \tabularnewline
\hline
\end{tabular}
%Source: https://freestatistics.org/blog/index.php?pk=267401&T=2

[TABLE]
[ROW][C]Multiple Linear Regression - Ordinary Least Squares[/C][/ROW]
[ROW][C]Variable[/C][C]Parameter[/C][C]S.D.[/C][C]T-STATH0: parameter = 0[/C][C]2-tail p-value[/C][C]1-tail p-value[/C][/ROW]
[ROW][C](Intercept)[/C][C]153.902[/C][C]40.8479[/C][C]3.768[/C][C]0.000318299[/C][C]0.00015915[/C][/ROW]
[ROW][C]`St-1`[/C][C]0.260904[/C][C]0.0889407[/C][C]2.933[/C][C]0.00439958[/C][C]0.00219979[/C][/ROW]
[ROW][C]`St-12`[/C][C]0.270638[/C][C]0.088856[/C][C]3.046[/C][C]0.00316481[/C][C]0.00158241[/C][/ROW]
[ROW][C]Tt[/C][C]-0.0722158[/C][C]0.689369[/C][C]-0.1048[/C][C]0.916838[/C][C]0.458419[/C][/ROW]
[ROW][C]`T-1`[/C][C]-0.644101[/C][C]0.590652[/C][C]-1.09[/C][C]0.278854[/C][C]0.139427[/C][/ROW]
[ROW][C]`T-12`[/C][C]-1.25528[/C][C]0.662419[/C][C]-1.895[/C][C]0.061799[/C][C]0.0308995[/C][/ROW]
[/TABLE]
Source: https://freestatistics.org/blog/index.php?pk=267401&T=2

Globally Unique Identifier (entire table): ba.freestatistics.org/blog/index.php?pk=267401&T=2

As an alternative you can also use a QR Code:  

The GUIDs for individual cells are displayed in the table below:

Multiple Linear Regression - Ordinary Least Squares
VariableParameterS.D.T-STATH0: parameter = 02-tail p-value1-tail p-value
(Intercept)153.90240.84793.7680.0003182990.00015915
`St-1`0.2609040.08894072.9330.004399580.00219979
`St-12`0.2706380.0888563.0460.003164810.00158241
Tt-0.07221580.689369-0.10480.9168380.458419
`T-1`-0.6441010.590652-1.090.2788540.139427
`T-12`-1.255280.662419-1.8950.0617990.0308995


Multiple Linear Regression - Regression Statistics
Multiple R0.862628
R-squared0.744128
Adjusted R-squared0.727726
F-TEST (value)45.3679
F-TEST (DF numerator)5
F-TEST (DF denominator)78
p-value0
Multiple Linear Regression - Residual Statistics
Residual Standard Deviation13.1069
Sum Squared Residuals13399.6

\begin{tabular}{lllllllll}
\hline
Multiple Linear Regression - Regression Statistics \tabularnewline
Multiple R & 0.862628 \tabularnewline
R-squared & 0.744128 \tabularnewline
Adjusted R-squared & 0.727726 \tabularnewline
F-TEST (value) & 45.3679 \tabularnewline
F-TEST (DF numerator) & 5 \tabularnewline
F-TEST (DF denominator) & 78 \tabularnewline
p-value & 0 \tabularnewline
Multiple Linear Regression - Residual Statistics \tabularnewline
Residual Standard Deviation & 13.1069 \tabularnewline
Sum Squared Residuals & 13399.6 \tabularnewline
\hline
\end{tabular}
%Source: https://freestatistics.org/blog/index.php?pk=267401&T=3

[TABLE]
[ROW][C]Multiple Linear Regression - Regression Statistics[/C][/ROW]
[ROW][C]Multiple R[/C][C]0.862628[/C][/ROW]
[ROW][C]R-squared[/C][C]0.744128[/C][/ROW]
[ROW][C]Adjusted R-squared[/C][C]0.727726[/C][/ROW]
[ROW][C]F-TEST (value)[/C][C]45.3679[/C][/ROW]
[ROW][C]F-TEST (DF numerator)[/C][C]5[/C][/ROW]
[ROW][C]F-TEST (DF denominator)[/C][C]78[/C][/ROW]
[ROW][C]p-value[/C][C]0[/C][/ROW]
[ROW][C]Multiple Linear Regression - Residual Statistics[/C][/ROW]
[ROW][C]Residual Standard Deviation[/C][C]13.1069[/C][/ROW]
[ROW][C]Sum Squared Residuals[/C][C]13399.6[/C][/ROW]
[/TABLE]
Source: https://freestatistics.org/blog/index.php?pk=267401&T=3

Globally Unique Identifier (entire table): ba.freestatistics.org/blog/index.php?pk=267401&T=3

As an alternative you can also use a QR Code:  

The GUIDs for individual cells are displayed in the table below:

Multiple Linear Regression - Regression Statistics
Multiple R0.862628
R-squared0.744128
Adjusted R-squared0.727726
F-TEST (value)45.3679
F-TEST (DF numerator)5
F-TEST (DF denominator)78
p-value0
Multiple Linear Regression - Residual Statistics
Residual Standard Deviation13.1069
Sum Squared Residuals13399.6


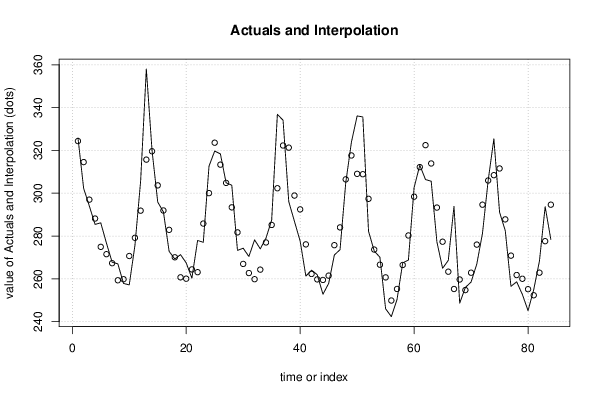
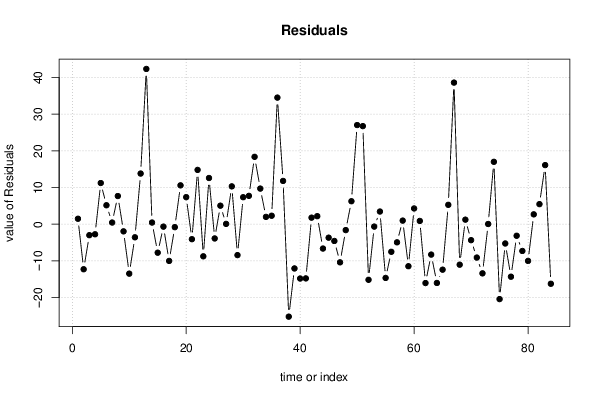
Multiple Linear Regression - Actuals, Interpolation, and Residuals
Time or IndexActualsInterpolationForecastResidualsPrediction Error
1325.87324.3871.48253
2302.25314.547-12.2971
3294297.007-3.00656
4285.43288.183-2.75261
5286.19274.95711.2326
6276.7271.5345.16628
7267.77267.3210.449137
8267.03259.3487.6816
9257.87259.825-1.95467
10257.19270.684-13.4944
11275.6279.18-3.58038
12305.68291.8613.8199
13358.06315.70142.3586
14320.07319.620.449892
15295.9303.681-7.78083
16291.27291.942-0.672332
17272.87282.897-10.0266
18269.27270.084-0.814067
19271.32260.72510.595
20267.45260.077.37953
21260.33264.428-4.09791
22277.94263.12514.8146
23277.07285.838-8.76808
24312.65300.04912.601
25319.71323.603-3.89327
26318.39313.3425.04797
27304.9304.8220.0777216
28303.73293.41210.3183
29273.29281.73-8.44017
30274.33266.9757.35495
31270.45262.7217.7286
32278.23259.84718.3825
33274.03264.3159.71481
34279277.0121.9876
35287.5285.1962.30387
36336.87302.33234.5379
37334.1322.30111.7989
38296.07321.301-25.2309
39286.84298.921-12.0812
40277.63292.456-14.8259
41261.32276.114-14.7941
42264.07262.291.77997
43261.94259.7592.18094
44252.84259.488-6.64784
45257.83261.511-3.68104
46271.16275.74-4.57989
47273.63284.04-10.4096
48304.87306.482-1.61198
49323.9317.6396.26082
50336.11309.05927.051
51335.65308.88726.7625
52282.23297.403-15.1733
53273.03273.687-0.656922
54270.07266.623.45033
55246.03260.698-14.6679
56242.35249.881-7.53079
57250.33255.279-4.94915
58267.45266.4750.975268
59268.8280.271-11.4715
60302.68298.394.28952
61313.1312.2120.888184
62306.39322.452-16.0624
63305.61313.907-8.2973
64277.27293.307-16.0374
65264.94277.352-12.4118
66268.63263.3455.28458
67293.9255.26738.6331
68248.65259.703-11.0533
69256254.7621.2382
70258.52262.879-4.35851
71266.9276.01-9.10959
72281.23294.647-13.417
73306305.9490.050883
74325.46308.43917.0213
75291.13311.571-20.4405
76282.53287.795-5.26508
77256.52270.851-14.3309
78258.63261.788-3.15812
79252.74260.047-7.30687
80245.16255.187-10.0268
81255.03252.3482.6816
82268.35262.8835.46667
83293.73277.60716.1228
84278.39294.645-16.255

\begin{tabular}{lllllllll}
\hline
Multiple Linear Regression - Actuals, Interpolation, and Residuals \tabularnewline
Time or Index & Actuals & InterpolationForecast & ResidualsPrediction Error \tabularnewline
1 & 325.87 & 324.387 & 1.48253 \tabularnewline
2 & 302.25 & 314.547 & -12.2971 \tabularnewline
3 & 294 & 297.007 & -3.00656 \tabularnewline
4 & 285.43 & 288.183 & -2.75261 \tabularnewline
5 & 286.19 & 274.957 & 11.2326 \tabularnewline
6 & 276.7 & 271.534 & 5.16628 \tabularnewline
7 & 267.77 & 267.321 & 0.449137 \tabularnewline
8 & 267.03 & 259.348 & 7.6816 \tabularnewline
9 & 257.87 & 259.825 & -1.95467 \tabularnewline
10 & 257.19 & 270.684 & -13.4944 \tabularnewline
11 & 275.6 & 279.18 & -3.58038 \tabularnewline
12 & 305.68 & 291.86 & 13.8199 \tabularnewline
13 & 358.06 & 315.701 & 42.3586 \tabularnewline
14 & 320.07 & 319.62 & 0.449892 \tabularnewline
15 & 295.9 & 303.681 & -7.78083 \tabularnewline
16 & 291.27 & 291.942 & -0.672332 \tabularnewline
17 & 272.87 & 282.897 & -10.0266 \tabularnewline
18 & 269.27 & 270.084 & -0.814067 \tabularnewline
19 & 271.32 & 260.725 & 10.595 \tabularnewline
20 & 267.45 & 260.07 & 7.37953 \tabularnewline
21 & 260.33 & 264.428 & -4.09791 \tabularnewline
22 & 277.94 & 263.125 & 14.8146 \tabularnewline
23 & 277.07 & 285.838 & -8.76808 \tabularnewline
24 & 312.65 & 300.049 & 12.601 \tabularnewline
25 & 319.71 & 323.603 & -3.89327 \tabularnewline
26 & 318.39 & 313.342 & 5.04797 \tabularnewline
27 & 304.9 & 304.822 & 0.0777216 \tabularnewline
28 & 303.73 & 293.412 & 10.3183 \tabularnewline
29 & 273.29 & 281.73 & -8.44017 \tabularnewline
30 & 274.33 & 266.975 & 7.35495 \tabularnewline
31 & 270.45 & 262.721 & 7.7286 \tabularnewline
32 & 278.23 & 259.847 & 18.3825 \tabularnewline
33 & 274.03 & 264.315 & 9.71481 \tabularnewline
34 & 279 & 277.012 & 1.9876 \tabularnewline
35 & 287.5 & 285.196 & 2.30387 \tabularnewline
36 & 336.87 & 302.332 & 34.5379 \tabularnewline
37 & 334.1 & 322.301 & 11.7989 \tabularnewline
38 & 296.07 & 321.301 & -25.2309 \tabularnewline
39 & 286.84 & 298.921 & -12.0812 \tabularnewline
40 & 277.63 & 292.456 & -14.8259 \tabularnewline
41 & 261.32 & 276.114 & -14.7941 \tabularnewline
42 & 264.07 & 262.29 & 1.77997 \tabularnewline
43 & 261.94 & 259.759 & 2.18094 \tabularnewline
44 & 252.84 & 259.488 & -6.64784 \tabularnewline
45 & 257.83 & 261.511 & -3.68104 \tabularnewline
46 & 271.16 & 275.74 & -4.57989 \tabularnewline
47 & 273.63 & 284.04 & -10.4096 \tabularnewline
48 & 304.87 & 306.482 & -1.61198 \tabularnewline
49 & 323.9 & 317.639 & 6.26082 \tabularnewline
50 & 336.11 & 309.059 & 27.051 \tabularnewline
51 & 335.65 & 308.887 & 26.7625 \tabularnewline
52 & 282.23 & 297.403 & -15.1733 \tabularnewline
53 & 273.03 & 273.687 & -0.656922 \tabularnewline
54 & 270.07 & 266.62 & 3.45033 \tabularnewline
55 & 246.03 & 260.698 & -14.6679 \tabularnewline
56 & 242.35 & 249.881 & -7.53079 \tabularnewline
57 & 250.33 & 255.279 & -4.94915 \tabularnewline
58 & 267.45 & 266.475 & 0.975268 \tabularnewline
59 & 268.8 & 280.271 & -11.4715 \tabularnewline
60 & 302.68 & 298.39 & 4.28952 \tabularnewline
61 & 313.1 & 312.212 & 0.888184 \tabularnewline
62 & 306.39 & 322.452 & -16.0624 \tabularnewline
63 & 305.61 & 313.907 & -8.2973 \tabularnewline
64 & 277.27 & 293.307 & -16.0374 \tabularnewline
65 & 264.94 & 277.352 & -12.4118 \tabularnewline
66 & 268.63 & 263.345 & 5.28458 \tabularnewline
67 & 293.9 & 255.267 & 38.6331 \tabularnewline
68 & 248.65 & 259.703 & -11.0533 \tabularnewline
69 & 256 & 254.762 & 1.2382 \tabularnewline
70 & 258.52 & 262.879 & -4.35851 \tabularnewline
71 & 266.9 & 276.01 & -9.10959 \tabularnewline
72 & 281.23 & 294.647 & -13.417 \tabularnewline
73 & 306 & 305.949 & 0.050883 \tabularnewline
74 & 325.46 & 308.439 & 17.0213 \tabularnewline
75 & 291.13 & 311.571 & -20.4405 \tabularnewline
76 & 282.53 & 287.795 & -5.26508 \tabularnewline
77 & 256.52 & 270.851 & -14.3309 \tabularnewline
78 & 258.63 & 261.788 & -3.15812 \tabularnewline
79 & 252.74 & 260.047 & -7.30687 \tabularnewline
80 & 245.16 & 255.187 & -10.0268 \tabularnewline
81 & 255.03 & 252.348 & 2.6816 \tabularnewline
82 & 268.35 & 262.883 & 5.46667 \tabularnewline
83 & 293.73 & 277.607 & 16.1228 \tabularnewline
84 & 278.39 & 294.645 & -16.255 \tabularnewline
\hline
\end{tabular}
%Source: https://freestatistics.org/blog/index.php?pk=267401&T=4

[TABLE]
[ROW][C]Multiple Linear Regression - Actuals, Interpolation, and Residuals[/C][/ROW]
[ROW][C]Time or Index[/C][C]Actuals[/C][C]InterpolationForecast[/C][C]ResidualsPrediction Error[/C][/ROW]
[ROW][C]1[/C][C]325.87[/C][C]324.387[/C][C]1.48253[/C][/ROW]
[ROW][C]2[/C][C]302.25[/C][C]314.547[/C][C]-12.2971[/C][/ROW]
[ROW][C]3[/C][C]294[/C][C]297.007[/C][C]-3.00656[/C][/ROW]
[ROW][C]4[/C][C]285.43[/C][C]288.183[/C][C]-2.75261[/C][/ROW]
[ROW][C]5[/C][C]286.19[/C][C]274.957[/C][C]11.2326[/C][/ROW]
[ROW][C]6[/C][C]276.7[/C][C]271.534[/C][C]5.16628[/C][/ROW]
[ROW][C]7[/C][C]267.77[/C][C]267.321[/C][C]0.449137[/C][/ROW]
[ROW][C]8[/C][C]267.03[/C][C]259.348[/C][C]7.6816[/C][/ROW]
[ROW][C]9[/C][C]257.87[/C][C]259.825[/C][C]-1.95467[/C][/ROW]
[ROW][C]10[/C][C]257.19[/C][C]270.684[/C][C]-13.4944[/C][/ROW]
[ROW][C]11[/C][C]275.6[/C][C]279.18[/C][C]-3.58038[/C][/ROW]
[ROW][C]12[/C][C]305.68[/C][C]291.86[/C][C]13.8199[/C][/ROW]
[ROW][C]13[/C][C]358.06[/C][C]315.701[/C][C]42.3586[/C][/ROW]
[ROW][C]14[/C][C]320.07[/C][C]319.62[/C][C]0.449892[/C][/ROW]
[ROW][C]15[/C][C]295.9[/C][C]303.681[/C][C]-7.78083[/C][/ROW]
[ROW][C]16[/C][C]291.27[/C][C]291.942[/C][C]-0.672332[/C][/ROW]
[ROW][C]17[/C][C]272.87[/C][C]282.897[/C][C]-10.0266[/C][/ROW]
[ROW][C]18[/C][C]269.27[/C][C]270.084[/C][C]-0.814067[/C][/ROW]
[ROW][C]19[/C][C]271.32[/C][C]260.725[/C][C]10.595[/C][/ROW]
[ROW][C]20[/C][C]267.45[/C][C]260.07[/C][C]7.37953[/C][/ROW]
[ROW][C]21[/C][C]260.33[/C][C]264.428[/C][C]-4.09791[/C][/ROW]
[ROW][C]22[/C][C]277.94[/C][C]263.125[/C][C]14.8146[/C][/ROW]
[ROW][C]23[/C][C]277.07[/C][C]285.838[/C][C]-8.76808[/C][/ROW]
[ROW][C]24[/C][C]312.65[/C][C]300.049[/C][C]12.601[/C][/ROW]
[ROW][C]25[/C][C]319.71[/C][C]323.603[/C][C]-3.89327[/C][/ROW]
[ROW][C]26[/C][C]318.39[/C][C]313.342[/C][C]5.04797[/C][/ROW]
[ROW][C]27[/C][C]304.9[/C][C]304.822[/C][C]0.0777216[/C][/ROW]
[ROW][C]28[/C][C]303.73[/C][C]293.412[/C][C]10.3183[/C][/ROW]
[ROW][C]29[/C][C]273.29[/C][C]281.73[/C][C]-8.44017[/C][/ROW]
[ROW][C]30[/C][C]274.33[/C][C]266.975[/C][C]7.35495[/C][/ROW]
[ROW][C]31[/C][C]270.45[/C][C]262.721[/C][C]7.7286[/C][/ROW]
[ROW][C]32[/C][C]278.23[/C][C]259.847[/C][C]18.3825[/C][/ROW]
[ROW][C]33[/C][C]274.03[/C][C]264.315[/C][C]9.71481[/C][/ROW]
[ROW][C]34[/C][C]279[/C][C]277.012[/C][C]1.9876[/C][/ROW]
[ROW][C]35[/C][C]287.5[/C][C]285.196[/C][C]2.30387[/C][/ROW]
[ROW][C]36[/C][C]336.87[/C][C]302.332[/C][C]34.5379[/C][/ROW]
[ROW][C]37[/C][C]334.1[/C][C]322.301[/C][C]11.7989[/C][/ROW]
[ROW][C]38[/C][C]296.07[/C][C]321.301[/C][C]-25.2309[/C][/ROW]
[ROW][C]39[/C][C]286.84[/C][C]298.921[/C][C]-12.0812[/C][/ROW]
[ROW][C]40[/C][C]277.63[/C][C]292.456[/C][C]-14.8259[/C][/ROW]
[ROW][C]41[/C][C]261.32[/C][C]276.114[/C][C]-14.7941[/C][/ROW]
[ROW][C]42[/C][C]264.07[/C][C]262.29[/C][C]1.77997[/C][/ROW]
[ROW][C]43[/C][C]261.94[/C][C]259.759[/C][C]2.18094[/C][/ROW]
[ROW][C]44[/C][C]252.84[/C][C]259.488[/C][C]-6.64784[/C][/ROW]
[ROW][C]45[/C][C]257.83[/C][C]261.511[/C][C]-3.68104[/C][/ROW]
[ROW][C]46[/C][C]271.16[/C][C]275.74[/C][C]-4.57989[/C][/ROW]
[ROW][C]47[/C][C]273.63[/C][C]284.04[/C][C]-10.4096[/C][/ROW]
[ROW][C]48[/C][C]304.87[/C][C]306.482[/C][C]-1.61198[/C][/ROW]
[ROW][C]49[/C][C]323.9[/C][C]317.639[/C][C]6.26082[/C][/ROW]
[ROW][C]50[/C][C]336.11[/C][C]309.059[/C][C]27.051[/C][/ROW]
[ROW][C]51[/C][C]335.65[/C][C]308.887[/C][C]26.7625[/C][/ROW]
[ROW][C]52[/C][C]282.23[/C][C]297.403[/C][C]-15.1733[/C][/ROW]
[ROW][C]53[/C][C]273.03[/C][C]273.687[/C][C]-0.656922[/C][/ROW]
[ROW][C]54[/C][C]270.07[/C][C]266.62[/C][C]3.45033[/C][/ROW]
[ROW][C]55[/C][C]246.03[/C][C]260.698[/C][C]-14.6679[/C][/ROW]
[ROW][C]56[/C][C]242.35[/C][C]249.881[/C][C]-7.53079[/C][/ROW]
[ROW][C]57[/C][C]250.33[/C][C]255.279[/C][C]-4.94915[/C][/ROW]
[ROW][C]58[/C][C]267.45[/C][C]266.475[/C][C]0.975268[/C][/ROW]
[ROW][C]59[/C][C]268.8[/C][C]280.271[/C][C]-11.4715[/C][/ROW]
[ROW][C]60[/C][C]302.68[/C][C]298.39[/C][C]4.28952[/C][/ROW]
[ROW][C]61[/C][C]313.1[/C][C]312.212[/C][C]0.888184[/C][/ROW]
[ROW][C]62[/C][C]306.39[/C][C]322.452[/C][C]-16.0624[/C][/ROW]
[ROW][C]63[/C][C]305.61[/C][C]313.907[/C][C]-8.2973[/C][/ROW]
[ROW][C]64[/C][C]277.27[/C][C]293.307[/C][C]-16.0374[/C][/ROW]
[ROW][C]65[/C][C]264.94[/C][C]277.352[/C][C]-12.4118[/C][/ROW]
[ROW][C]66[/C][C]268.63[/C][C]263.345[/C][C]5.28458[/C][/ROW]
[ROW][C]67[/C][C]293.9[/C][C]255.267[/C][C]38.6331[/C][/ROW]
[ROW][C]68[/C][C]248.65[/C][C]259.703[/C][C]-11.0533[/C][/ROW]
[ROW][C]69[/C][C]256[/C][C]254.762[/C][C]1.2382[/C][/ROW]
[ROW][C]70[/C][C]258.52[/C][C]262.879[/C][C]-4.35851[/C][/ROW]
[ROW][C]71[/C][C]266.9[/C][C]276.01[/C][C]-9.10959[/C][/ROW]
[ROW][C]72[/C][C]281.23[/C][C]294.647[/C][C]-13.417[/C][/ROW]
[ROW][C]73[/C][C]306[/C][C]305.949[/C][C]0.050883[/C][/ROW]
[ROW][C]74[/C][C]325.46[/C][C]308.439[/C][C]17.0213[/C][/ROW]
[ROW][C]75[/C][C]291.13[/C][C]311.571[/C][C]-20.4405[/C][/ROW]
[ROW][C]76[/C][C]282.53[/C][C]287.795[/C][C]-5.26508[/C][/ROW]
[ROW][C]77[/C][C]256.52[/C][C]270.851[/C][C]-14.3309[/C][/ROW]
[ROW][C]78[/C][C]258.63[/C][C]261.788[/C][C]-3.15812[/C][/ROW]
[ROW][C]79[/C][C]252.74[/C][C]260.047[/C][C]-7.30687[/C][/ROW]
[ROW][C]80[/C][C]245.16[/C][C]255.187[/C][C]-10.0268[/C][/ROW]
[ROW][C]81[/C][C]255.03[/C][C]252.348[/C][C]2.6816[/C][/ROW]
[ROW][C]82[/C][C]268.35[/C][C]262.883[/C][C]5.46667[/C][/ROW]
[ROW][C]83[/C][C]293.73[/C][C]277.607[/C][C]16.1228[/C][/ROW]
[ROW][C]84[/C][C]278.39[/C][C]294.645[/C][C]-16.255[/C][/ROW]
[/TABLE]
Source: https://freestatistics.org/blog/index.php?pk=267401&T=4

Globally Unique Identifier (entire table): ba.freestatistics.org/blog/index.php?pk=267401&T=4

As an alternative you can also use a QR Code:  

The GUIDs for individual cells are displayed in the table below:

Multiple Linear Regression - Actuals, Interpolation, and Residuals
Time or IndexActualsInterpolationForecastResidualsPrediction Error
1325.87324.3871.48253
2302.25314.547-12.2971
3294297.007-3.00656
4285.43288.183-2.75261
5286.19274.95711.2326
6276.7271.5345.16628
7267.77267.3210.449137
8267.03259.3487.6816
9257.87259.825-1.95467
10257.19270.684-13.4944
11275.6279.18-3.58038
12305.68291.8613.8199
13358.06315.70142.3586
14320.07319.620.449892
15295.9303.681-7.78083
16291.27291.942-0.672332
17272.87282.897-10.0266
18269.27270.084-0.814067
19271.32260.72510.595
20267.45260.077.37953
21260.33264.428-4.09791
22277.94263.12514.8146
23277.07285.838-8.76808
24312.65300.04912.601
25319.71323.603-3.89327
26318.39313.3425.04797
27304.9304.8220.0777216
28303.73293.41210.3183
29273.29281.73-8.44017
30274.33266.9757.35495
31270.45262.7217.7286
32278.23259.84718.3825
33274.03264.3159.71481
34279277.0121.9876
35287.5285.1962.30387
36336.87302.33234.5379
37334.1322.30111.7989
38296.07321.301-25.2309
39286.84298.921-12.0812
40277.63292.456-14.8259
41261.32276.114-14.7941
42264.07262.291.77997
43261.94259.7592.18094
44252.84259.488-6.64784
45257.83261.511-3.68104
46271.16275.74-4.57989
47273.63284.04-10.4096
48304.87306.482-1.61198
49323.9317.6396.26082
50336.11309.05927.051
51335.65308.88726.7625
52282.23297.403-15.1733
53273.03273.687-0.656922
54270.07266.623.45033
55246.03260.698-14.6679
56242.35249.881-7.53079
57250.33255.279-4.94915
58267.45266.4750.975268
59268.8280.271-11.4715
60302.68298.394.28952
61313.1312.2120.888184
62306.39322.452-16.0624
63305.61313.907-8.2973
64277.27293.307-16.0374
65264.94277.352-12.4118
66268.63263.3455.28458
67293.9255.26738.6331
68248.65259.703-11.0533
69256254.7621.2382
70258.52262.879-4.35851
71266.9276.01-9.10959
72281.23294.647-13.417
73306305.9490.050883
74325.46308.43917.0213
75291.13311.571-20.4405
76282.53287.795-5.26508
77256.52270.851-14.3309
78258.63261.788-3.15812
79252.74260.047-7.30687
80245.16255.187-10.0268
81255.03252.3482.6816
82268.35262.8835.46667
83293.73277.60716.1228
84278.39294.645-16.255


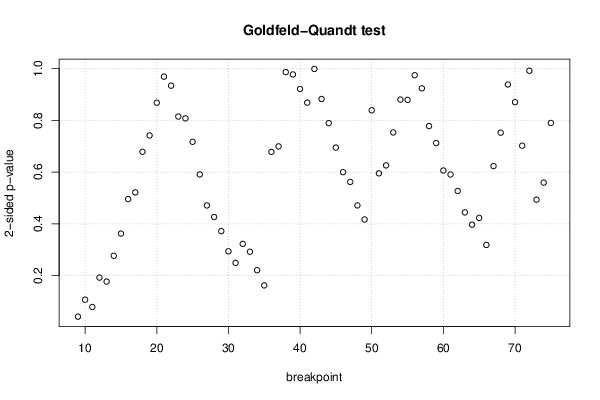
Goldfeld-Quandt test for Heteroskedasticity
p-valuesAlternative Hypothesis
breakpoint indexgreater2-sidedless
90.02093750.04187490.979063
100.0536430.1072860.946357
110.03962710.07925430.960373
120.09635170.1927030.903648
130.9113790.1772430.0886214
140.8615710.2768570.138429
150.8187880.3624240.181212
160.7521110.4957770.247889
170.7391860.5216280.260814
180.6608030.6783940.339197
190.6292950.741410.370705
200.5660710.8678570.433929
210.4842710.9685420.515729
220.4668060.9336120.533194
230.4072540.8145080.592746
240.4037790.8075580.596221
250.3584890.7169790.641511
260.2955260.5910520.704474
270.2355560.4711120.764444
280.2132870.4265740.786713
290.1859580.3719170.814042
300.1471750.2943490.852825
310.1248450.2496890.875155
320.1615210.3230410.838479
330.1463360.2926720.853664
340.1106210.2212420.889379
350.08122940.1624590.918771
360.3390350.678070.660965
370.3495980.6991960.650402
380.5069680.9860640.493032
390.5114840.9770320.488516
400.5394940.9210110.460506
410.5658790.8682410.434121
420.5008660.9982680.499134
430.4411880.8823760.558812
440.3945490.7890980.605451
450.3473780.6947560.652622
460.2998360.5996720.700164
470.2810380.5620770.718962
480.2356480.4712950.764352
490.2084680.4169360.791532
500.4193570.8387140.580643
510.7023630.5952730.297637
520.687080.625840.31292
530.6234490.7531020.376551
540.5599730.8800540.440027
550.5605810.8788380.439419
560.5129370.9741260.487063
570.461760.923520.53824
580.3888840.7777680.611116
590.3560160.7120320.643984
600.30310.6061990.6969
610.295370.590740.70463
620.2635350.527070.736465
630.2222340.4444670.777766
640.1985570.3971130.801443
650.2115990.4231980.788401
660.1594050.3188090.840595
670.6884080.6231840.311592
680.6239220.7521550.376078
690.5308650.9382710.469135
700.4350290.8700570.564971
710.3509120.7018230.649088
720.4956920.9913830.504308
730.7531930.4936130.246807
740.7202850.5594290.279715
750.6051250.789750.394875

\begin{tabular}{lllllllll}
\hline
Goldfeld-Quandt test for Heteroskedasticity \tabularnewline
p-values & Alternative Hypothesis \tabularnewline
breakpoint index & greater & 2-sided & less \tabularnewline
9 & 0.0209375 & 0.0418749 & 0.979063 \tabularnewline
10 & 0.053643 & 0.107286 & 0.946357 \tabularnewline
11 & 0.0396271 & 0.0792543 & 0.960373 \tabularnewline
12 & 0.0963517 & 0.192703 & 0.903648 \tabularnewline
13 & 0.911379 & 0.177243 & 0.0886214 \tabularnewline
14 & 0.861571 & 0.276857 & 0.138429 \tabularnewline
15 & 0.818788 & 0.362424 & 0.181212 \tabularnewline
16 & 0.752111 & 0.495777 & 0.247889 \tabularnewline
17 & 0.739186 & 0.521628 & 0.260814 \tabularnewline
18 & 0.660803 & 0.678394 & 0.339197 \tabularnewline
19 & 0.629295 & 0.74141 & 0.370705 \tabularnewline
20 & 0.566071 & 0.867857 & 0.433929 \tabularnewline
21 & 0.484271 & 0.968542 & 0.515729 \tabularnewline
22 & 0.466806 & 0.933612 & 0.533194 \tabularnewline
23 & 0.407254 & 0.814508 & 0.592746 \tabularnewline
24 & 0.403779 & 0.807558 & 0.596221 \tabularnewline
25 & 0.358489 & 0.716979 & 0.641511 \tabularnewline
26 & 0.295526 & 0.591052 & 0.704474 \tabularnewline
27 & 0.235556 & 0.471112 & 0.764444 \tabularnewline
28 & 0.213287 & 0.426574 & 0.786713 \tabularnewline
29 & 0.185958 & 0.371917 & 0.814042 \tabularnewline
30 & 0.147175 & 0.294349 & 0.852825 \tabularnewline
31 & 0.124845 & 0.249689 & 0.875155 \tabularnewline
32 & 0.161521 & 0.323041 & 0.838479 \tabularnewline
33 & 0.146336 & 0.292672 & 0.853664 \tabularnewline
34 & 0.110621 & 0.221242 & 0.889379 \tabularnewline
35 & 0.0812294 & 0.162459 & 0.918771 \tabularnewline
36 & 0.339035 & 0.67807 & 0.660965 \tabularnewline
37 & 0.349598 & 0.699196 & 0.650402 \tabularnewline
38 & 0.506968 & 0.986064 & 0.493032 \tabularnewline
39 & 0.511484 & 0.977032 & 0.488516 \tabularnewline
40 & 0.539494 & 0.921011 & 0.460506 \tabularnewline
41 & 0.565879 & 0.868241 & 0.434121 \tabularnewline
42 & 0.500866 & 0.998268 & 0.499134 \tabularnewline
43 & 0.441188 & 0.882376 & 0.558812 \tabularnewline
44 & 0.394549 & 0.789098 & 0.605451 \tabularnewline
45 & 0.347378 & 0.694756 & 0.652622 \tabularnewline
46 & 0.299836 & 0.599672 & 0.700164 \tabularnewline
47 & 0.281038 & 0.562077 & 0.718962 \tabularnewline
48 & 0.235648 & 0.471295 & 0.764352 \tabularnewline
49 & 0.208468 & 0.416936 & 0.791532 \tabularnewline
50 & 0.419357 & 0.838714 & 0.580643 \tabularnewline
51 & 0.702363 & 0.595273 & 0.297637 \tabularnewline
52 & 0.68708 & 0.62584 & 0.31292 \tabularnewline
53 & 0.623449 & 0.753102 & 0.376551 \tabularnewline
54 & 0.559973 & 0.880054 & 0.440027 \tabularnewline
55 & 0.560581 & 0.878838 & 0.439419 \tabularnewline
56 & 0.512937 & 0.974126 & 0.487063 \tabularnewline
57 & 0.46176 & 0.92352 & 0.53824 \tabularnewline
58 & 0.388884 & 0.777768 & 0.611116 \tabularnewline
59 & 0.356016 & 0.712032 & 0.643984 \tabularnewline
60 & 0.3031 & 0.606199 & 0.6969 \tabularnewline
61 & 0.29537 & 0.59074 & 0.70463 \tabularnewline
62 & 0.263535 & 0.52707 & 0.736465 \tabularnewline
63 & 0.222234 & 0.444467 & 0.777766 \tabularnewline
64 & 0.198557 & 0.397113 & 0.801443 \tabularnewline
65 & 0.211599 & 0.423198 & 0.788401 \tabularnewline
66 & 0.159405 & 0.318809 & 0.840595 \tabularnewline
67 & 0.688408 & 0.623184 & 0.311592 \tabularnewline
68 & 0.623922 & 0.752155 & 0.376078 \tabularnewline
69 & 0.530865 & 0.938271 & 0.469135 \tabularnewline
70 & 0.435029 & 0.870057 & 0.564971 \tabularnewline
71 & 0.350912 & 0.701823 & 0.649088 \tabularnewline
72 & 0.495692 & 0.991383 & 0.504308 \tabularnewline
73 & 0.753193 & 0.493613 & 0.246807 \tabularnewline
74 & 0.720285 & 0.559429 & 0.279715 \tabularnewline
75 & 0.605125 & 0.78975 & 0.394875 \tabularnewline
\hline
\end{tabular}
%Source: https://freestatistics.org/blog/index.php?pk=267401&T=5

[TABLE]
[ROW][C]Goldfeld-Quandt test for Heteroskedasticity[/C][/ROW]
[ROW][C]p-values[/C][C]Alternative Hypothesis[/C][/ROW]
[ROW][C]breakpoint index[/C][C]greater[/C][C]2-sided[/C][C]less[/C][/ROW]
[ROW][C]9[/C][C]0.0209375[/C][C]0.0418749[/C][C]0.979063[/C][/ROW]
[ROW][C]10[/C][C]0.053643[/C][C]0.107286[/C][C]0.946357[/C][/ROW]
[ROW][C]11[/C][C]0.0396271[/C][C]0.0792543[/C][C]0.960373[/C][/ROW]
[ROW][C]12[/C][C]0.0963517[/C][C]0.192703[/C][C]0.903648[/C][/ROW]
[ROW][C]13[/C][C]0.911379[/C][C]0.177243[/C][C]0.0886214[/C][/ROW]
[ROW][C]14[/C][C]0.861571[/C][C]0.276857[/C][C]0.138429[/C][/ROW]
[ROW][C]15[/C][C]0.818788[/C][C]0.362424[/C][C]0.181212[/C][/ROW]
[ROW][C]16[/C][C]0.752111[/C][C]0.495777[/C][C]0.247889[/C][/ROW]
[ROW][C]17[/C][C]0.739186[/C][C]0.521628[/C][C]0.260814[/C][/ROW]
[ROW][C]18[/C][C]0.660803[/C][C]0.678394[/C][C]0.339197[/C][/ROW]
[ROW][C]19[/C][C]0.629295[/C][C]0.74141[/C][C]0.370705[/C][/ROW]
[ROW][C]20[/C][C]0.566071[/C][C]0.867857[/C][C]0.433929[/C][/ROW]
[ROW][C]21[/C][C]0.484271[/C][C]0.968542[/C][C]0.515729[/C][/ROW]
[ROW][C]22[/C][C]0.466806[/C][C]0.933612[/C][C]0.533194[/C][/ROW]
[ROW][C]23[/C][C]0.407254[/C][C]0.814508[/C][C]0.592746[/C][/ROW]
[ROW][C]24[/C][C]0.403779[/C][C]0.807558[/C][C]0.596221[/C][/ROW]
[ROW][C]25[/C][C]0.358489[/C][C]0.716979[/C][C]0.641511[/C][/ROW]
[ROW][C]26[/C][C]0.295526[/C][C]0.591052[/C][C]0.704474[/C][/ROW]
[ROW][C]27[/C][C]0.235556[/C][C]0.471112[/C][C]0.764444[/C][/ROW]
[ROW][C]28[/C][C]0.213287[/C][C]0.426574[/C][C]0.786713[/C][/ROW]
[ROW][C]29[/C][C]0.185958[/C][C]0.371917[/C][C]0.814042[/C][/ROW]
[ROW][C]30[/C][C]0.147175[/C][C]0.294349[/C][C]0.852825[/C][/ROW]
[ROW][C]31[/C][C]0.124845[/C][C]0.249689[/C][C]0.875155[/C][/ROW]
[ROW][C]32[/C][C]0.161521[/C][C]0.323041[/C][C]0.838479[/C][/ROW]
[ROW][C]33[/C][C]0.146336[/C][C]0.292672[/C][C]0.853664[/C][/ROW]
[ROW][C]34[/C][C]0.110621[/C][C]0.221242[/C][C]0.889379[/C][/ROW]
[ROW][C]35[/C][C]0.0812294[/C][C]0.162459[/C][C]0.918771[/C][/ROW]
[ROW][C]36[/C][C]0.339035[/C][C]0.67807[/C][C]0.660965[/C][/ROW]
[ROW][C]37[/C][C]0.349598[/C][C]0.699196[/C][C]0.650402[/C][/ROW]
[ROW][C]38[/C][C]0.506968[/C][C]0.986064[/C][C]0.493032[/C][/ROW]
[ROW][C]39[/C][C]0.511484[/C][C]0.977032[/C][C]0.488516[/C][/ROW]
[ROW][C]40[/C][C]0.539494[/C][C]0.921011[/C][C]0.460506[/C][/ROW]
[ROW][C]41[/C][C]0.565879[/C][C]0.868241[/C][C]0.434121[/C][/ROW]
[ROW][C]42[/C][C]0.500866[/C][C]0.998268[/C][C]0.499134[/C][/ROW]
[ROW][C]43[/C][C]0.441188[/C][C]0.882376[/C][C]0.558812[/C][/ROW]
[ROW][C]44[/C][C]0.394549[/C][C]0.789098[/C][C]0.605451[/C][/ROW]
[ROW][C]45[/C][C]0.347378[/C][C]0.694756[/C][C]0.652622[/C][/ROW]
[ROW][C]46[/C][C]0.299836[/C][C]0.599672[/C][C]0.700164[/C][/ROW]
[ROW][C]47[/C][C]0.281038[/C][C]0.562077[/C][C]0.718962[/C][/ROW]
[ROW][C]48[/C][C]0.235648[/C][C]0.471295[/C][C]0.764352[/C][/ROW]
[ROW][C]49[/C][C]0.208468[/C][C]0.416936[/C][C]0.791532[/C][/ROW]
[ROW][C]50[/C][C]0.419357[/C][C]0.838714[/C][C]0.580643[/C][/ROW]
[ROW][C]51[/C][C]0.702363[/C][C]0.595273[/C][C]0.297637[/C][/ROW]
[ROW][C]52[/C][C]0.68708[/C][C]0.62584[/C][C]0.31292[/C][/ROW]
[ROW][C]53[/C][C]0.623449[/C][C]0.753102[/C][C]0.376551[/C][/ROW]
[ROW][C]54[/C][C]0.559973[/C][C]0.880054[/C][C]0.440027[/C][/ROW]
[ROW][C]55[/C][C]0.560581[/C][C]0.878838[/C][C]0.439419[/C][/ROW]
[ROW][C]56[/C][C]0.512937[/C][C]0.974126[/C][C]0.487063[/C][/ROW]
[ROW][C]57[/C][C]0.46176[/C][C]0.92352[/C][C]0.53824[/C][/ROW]
[ROW][C]58[/C][C]0.388884[/C][C]0.777768[/C][C]0.611116[/C][/ROW]
[ROW][C]59[/C][C]0.356016[/C][C]0.712032[/C][C]0.643984[/C][/ROW]
[ROW][C]60[/C][C]0.3031[/C][C]0.606199[/C][C]0.6969[/C][/ROW]
[ROW][C]61[/C][C]0.29537[/C][C]0.59074[/C][C]0.70463[/C][/ROW]
[ROW][C]62[/C][C]0.263535[/C][C]0.52707[/C][C]0.736465[/C][/ROW]
[ROW][C]63[/C][C]0.222234[/C][C]0.444467[/C][C]0.777766[/C][/ROW]
[ROW][C]64[/C][C]0.198557[/C][C]0.397113[/C][C]0.801443[/C][/ROW]
[ROW][C]65[/C][C]0.211599[/C][C]0.423198[/C][C]0.788401[/C][/ROW]
[ROW][C]66[/C][C]0.159405[/C][C]0.318809[/C][C]0.840595[/C][/ROW]
[ROW][C]67[/C][C]0.688408[/C][C]0.623184[/C][C]0.311592[/C][/ROW]
[ROW][C]68[/C][C]0.623922[/C][C]0.752155[/C][C]0.376078[/C][/ROW]
[ROW][C]69[/C][C]0.530865[/C][C]0.938271[/C][C]0.469135[/C][/ROW]
[ROW][C]70[/C][C]0.435029[/C][C]0.870057[/C][C]0.564971[/C][/ROW]
[ROW][C]71[/C][C]0.350912[/C][C]0.701823[/C][C]0.649088[/C][/ROW]
[ROW][C]72[/C][C]0.495692[/C][C]0.991383[/C][C]0.504308[/C][/ROW]
[ROW][C]73[/C][C]0.753193[/C][C]0.493613[/C][C]0.246807[/C][/ROW]
[ROW][C]74[/C][C]0.720285[/C][C]0.559429[/C][C]0.279715[/C][/ROW]
[ROW][C]75[/C][C]0.605125[/C][C]0.78975[/C][C]0.394875[/C][/ROW]
[/TABLE]
Source: https://freestatistics.org/blog/index.php?pk=267401&T=5

Globally Unique Identifier (entire table): ba.freestatistics.org/blog/index.php?pk=267401&T=5

As an alternative you can also use a QR Code:  

The GUIDs for individual cells are displayed in the table below:

Goldfeld-Quandt test for Heteroskedasticity
p-valuesAlternative Hypothesis
breakpoint indexgreater2-sidedless
90.02093750.04187490.979063
100.0536430.1072860.946357
110.03962710.07925430.960373
120.09635170.1927030.903648
130.9113790.1772430.0886214
140.8615710.2768570.138429
150.8187880.3624240.181212
160.7521110.4957770.247889
170.7391860.5216280.260814
180.6608030.6783940.339197
190.6292950.741410.370705
200.5660710.8678570.433929
210.4842710.9685420.515729
220.4668060.9336120.533194
230.4072540.8145080.592746
240.4037790.8075580.596221
250.3584890.7169790.641511
260.2955260.5910520.704474
270.2355560.4711120.764444
280.2132870.4265740.786713
290.1859580.3719170.814042
300.1471750.2943490.852825
310.1248450.2496890.875155
320.1615210.3230410.838479
330.1463360.2926720.853664
340.1106210.2212420.889379
350.08122940.1624590.918771
360.3390350.678070.660965
370.3495980.6991960.650402
380.5069680.9860640.493032
390.5114840.9770320.488516
400.5394940.9210110.460506
410.5658790.8682410.434121
420.5008660.9982680.499134
430.4411880.8823760.558812
440.3945490.7890980.605451
450.3473780.6947560.652622
460.2998360.5996720.700164
470.2810380.5620770.718962
480.2356480.4712950.764352
490.2084680.4169360.791532
500.4193570.8387140.580643
510.7023630.5952730.297637
520.687080.625840.31292
530.6234490.7531020.376551
540.5599730.8800540.440027
550.5605810.8788380.439419
560.5129370.9741260.487063
570.461760.923520.53824
580.3888840.7777680.611116
590.3560160.7120320.643984
600.30310.6061990.6969
610.295370.590740.70463
620.2635350.527070.736465
630.2222340.4444670.777766
640.1985570.3971130.801443
650.2115990.4231980.788401
660.1594050.3188090.840595
670.6884080.6231840.311592
680.6239220.7521550.376078
690.5308650.9382710.469135
700.4350290.8700570.564971
710.3509120.7018230.649088
720.4956920.9913830.504308
730.7531930.4936130.246807
740.7202850.5594290.279715
750.6051250.789750.394875


Meta Analysis of Goldfeld-Quandt test for Heteroskedasticity
Description# significant tests% significant testsOK/NOK
1% type I error level00OK
5% type I error level10.0149254OK
10% type I error level20.0298507OK

\begin{tabular}{lllllllll}
\hline
Meta Analysis of Goldfeld-Quandt test for Heteroskedasticity \tabularnewline
Description & # significant tests & % significant tests & OK/NOK \tabularnewline
1% type I error level & 0 & 0 & OK \tabularnewline
5% type I error level & 1 & 0.0149254 & OK \tabularnewline
10% type I error level & 2 & 0.0298507 & OK \tabularnewline
\hline
\end{tabular}
%Source: https://freestatistics.org/blog/index.php?pk=267401&T=6

[TABLE]
[ROW][C]Meta Analysis of Goldfeld-Quandt test for Heteroskedasticity[/C][/ROW]
[ROW][C]Description[/C][C]# significant tests[/C][C]% significant tests[/C][C]OK/NOK[/C][/ROW]
[ROW][C]1% type I error level[/C][C]0[/C][C]0[/C][C]OK[/C][/ROW]
[ROW][C]5% type I error level[/C][C]1[/C][C]0.0149254[/C][C]OK[/C][/ROW]
[ROW][C]10% type I error level[/C][C]2[/C][C]0.0298507[/C][C]OK[/C][/ROW]
[/TABLE]
Source: https://freestatistics.org/blog/index.php?pk=267401&T=6

Globally Unique Identifier (entire table): ba.freestatistics.org/blog/index.php?pk=267401&T=6

As an alternative you can also use a QR Code:  

The GUIDs for individual cells are displayed in the table below:

Meta Analysis of Goldfeld-Quandt test for Heteroskedasticity
Description# significant tests% significant testsOK/NOK
1% type I error level00OK
5% type I error level10.0149254OK
10% type I error level20.0298507OK


Parameters (Session):
par1 = 1 ; par2 = Do not include Seasonal Dummies ; par3 = No Linear Trend ;
Parameters (R input):
par1 = 1 ; par2 = Do not include Seasonal Dummies ; par3 = No Linear Trend ;
R code (references can be found in the software module):
par3 <- 'No Linear Trend'
par2 <- 'Include Monthly Dummies'
par1 <- '1'
library(lattice)
library(lmtest)
n25 <- 25 #minimum number of obs. for Goldfeld-Quandt test
par1 <- as.numeric(par1)
x <- t(y)
k <- length(x[1,])
n <- length(x[,1])
x1 <- cbind(x[,par1], x[,1:k!=par1])
mycolnames <- c(colnames(x)[par1], colnames(x)[1:k!=par1])
colnames(x1) <- mycolnames #colnames(x)[par1]
x <- x1
if (par3 == 'First Differences'){
x2 <- array(0, dim=c(n-1,k), dimnames=list(1:(n-1), paste('(1-B)',colnames(x),sep='')))
for (i in 1:n-1) {
for (j in 1:k) {
x2[i,j] <- x[i+1,j] - x[i,j]
}
}
x <- x2
}
if (par2 == 'Include Monthly Dummies'){
x2 <- array(0, dim=c(n,11), dimnames=list(1:n, paste('M', seq(1:11), sep ='')))
for (i in 1:11){
x2[seq(i,n,12),i] <- 1
}
x <- cbind(x, x2)
}
if (par2 == 'Include Quarterly Dummies'){
x2 <- array(0, dim=c(n,3), dimnames=list(1:n, paste('Q', seq(1:3), sep ='')))
for (i in 1:3){
x2[seq(i,n,4),i] <- 1
}
x <- cbind(x, x2)
}
k <- length(x[1,])
if (par3 == 'Linear Trend'){
x <- cbind(x, c(1:n))
colnames(x)[k+1] <- 't'
}
x
k <- length(x[1,])
df <- as.data.frame(x)
(mylm <- lm(df))
(mysum <- summary(mylm))
if (n > n25) {
kp3 <- k + 3
nmkm3 <- n - k - 3
gqarr <- array(NA, dim=c(nmkm3-kp3+1,3))
numgqtests <- 0
numsignificant1 <- 0
numsignificant5 <- 0
numsignificant10 <- 0
for (mypoint in kp3:nmkm3) {
j <- 0
numgqtests <- numgqtests + 1
for (myalt in c('greater', 'two.sided', 'less')) {
j <- j + 1
gqarr[mypoint-kp3+1,j] <- gqtest(mylm, point=mypoint, alternative=myalt)$p.value
}
if (gqarr[mypoint-kp3+1,2] < 0.01) numsignificant1 <- numsignificant1 + 1
if (gqarr[mypoint-kp3+1,2] < 0.05) numsignificant5 <- numsignificant5 + 1
if (gqarr[mypoint-kp3+1,2] < 0.10) numsignificant10 <- numsignificant10 + 1
}
gqarr
}
bitmap(file='test0.png')
plot(x[,1], type='l', main='Actuals and Interpolation', ylab='value of Actuals and Interpolation (dots)', xlab='time or index')
points(x[,1]-mysum$resid)
grid()
dev.off()
bitmap(file='test1.png')
plot(mysum$resid, type='b', pch=19, main='Residuals', ylab='value of Residuals', xlab='time or index')
grid()
dev.off()
bitmap(file='test2.png')
hist(mysum$resid, main='Residual Histogram', xlab='values of Residuals')
grid()
dev.off()
bitmap(file='test3.png')
densityplot(~mysum$resid,col='black',main='Residual Density Plot', xlab='values of Residuals')
dev.off()
bitmap(file='test4.png')
qqnorm(mysum$resid, main='Residual Normal Q-Q Plot')
qqline(mysum$resid)
grid()
dev.off()
(myerror <- as.ts(mysum$resid))
bitmap(file='test5.png')
dum <- cbind(lag(myerror,k=1),myerror)
dum
dum1 <- dum[2:length(myerror),]
dum1
z <- as.data.frame(dum1)
z
plot(z,main=paste('Residual Lag plot, lowess, and regression line'), ylab='values of Residuals', xlab='lagged values of Residuals')
lines(lowess(z))
abline(lm(z))
grid()
dev.off()
bitmap(file='test6.png')
acf(mysum$resid, lag.max=length(mysum$resid)/2, main='Residual Autocorrelation Function')
grid()
dev.off()
bitmap(file='test7.png')
pacf(mysum$resid, lag.max=length(mysum$resid)/2, main='Residual Partial Autocorrelation Function')
grid()
dev.off()
bitmap(file='test8.png')
opar <- par(mfrow = c(2,2), oma = c(0, 0, 1.1, 0))
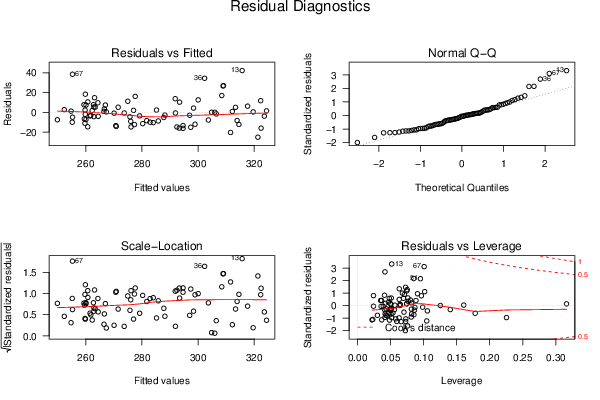
plot(mylm, las = 1, sub='Residual Diagnostics')
par(opar)
dev.off()
if (n > n25) {
bitmap(file='test9.png')
plot(kp3:nmkm3,gqarr[,2], main='Goldfeld-Quandt test',ylab='2-sided p-value',xlab='breakpoint')
grid()
dev.off()
}
load(file='createtable')
a<-table.start()
a<-table.row.start(a)
a<-table.element(a, 'Multiple Linear Regression - Estimated Regression Equation', 1, TRUE)
a<-table.row.end(a)
myeq <- colnames(x)[1]
myeq <- paste(myeq, '[t] = ', sep='')
for (i in 1:k){
if (mysum$coefficients[i,1] > 0) myeq <- paste(myeq, '+', '')
myeq <- paste(myeq, signif(mysum$coefficients[i,1],6), sep=' ')
if (rownames(mysum$coefficients)[i] != '(Intercept)') {
myeq <- paste(myeq, rownames(mysum$coefficients)[i], sep='')
if (rownames(mysum$coefficients)[i] != 't') myeq <- paste(myeq, '[t]', sep='')
}
}
myeq <- paste(myeq, ' + e[t]')
a<-table.row.start(a)
a<-table.element(a, myeq)
a<-table.row.end(a)
a<-table.end(a)
table.save(a,file='mytable1.tab')
a<-table.start()
a<-table.row.start(a)
a<-table.element(a,hyperlink('ols1.htm','Multiple Linear Regression - Ordinary Least Squares',''), 6, TRUE)
a<-table.row.end(a)
a<-table.row.start(a)
a<-table.element(a,'Variable',header=TRUE)
a<-table.element(a,'Parameter',header=TRUE)
a<-table.element(a,'S.D.',header=TRUE)
a<-table.element(a,'T-STAT
H0: parameter = 0',header=TRUE)
a<-table.element(a,'2-tail p-value',header=TRUE)
a<-table.element(a,'1-tail p-value',header=TRUE)
a<-table.row.end(a)
for (i in 1:k){
a<-table.row.start(a)
a<-table.element(a,rownames(mysum$coefficients)[i],header=TRUE)
a<-table.element(a,signif(mysum$coefficients[i,1],6))
a<-table.element(a, signif(mysum$coefficients[i,2],6))
a<-table.element(a, signif(mysum$coefficients[i,3],4))
a<-table.element(a, signif(mysum$coefficients[i,4],6))
a<-table.element(a, signif(mysum$coefficients[i,4]/2,6))
a<-table.row.end(a)
}
a<-table.end(a)
table.save(a,file='mytable2.tab')
a<-table.start()
a<-table.row.start(a)
a<-table.element(a, 'Multiple Linear Regression - Regression Statistics', 2, TRUE)
a<-table.row.end(a)
a<-table.row.start(a)
a<-table.element(a, 'Multiple R',1,TRUE)
a<-table.element(a, signif(sqrt(mysum$r.squared),6))
a<-table.row.end(a)
a<-table.row.start(a)
a<-table.element(a, 'R-squared',1,TRUE)
a<-table.element(a, signif(mysum$r.squared,6))
a<-table.row.end(a)
a<-table.row.start(a)
a<-table.element(a, 'Adjusted R-squared',1,TRUE)
a<-table.element(a, signif(mysum$adj.r.squared,6))
a<-table.row.end(a)
a<-table.row.start(a)
a<-table.element(a, 'F-TEST (value)',1,TRUE)
a<-table.element(a, signif(mysum$fstatistic[1],6))
a<-table.row.end(a)
a<-table.row.start(a)
a<-table.element(a, 'F-TEST (DF numerator)',1,TRUE)
a<-table.element(a, signif(mysum$fstatistic[2],6))
a<-table.row.end(a)
a<-table.row.start(a)
a<-table.element(a, 'F-TEST (DF denominator)',1,TRUE)
a<-table.element(a, signif(mysum$fstatistic[3],6))
a<-table.row.end(a)
a<-table.row.start(a)
a<-table.element(a, 'p-value',1,TRUE)
a<-table.element(a, signif(1-pf(mysum$fstatistic[1],mysum$fstatistic[2],mysum$fstatistic[3]),6))
a<-table.row.end(a)
a<-table.row.start(a)
a<-table.element(a, 'Multiple Linear Regression - Residual Statistics', 2, TRUE)
a<-table.row.end(a)
a<-table.row.start(a)
a<-table.element(a, 'Residual Standard Deviation',1,TRUE)
a<-table.element(a, signif(mysum$sigma,6))
a<-table.row.end(a)
a<-table.row.start(a)
a<-table.element(a, 'Sum Squared Residuals',1,TRUE)
a<-table.element(a, signif(sum(myerror*myerror),6))
a<-table.row.end(a)
a<-table.end(a)
table.save(a,file='mytable3.tab')
a<-table.start()
a<-table.row.start(a)
a<-table.element(a, 'Multiple Linear Regression - Actuals, Interpolation, and Residuals', 4, TRUE)
a<-table.row.end(a)
a<-table.row.start(a)
a<-table.element(a, 'Time or Index', 1, TRUE)
a<-table.element(a, 'Actuals', 1, TRUE)
a<-table.element(a, 'Interpolation
Forecast', 1, TRUE)
a<-table.element(a, 'Residuals
Prediction Error', 1, TRUE)
a<-table.row.end(a)
for (i in 1:n) {
a<-table.row.start(a)
a<-table.element(a,i, 1, TRUE)
a<-table.element(a,signif(x[i],6))
a<-table.element(a,signif(x[i]-mysum$resid[i],6))
a<-table.element(a,signif(mysum$resid[i],6))
a<-table.row.end(a)
}
a<-table.end(a)
table.save(a,file='mytable4.tab')
if (n > n25) {
a<-table.start()
a<-table.row.start(a)
a<-table.element(a,'Goldfeld-Quandt test for Heteroskedasticity',4,TRUE)
a<-table.row.end(a)
a<-table.row.start(a)
a<-table.element(a,'p-values',header=TRUE)
a<-table.element(a,'Alternative Hypothesis',3,header=TRUE)
a<-table.row.end(a)
a<-table.row.start(a)
a<-table.element(a,'breakpoint index',header=TRUE)
a<-table.element(a,'greater',header=TRUE)
a<-table.element(a,'2-sided',header=TRUE)
a<-table.element(a,'less',header=TRUE)
a<-table.row.end(a)
for (mypoint in kp3:nmkm3) {
a<-table.row.start(a)
a<-table.element(a,mypoint,header=TRUE)
a<-table.element(a,signif(gqarr[mypoint-kp3+1,1],6))
a<-table.element(a,signif(gqarr[mypoint-kp3+1,2],6))
a<-table.element(a,signif(gqarr[mypoint-kp3+1,3],6))
a<-table.row.end(a)
}
a<-table.end(a)
table.save(a,file='mytable5.tab')
a<-table.start()
a<-table.row.start(a)
a<-table.element(a,'Meta Analysis of Goldfeld-Quandt test for Heteroskedasticity',4,TRUE)
a<-table.row.end(a)
a<-table.row.start(a)
a<-table.element(a,'Description',header=TRUE)
a<-table.element(a,'# significant tests',header=TRUE)
a<-table.element(a,'% significant tests',header=TRUE)
a<-table.element(a,'OK/NOK',header=TRUE)
a<-table.row.end(a)
a<-table.row.start(a)
a<-table.element(a,'1% type I error level',header=TRUE)
a<-table.element(a,signif(numsignificant1,6))
a<-table.element(a,signif(numsignificant1/numgqtests,6))
if (numsignificant1/numgqtests < 0.01) dum <- 'OK' else dum <- 'NOK'
a<-table.element(a,dum)
a<-table.row.end(a)
a<-table.row.start(a)
a<-table.element(a,'5% type I error level',header=TRUE)
a<-table.element(a,signif(numsignificant5,6))
a<-table.element(a,signif(numsignificant5/numgqtests,6))
if (numsignificant5/numgqtests < 0.05) dum <- 'OK' else dum <- 'NOK'
a<-table.element(a,dum)
a<-table.row.end(a)
a<-table.row.start(a)
a<-table.element(a,'10% type I error level',header=TRUE)
a<-table.element(a,signif(numsignificant10,6))
a<-table.element(a,signif(numsignificant10/numgqtests,6))
if (numsignificant10/numgqtests < 0.1) dum <- 'OK' else dum <- 'NOK'
a<-table.element(a,dum)
a<-table.row.end(a)
a<-table.end(a)
table.save(a,file='mytable6.tab')
}