Free Statistics
of Irreproducible Research!
Description of Statistical Computation | |||||||||||||||||||||||||||||||||||||||||||||||||||||||||||||||||||||||||||||||||||||||||||||||||||||||||||||||||||||||||
|---|---|---|---|---|---|---|---|---|---|---|---|---|---|---|---|---|---|---|---|---|---|---|---|---|---|---|---|---|---|---|---|---|---|---|---|---|---|---|---|---|---|---|---|---|---|---|---|---|---|---|---|---|---|---|---|---|---|---|---|---|---|---|---|---|---|---|---|---|---|---|---|---|---|---|---|---|---|---|---|---|---|---|---|---|---|---|---|---|---|---|---|---|---|---|---|---|---|---|---|---|---|---|---|---|---|---|---|---|---|---|---|---|---|---|---|---|---|---|---|---|---|
| Author's title | |||||||||||||||||||||||||||||||||||||||||||||||||||||||||||||||||||||||||||||||||||||||||||||||||||||||||||||||||||||||||
| Author | *The author of this computation has been verified* | ||||||||||||||||||||||||||||||||||||||||||||||||||||||||||||||||||||||||||||||||||||||||||||||||||||||||||||||||||||||||
| R Software Module | rwasp_chi_squared_tests.wasp | ||||||||||||||||||||||||||||||||||||||||||||||||||||||||||||||||||||||||||||||||||||||||||||||||||||||||||||||||||||||||
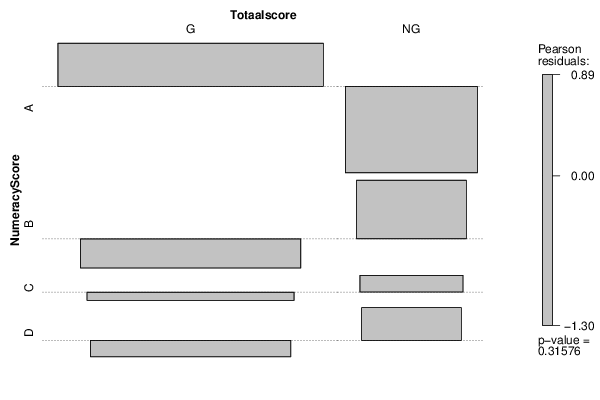
| Title produced by software | Chi-Squared Test, McNemar Test, and Fisher Exact Test | ||||||||||||||||||||||||||||||||||||||||||||||||||||||||||||||||||||||||||||||||||||||||||||||||||||||||||||||||||||||||
| Date of computation | Sun, 14 Dec 2014 13:38:33 +0000 | ||||||||||||||||||||||||||||||||||||||||||||||||||||||||||||||||||||||||||||||||||||||||||||||||||||||||||||||||||||||||
| Cite this page as follows | Statistical Computations at FreeStatistics.org, Office for Research Development and Education, URL https://freestatistics.org/blog/index.php?v=date/2014/Dec/14/t1418564322pu0zb1hlupk8vya.htm/, Retrieved Thu, 16 May 2024 13:04:16 +0000 | ||||||||||||||||||||||||||||||||||||||||||||||||||||||||||||||||||||||||||||||||||||||||||||||||||||||||||||||||||||||||
| Statistical Computations at FreeStatistics.org, Office for Research Development and Education, URL https://freestatistics.org/blog/index.php?pk=267571, Retrieved Thu, 16 May 2024 13:04:16 +0000 | |||||||||||||||||||||||||||||||||||||||||||||||||||||||||||||||||||||||||||||||||||||||||||||||||||||||||||||||||||||||||
| QR Codes: | |||||||||||||||||||||||||||||||||||||||||||||||||||||||||||||||||||||||||||||||||||||||||||||||||||||||||||||||||||||||||
|
| |||||||||||||||||||||||||||||||||||||||||||||||||||||||||||||||||||||||||||||||||||||||||||||||||||||||||||||||||||||||||
| Original text written by user: | |||||||||||||||||||||||||||||||||||||||||||||||||||||||||||||||||||||||||||||||||||||||||||||||||||||||||||||||||||||||||
| IsPrivate? | No (this computation is public) | ||||||||||||||||||||||||||||||||||||||||||||||||||||||||||||||||||||||||||||||||||||||||||||||||||||||||||||||||||||||||
| User-defined keywords | |||||||||||||||||||||||||||||||||||||||||||||||||||||||||||||||||||||||||||||||||||||||||||||||||||||||||||||||||||||||||
| Estimated Impact | 136 | ||||||||||||||||||||||||||||||||||||||||||||||||||||||||||||||||||||||||||||||||||||||||||||||||||||||||||||||||||||||||
Tree of Dependent Computations | |||||||||||||||||||||||||||||||||||||||||||||||||||||||||||||||||||||||||||||||||||||||||||||||||||||||||||||||||||||||||
| Family? (F = Feedback message, R = changed R code, M = changed R Module, P = changed Parameters, D = changed Data) | |||||||||||||||||||||||||||||||||||||||||||||||||||||||||||||||||||||||||||||||||||||||||||||||||||||||||||||||||||||||||
| - [Chi-Squared Test, McNemar Test, and Fisher Exact Test] [] [2014-11-02 12:08:26] [d253a55552bf9917a397def3be261e30] - R PD [Chi-Squared Test, McNemar Test, and Fisher Exact Test] [] [2014-11-05 13:14:01] [d253a55552bf9917a397def3be261e30] - D [Chi-Squared Test, McNemar Test, and Fisher Exact Test] [] [2014-12-13 15:26:54] [d253a55552bf9917a397def3be261e30] - PD [Chi-Squared Test, McNemar Test, and Fisher Exact Test] [] [2014-12-13 16:10:39] [d253a55552bf9917a397def3be261e30] - D [Chi-Squared Test, McNemar Test, and Fisher Exact Test] [] [2014-12-13 16:28:37] [d253a55552bf9917a397def3be261e30] - M D [Chi-Squared Test, McNemar Test, and Fisher Exact Test] [] [2014-12-13 16:34:18] [d253a55552bf9917a397def3be261e30] - M D [Chi-Squared Test, McNemar Test, and Fisher Exact Test] [] [2014-12-13 17:39:29] [d253a55552bf9917a397def3be261e30] - PD [Chi-Squared Test, McNemar Test, and Fisher Exact Test] [] [2014-12-14 13:26:12] [d253a55552bf9917a397def3be261e30] - PD [Chi-Squared Test, McNemar Test, and Fisher Exact Test] [] [2014-12-14 13:38:33] [940a3d9bc049bdd1effc6e8b1116301d] [Current] - PD [Chi-Squared Test, McNemar Test, and Fisher Exact Test] [] [2014-12-14 14:05:32] [d253a55552bf9917a397def3be261e30] - PD [Chi-Squared Test, McNemar Test, and Fisher Exact Test] [] [2014-12-14 14:14:43] [d253a55552bf9917a397def3be261e30] - D [Chi-Squared Test, McNemar Test, and Fisher Exact Test] [] [2014-12-14 14:27:03] [d253a55552bf9917a397def3be261e30] - D [Chi-Squared Test, McNemar Test, and Fisher Exact Test] [] [2014-12-14 14:33:41] [d253a55552bf9917a397def3be261e30] | |||||||||||||||||||||||||||||||||||||||||||||||||||||||||||||||||||||||||||||||||||||||||||||||||||||||||||||||||||||||||
| Feedback Forum | |||||||||||||||||||||||||||||||||||||||||||||||||||||||||||||||||||||||||||||||||||||||||||||||||||||||||||||||||||||||||
Post a new message | |||||||||||||||||||||||||||||||||||||||||||||||||||||||||||||||||||||||||||||||||||||||||||||||||||||||||||||||||||||||||
Dataset | |||||||||||||||||||||||||||||||||||||||||||||||||||||||||||||||||||||||||||||||||||||||||||||||||||||||||||||||||||||||||
| Dataseries X: | |||||||||||||||||||||||||||||||||||||||||||||||||||||||||||||||||||||||||||||||||||||||||||||||||||||||||||||||||||||||||
"B" "G" "A" "NG" "B" "G" "B" "G" "C" "NG" "A" "NG" "D" "G" "B" "G" "B" "G" "B" "G" "C" "NG" "B" "G" "D" "NG" "B" "G" "C" "G" "C" "NG" "D" "G" "B" "G" "B" "NG" "B" "NG" "D" "G" "D" "NG" "A" "G" "B" "G" "C" "G" "A" "G" "D" "G" "A" "G" "B" "G" "A" "NG" "D" "G" "D" "NG" "C" "G" "A" "NG" "A" "NG" "C" "NG" "A" "G" "B" "G" "D" "G" "D" "G" "B" "NG" "A" "G" "A" "NG" "A" "G" "A" "G" "A" "G" "C" "G" "A" "G" "D" "G" "C" "NG" "D" "G" "A" "G" "A" "G" "C" "NG" "C" "G" "B" "G" "C" "G" "A" "G" "B" "NG" "D" "G" "D" "NG" "A" "G" "A" "NG" "A" "G" "B" "NG" "C" "G" "C" "NG" "B" "NG" "C" "G" "C" "G" "C" "G" "C" "G" "A" "G" "C" "G" "B" "NG" "A" "G" "A" "NG" "D" "G" "A" "G" "D" "G" "A" "G" "B" "G" "D" "NG" "A" "NG" "B" "G" "D" "G" "B" "G" "B" "NG" "D" "G" "A" "G" "C" "G" "B" "G" "A" "NG" "C" "G" "B" "G" "B" "NG" "B" "NG" "B" "NG" "C" "NG" "B" "NG" "A" "NG" "A" "G" "A" "G" "B" "NG" "B" "G" "C" "G" "D" "NG" "C" "NG" "B" "G" "D" "NG" "D" "G" "D" "NG" "C" "NG" "C" "NG" "C" "G" "C" "G" "A" "NG" "B" "G" "B" "G" "A" "G" "A" "G" "C" "G" "A" "G" "A" "G" "A" "G" "C" "G" "C" "G" "A" "G" "C" "G" "D" "G" "B" "G" "D" "G" "A" "G" "A" "G" "A" "G" "C" "G" "C" "G" "D" "G" "C" "G" "C" "G" "A" "G" "B" "NG" "B" "G" "C" "G" "B" "G" "B" "G" "D" "G" "A" "G" "D" "G" "A" "G" "B" "G" "D" "G" "D" "G" "D" "G" "D" "G" "A" "G" "C" "NG" "A" "G" "A" "G" "C" "G" "A" "G" "B" "G" "A" "G" "A" "G" "A" "G" "C" "G" "A" "G" "B" "G" "C" "G" "A" "G" "A" "G" "B" "G" "A" "G" "A" "G" "B" "G" "B" "G" "A" "G" "B" "G" "A" "G" "A" "G" "A" "G" "B" "G" "B" "G" "D" "G" "B" "G" "B" "NG" "A" "G" "C" "G" "A" "G" "C" "G" "C" "G" "A" "G" "A" "G" "A" "G" "A" "G" "C" "G" "A" "G" "D" "G" "C" "NG" "D" "G" "C" "G" "A" "G" "A" "G" "D" "G" "D" "G" "B" "G" "A" "G" "B" "G" "C" "G" "B" "G" "B" "G" "B" "G" "D" "NG" "A" "G" "D" "G" "D" "G" "C" "G" "A" "G" "A" "G" "D" "G" "C" "G" "A" "G" "D" "G" "C" "G" "D" "G" "A" "G" "A" "G" "A" "G" "C" "G" "D" "NG" "A" "G" "D" "G" "C" "G" "B" "G" "D" "G" "A" "G" "A" "G" "C" "G" "D" "G" "B" "G" "A" "G" "B" "G" "D" "NG" "A" "NG" "B" "G" "D" "G" "D" "G" "D" "G" "A" "G" "C" "G" "B" "G" "A" "G" "A" "G" "A" "G" "A" "G" "C" "G" "B" "G" "B" "G" "C" "G" "A" "G" "C" "G" "A" "G" "D" "G" "A" "G" "A" "G" "B" "NG" "B" "NG" "C" "G" "D" "NG" "B" "G" "A" "G" "D" "NG" "B" "G" "C" "G" "A" "G" "C" "G" "D" "G" "A" "G" "A" "G" "D" "G" "A" "G" "D" "G" "A" "G" "B" "G" "A" "G" "B" "G" "A" "NG" | |||||||||||||||||||||||||||||||||||||||||||||||||||||||||||||||||||||||||||||||||||||||||||||||||||||||||||||||||||||||||
Tables (Output of Computation) | |||||||||||||||||||||||||||||||||||||||||||||||||||||||||||||||||||||||||||||||||||||||||||||||||||||||||||||||||||||||||
| |||||||||||||||||||||||||||||||||||||||||||||||||||||||||||||||||||||||||||||||||||||||||||||||||||||||||||||||||||||||||
Figures (Output of Computation) | |||||||||||||||||||||||||||||||||||||||||||||||||||||||||||||||||||||||||||||||||||||||||||||||||||||||||||||||||||||||||
Input Parameters & R Code | |||||||||||||||||||||||||||||||||||||||||||||||||||||||||||||||||||||||||||||||||||||||||||||||||||||||||||||||||||||||||
| Parameters (Session): | |||||||||||||||||||||||||||||||||||||||||||||||||||||||||||||||||||||||||||||||||||||||||||||||||||||||||||||||||||||||||
| par1 = 1 ; par2 = 2 ; par3 = Exact Pearson Chi-Squared by Simulation ; | |||||||||||||||||||||||||||||||||||||||||||||||||||||||||||||||||||||||||||||||||||||||||||||||||||||||||||||||||||||||||
| Parameters (R input): | |||||||||||||||||||||||||||||||||||||||||||||||||||||||||||||||||||||||||||||||||||||||||||||||||||||||||||||||||||||||||
| par1 = 1 ; par2 = 2 ; par3 = Exact Pearson Chi-Squared by Simulation ; | |||||||||||||||||||||||||||||||||||||||||||||||||||||||||||||||||||||||||||||||||||||||||||||||||||||||||||||||||||||||||
| R code (references can be found in the software module): | |||||||||||||||||||||||||||||||||||||||||||||||||||||||||||||||||||||||||||||||||||||||||||||||||||||||||||||||||||||||||
library(vcd) | |||||||||||||||||||||||||||||||||||||||||||||||||||||||||||||||||||||||||||||||||||||||||||||||||||||||||||||||||||||||||