Free Statistics

of Irreproducible Research!

Author's title

Author*The author of this computation has been verified*
R Software Modulerwasp_chi_squared_tests.wasp
Title produced by softwareChi-Squared Test, McNemar Test, and Fisher Exact Test
Date of computationSun, 14 Dec 2014 14:19:09 +0000
Cite this page as followsStatistical Computations at FreeStatistics.org, Office for Research Development and Education, URL https://freestatistics.org/blog/index.php?v=date/2014/Dec/14/t1418566770s81lexp0kfui1zo.htm/, Retrieved Thu, 16 May 2024 13:26:30 +0000
Statistical Computations at FreeStatistics.org, Office for Research Development and Education, URL https://freestatistics.org/blog/index.php?pk=267611, Retrieved Thu, 16 May 2024 13:26:30 +0000
QR Codes:

Original text written by user:
IsPrivate?No (this computation is public)
User-defined keywords
Estimated Impact104
Family? (F = Feedback message, R = changed R code, M = changed R Module, P = changed Parameters, D = changed Data)
-       [Chi-Squared Test, McNemar Test, and Fisher Exact Test] [] [2014-12-14 14:19:09] [6baf0af87d9d8aa2cb91b54f39a0a5b0] [Current]
Feedback Forum

Post a new message
Dataseries X:
26 50 0 21 13 12 13 13 21
57 62 1 22 8 8 13 16 22
37 54 0 21 14 11 11 11 22
67 71 1 21 16 13 14 10 18
43 54 1 21 14 11 15 9 23
52 65 1 21 13 10 14 8 12
52 73 0 21 15 7 11 26 20
43 52 1 23 13 10 13 10 22
84 84 1 22 20 15 16 10 21
67 42 1 25 17 12 14 8 19
49 66 1 21 15 12 14 13 22
70 65 1 23 16 10 15 11 15
52 78 1 22 12 10 15 8 20
58 73 0 21 17 14 13 12 19
68 75 0 21 11 6 14 24 18
62 72 0 25 16 12 11 21 15
43 66 1 21 16 14 12 5 20
56 70 0 21 15 11 14 14 21
56 61 1 20 13 8 13 11 21
74 81 0 24 14 12 12 9 15
65 71 1 23 19 15 15 8 16
63 69 1 21 16 13 15 17 23
58 71 0 24 17 11 14 18 21
57 72 1 23 10 12 14 16 18
63 68 1 21 15 7 12 23 25
53 70 1 22 14 11 12 9 9
57 68 1 20 14 7 12 14 30
51 61 0 18 16 12 15 13 20
64 67 1 21 15 12 14 10 23
53 76 0 22 17 13 16 8 16
29 70 0 22 14 9 12 10 16
54 60 0 21 16 11 12 19 19
58 72 1 21 15 12 14 11 25
43 69 1 25 16 15 16 16 18
51 71 1 22 16 12 15 12 23
53 62 1 22 10 6 12 11 21
54 70 0 20 8 5 14 11 10
56 64 1 21 17 13 13 10 14
61 58 1 21 14 11 14 13 22
47 76 0 21 10 6 16 14 26
39 52 1 22 14 12 12 8 23
48 59 1 21 12 10 14 11 23
50 68 1 24 16 6 15 11 24
35 76 1 22 16 12 13 13 24
30 65 1 22 16 11 16 15 18
68 67 0 21 8 6 16 15 23
49 59 1 22 16 12 12 16 15
61 69 1 19 15 12 12 12 19
67 76 0 22 8 8 16 12 16
47 63 1 23 13 10 12 17 25
56 75 1 20 14 11 15 14 23
50 63 1 20 13 7 12 15 17
43 60 1 23 16 12 13 12 19
67 73 1 20 19 13 12 13 21
62 63 1 23 19 14 14 7 18
57 70 1 21 14 12 14 8 27
41 75 0 22 15 6 11 16 21
54 66 1 21 13 14 10 20 13
45 63 0 21 10 10 12 14 8
48 63 1 19 16 12 11 10 29
61 64 1 22 15 11 16 16 28
56 70 0 21 11 10 14 11 23
41 75 0 21 9 7 14 26 21
43 61 1 21 16 12 15 9 19
53 60 0 21 12 7 15 15 19
44 62 1 21 12 12 14 12 20
66 73 0 21 14 12 13 21 18
58 61 1 22 14 10 11 20 19
46 66 1 22 13 10 16 20 17
37 64 0 18 15 12 12 10 19
51 59 0 21 17 12 15 15 25
51 64 0 23 14 12 14 10 19
56 60 0 19 11 8 15 16 22
66 56 1 19 9 10 14 9 23
37 78 0 21 7 5 13 17 14
59 53 1 21 13 10 6 10 28
42 67 0 21 15 10 12 19 16
38 59 1 21 12 12 12 13 24
66 66 0 20 15 11 14 8 20
34 68 0 19 14 9 14 11 12
53 71 1 21 16 12 15 9 24
49 66 0 19 14 11 11 12 22
55 73 0 19 13 10 13 10 12
49 72 0 19 16 12 14 9 22
59 71 1 20 13 10 16 14 20
40 59 0 19 16 9 13 14 10
58 64 1 19 16 11 14 10 23
60 66 1 19 16 12 16 8 17
63 78 0 20 10 7 11 13 22
56 68 0 19 12 11 13 9 24
54 73 0 18 12 12 13 14 18
52 62 1 19 12 6 15 8 21
34 65 1 21 12 9 12 16 20
69 68 1 18 19 15 13 14 20
32 65 0 18 14 10 12 14 22
48 60 1 19 13 11 14 8 19
67 71 0 21 16 12 14 11 20
58 65 1 20 15 12 16 11 26
57 68 1 24 12 12 15 13 23
42 64 1 22 8 11 14 12 24
64 74 1 21 10 9 13 13 21
58 69 1 21 16 11 14 9 21
66 76 0 19 16 12 15 10 19
26 68 1 19 10 12 14 12 8
61 72 1 20 18 14 12 11 17
52 67 1 18 12 8 7 13 20
51 63 0 19 16 10 12 17 11
55 59 0 19 10 9 15 15 8
50 73 0 20 14 10 12 15 15
60 66 0 21 12 9 13 14 18
56 62 0 18 11 10 11 10 18
63 69 0 19 15 12 14 15 19
61 66 1 19 7 11 13 14 19


Summary of computational transaction
Raw Inputview raw input (R code)
Raw Outputview raw output of R engine
Computing time2 seconds
R Server'Sir Ronald Aylmer Fisher' @ fisher.wessa.net

\begin{tabular}{lllllllll}
\hline
Summary of computational transaction \tabularnewline
Raw Input & view raw input (R code)  \tabularnewline
Raw Output & view raw output of R engine  \tabularnewline
Computing time & 2 seconds \tabularnewline
R Server & 'Sir Ronald Aylmer Fisher' @ fisher.wessa.net \tabularnewline
\hline
\end{tabular}
%Source: https://freestatistics.org/blog/index.php?pk=267611&T=0

[TABLE]
[ROW][C]Summary of computational transaction[/C][/ROW]
[ROW][C]Raw Input[/C][C]view raw input (R code) [/C][/ROW]
[ROW][C]Raw Output[/C][C]view raw output of R engine [/C][/ROW]
[ROW][C]Computing time[/C][C]2 seconds[/C][/ROW]
[ROW][C]R Server[/C][C]'Sir Ronald Aylmer Fisher' @ fisher.wessa.net[/C][/ROW]
[/TABLE]
Source: https://freestatistics.org/blog/index.php?pk=267611&T=0

Globally Unique Identifier (entire table): ba.freestatistics.org/blog/index.php?pk=267611&T=0

As an alternative you can also use a QR Code:  

The GUIDs for individual cells are displayed in the table below:

Summary of computational transaction
Raw Inputview raw input (R code)
Raw Outputview raw output of R engine
Computing time2 seconds
R Server'Sir Ronald Aylmer Fisher' @ fisher.wessa.net


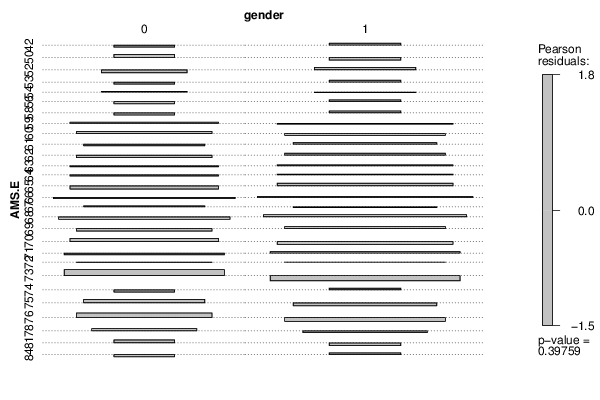
Tabulation of Results
AMS.E x gender
01
4201
5010
5202
5301
5411
5601
5801
5933
6032
6113
6214
6324
6424
6515
6636
6722
6826
6914
7042
7125
7223
7361
7401
7531
7641
7821
8110
8401

\begin{tabular}{lllllllll}
\hline
Tabulation of Results \tabularnewline
AMS.E  x  gender \tabularnewline
  & 0 & 1 \tabularnewline
42 & 0 & 1 \tabularnewline
50 & 1 & 0 \tabularnewline
52 & 0 & 2 \tabularnewline
53 & 0 & 1 \tabularnewline
54 & 1 & 1 \tabularnewline
56 & 0 & 1 \tabularnewline
58 & 0 & 1 \tabularnewline
59 & 3 & 3 \tabularnewline
60 & 3 & 2 \tabularnewline
61 & 1 & 3 \tabularnewline
62 & 1 & 4 \tabularnewline
63 & 2 & 4 \tabularnewline
64 & 2 & 4 \tabularnewline
65 & 1 & 5 \tabularnewline
66 & 3 & 6 \tabularnewline
67 & 2 & 2 \tabularnewline
68 & 2 & 6 \tabularnewline
69 & 1 & 4 \tabularnewline
70 & 4 & 2 \tabularnewline
71 & 2 & 5 \tabularnewline
72 & 2 & 3 \tabularnewline
73 & 6 & 1 \tabularnewline
74 & 0 & 1 \tabularnewline
75 & 3 & 1 \tabularnewline
76 & 4 & 1 \tabularnewline
78 & 2 & 1 \tabularnewline
81 & 1 & 0 \tabularnewline
84 & 0 & 1 \tabularnewline
\hline
\end{tabular}
%Source: https://freestatistics.org/blog/index.php?pk=267611&T=1

[TABLE]
[ROW][C]Tabulation of Results[/C][/ROW]
[ROW][C]AMS.E  x  gender[/C][/ROW]
[ROW][C] [/C][C]0[/C][C]1[/C][/ROW]
[C]42[/C][C]0[/C][C]1[/C][/ROW]
[C]50[/C][C]1[/C][C]0[/C][/ROW]
[C]52[/C][C]0[/C][C]2[/C][/ROW]
[C]53[/C][C]0[/C][C]1[/C][/ROW]
[C]54[/C][C]1[/C][C]1[/C][/ROW]
[C]56[/C][C]0[/C][C]1[/C][/ROW]
[C]58[/C][C]0[/C][C]1[/C][/ROW]
[C]59[/C][C]3[/C][C]3[/C][/ROW]
[C]60[/C][C]3[/C][C]2[/C][/ROW]
[C]61[/C][C]1[/C][C]3[/C][/ROW]
[C]62[/C][C]1[/C][C]4[/C][/ROW]
[C]63[/C][C]2[/C][C]4[/C][/ROW]
[C]64[/C][C]2[/C][C]4[/C][/ROW]
[C]65[/C][C]1[/C][C]5[/C][/ROW]
[C]66[/C][C]3[/C][C]6[/C][/ROW]
[C]67[/C][C]2[/C][C]2[/C][/ROW]
[C]68[/C][C]2[/C][C]6[/C][/ROW]
[C]69[/C][C]1[/C][C]4[/C][/ROW]
[C]70[/C][C]4[/C][C]2[/C][/ROW]
[C]71[/C][C]2[/C][C]5[/C][/ROW]
[C]72[/C][C]2[/C][C]3[/C][/ROW]
[C]73[/C][C]6[/C][C]1[/C][/ROW]
[C]74[/C][C]0[/C][C]1[/C][/ROW]
[C]75[/C][C]3[/C][C]1[/C][/ROW]
[C]76[/C][C]4[/C][C]1[/C][/ROW]
[C]78[/C][C]2[/C][C]1[/C][/ROW]
[C]81[/C][C]1[/C][C]0[/C][/ROW]
[C]84[/C][C]0[/C][C]1[/C][/ROW]
[/TABLE]
Source: https://freestatistics.org/blog/index.php?pk=267611&T=1

Globally Unique Identifier (entire table): ba.freestatistics.org/blog/index.php?pk=267611&T=1

As an alternative you can also use a QR Code:  

The GUIDs for individual cells are displayed in the table below:

Tabulation of Results
AMS.E x gender
01
4201
5010
5202
5301
5411
5601
5801
5933
6032
6113
6214
6324
6424
6515
6636
6722
6826
6914
7042
7125
7223
7361
7401
7531
7641
7821
8110
8401


Tabulation of Expected Results
AMS.E x gender
01
420.420.58
500.420.58
520.831.17
530.420.58
540.831.17
560.420.58
580.420.58
592.53.5
602.082.92
611.662.34
622.082.92
632.53.5
642.53.5
652.53.5
663.745.26
671.662.34
683.334.67
692.082.92
702.53.5
712.914.09
722.082.92
732.914.09
740.420.58
751.662.34
762.082.92
781.251.75
810.420.58
840.420.58

\begin{tabular}{lllllllll}
\hline
Tabulation of Expected Results \tabularnewline
AMS.E  x  gender \tabularnewline
  & 0 & 1 \tabularnewline
42 & 0.42 & 0.58 \tabularnewline
50 & 0.42 & 0.58 \tabularnewline
52 & 0.83 & 1.17 \tabularnewline
53 & 0.42 & 0.58 \tabularnewline
54 & 0.83 & 1.17 \tabularnewline
56 & 0.42 & 0.58 \tabularnewline
58 & 0.42 & 0.58 \tabularnewline
59 & 2.5 & 3.5 \tabularnewline
60 & 2.08 & 2.92 \tabularnewline
61 & 1.66 & 2.34 \tabularnewline
62 & 2.08 & 2.92 \tabularnewline
63 & 2.5 & 3.5 \tabularnewline
64 & 2.5 & 3.5 \tabularnewline
65 & 2.5 & 3.5 \tabularnewline
66 & 3.74 & 5.26 \tabularnewline
67 & 1.66 & 2.34 \tabularnewline
68 & 3.33 & 4.67 \tabularnewline
69 & 2.08 & 2.92 \tabularnewline
70 & 2.5 & 3.5 \tabularnewline
71 & 2.91 & 4.09 \tabularnewline
72 & 2.08 & 2.92 \tabularnewline
73 & 2.91 & 4.09 \tabularnewline
74 & 0.42 & 0.58 \tabularnewline
75 & 1.66 & 2.34 \tabularnewline
76 & 2.08 & 2.92 \tabularnewline
78 & 1.25 & 1.75 \tabularnewline
81 & 0.42 & 0.58 \tabularnewline
84 & 0.42 & 0.58 \tabularnewline
\hline
\end{tabular}
%Source: https://freestatistics.org/blog/index.php?pk=267611&T=2

[TABLE]
[ROW][C]Tabulation of Expected Results[/C][/ROW]
[ROW][C]AMS.E  x  gender[/C][/ROW]
[ROW][C] [/C][C]0[/C][C]1[/C][/ROW]
[C]42[/C][C]0.42[/C][C]0.58[/C][/ROW]
[C]50[/C][C]0.42[/C][C]0.58[/C][/ROW]
[C]52[/C][C]0.83[/C][C]1.17[/C][/ROW]
[C]53[/C][C]0.42[/C][C]0.58[/C][/ROW]
[C]54[/C][C]0.83[/C][C]1.17[/C][/ROW]
[C]56[/C][C]0.42[/C][C]0.58[/C][/ROW]
[C]58[/C][C]0.42[/C][C]0.58[/C][/ROW]
[C]59[/C][C]2.5[/C][C]3.5[/C][/ROW]
[C]60[/C][C]2.08[/C][C]2.92[/C][/ROW]
[C]61[/C][C]1.66[/C][C]2.34[/C][/ROW]
[C]62[/C][C]2.08[/C][C]2.92[/C][/ROW]
[C]63[/C][C]2.5[/C][C]3.5[/C][/ROW]
[C]64[/C][C]2.5[/C][C]3.5[/C][/ROW]
[C]65[/C][C]2.5[/C][C]3.5[/C][/ROW]
[C]66[/C][C]3.74[/C][C]5.26[/C][/ROW]
[C]67[/C][C]1.66[/C][C]2.34[/C][/ROW]
[C]68[/C][C]3.33[/C][C]4.67[/C][/ROW]
[C]69[/C][C]2.08[/C][C]2.92[/C][/ROW]
[C]70[/C][C]2.5[/C][C]3.5[/C][/ROW]
[C]71[/C][C]2.91[/C][C]4.09[/C][/ROW]
[C]72[/C][C]2.08[/C][C]2.92[/C][/ROW]
[C]73[/C][C]2.91[/C][C]4.09[/C][/ROW]
[C]74[/C][C]0.42[/C][C]0.58[/C][/ROW]
[C]75[/C][C]1.66[/C][C]2.34[/C][/ROW]
[C]76[/C][C]2.08[/C][C]2.92[/C][/ROW]
[C]78[/C][C]1.25[/C][C]1.75[/C][/ROW]
[C]81[/C][C]0.42[/C][C]0.58[/C][/ROW]
[C]84[/C][C]0.42[/C][C]0.58[/C][/ROW]
[/TABLE]
Source: https://freestatistics.org/blog/index.php?pk=267611&T=2

Globally Unique Identifier (entire table): ba.freestatistics.org/blog/index.php?pk=267611&T=2

As an alternative you can also use a QR Code:  

The GUIDs for individual cells are displayed in the table below:

Tabulation of Expected Results
AMS.E x gender
01
420.420.58
500.420.58
520.831.17
530.420.58
540.831.17
560.420.58
580.420.58
592.53.5
602.082.92
611.662.34
622.082.92
632.53.5
642.53.5
652.53.5
663.745.26
671.662.34
683.334.67
692.082.92
702.53.5
712.914.09
722.082.92
732.914.09
740.420.58
751.662.34
762.082.92
781.251.75
810.420.58
840.420.58


Statistical Results
Pearson's Chi-squared test with simulated p-value (based on 2000 replicates)
Exact Pearson Chi Square Statistic28.26
P value0.4

\begin{tabular}{lllllllll}
\hline
Statistical Results \tabularnewline
Pearson's Chi-squared test with simulated p-value
	 (based on 2000 replicates) \tabularnewline
Exact Pearson Chi Square Statistic & 28.26 \tabularnewline
P value & 0.4 \tabularnewline
\hline
\end{tabular}
%Source: https://freestatistics.org/blog/index.php?pk=267611&T=3

[TABLE]
[ROW][C]Statistical Results[/C][/ROW]
[ROW][C]Pearson's Chi-squared test with simulated p-value
	 (based on 2000 replicates)[/C][/ROW]
[ROW][C]Exact Pearson Chi Square Statistic[/C][C]28.26[/C][/ROW]
[ROW][C]P value[/C][C]0.4[/C][/ROW]
[/TABLE]
Source: https://freestatistics.org/blog/index.php?pk=267611&T=3

Globally Unique Identifier (entire table): ba.freestatistics.org/blog/index.php?pk=267611&T=3

As an alternative you can also use a QR Code:  

The GUIDs for individual cells are displayed in the table below:

Statistical Results
Pearson's Chi-squared test with simulated p-value (based on 2000 replicates)
Exact Pearson Chi Square Statistic28.26
P value0.4


Parameters (Session):
par1 = 2 ; par2 = 3 ; par3 = Exact Pearson Chi-Squared by Simulation ;
Parameters (R input):
par1 = 2 ; par2 = 3 ; par3 = Exact Pearson Chi-Squared by Simulation ;
R code (references can be found in the software module):
par3 <- 'Exact Pearson Chi-Squared by Simulation'
par2 <- '3'
par1 <- '2'
library(vcd)
cat1 <- as.numeric(par1) #
cat2<- as.numeric(par2) #
simulate.p.value=FALSE
if (par3 == 'Exact Pearson Chi-Squared by Simulation') simulate.p.value=TRUE
x <- t(x)
(z <- array(unlist(x),dim=c(length(x[,1]),length(x[1,]))))
(table1 <- table(z[,cat1],z[,cat2]))
(V1<-dimnames(y)[[1]][cat1])
(V2<-dimnames(y)[[1]][cat2])
bitmap(file='pic1.png')
assoc(ftable(z[,cat1],z[,cat2],row.vars=1,dnn=c(V1,V2)),shade=T)
dev.off()
load(file='createtable')
a<-table.start()
a<-table.row.start(a)
a<-table.element(a,'Tabulation of Results',ncol(table1)+1,TRUE)
a<-table.row.end(a)
a<-table.row.start(a)
a<-table.element(a,paste(V1,' x ', V2),ncol(table1)+1,TRUE)
a<-table.row.end(a)
a<-table.row.start(a)
a<-table.element(a, ' ', 1,TRUE)
for(nc in 1:ncol(table1)){
a<-table.element(a, colnames(table1)[nc], 1, TRUE)
}
a<-table.row.end(a)
for(nr in 1:nrow(table1) ){
a<-table.element(a, rownames(table1)[nr], 1, TRUE)
for(nc in 1:ncol(table1) ){
a<-table.element(a, table1[nr, nc], 1, FALSE)
}
a<-table.row.end(a)
}
a<-table.end(a)
table.save(a,file='mytable.tab')
(cst<-chisq.test(table1, simulate.p.value=simulate.p.value) )
if (par3 == 'McNemar Chi-Squared') {
(cst <- mcnemar.test(table1))
}
if (par3=='Fisher Exact Test') {
(cst <- fisher.test(table1))
}
if ((par3 != 'McNemar Chi-Squared') & (par3 != 'Fisher Exact Test')) {
a<-table.start()
a<-table.row.start(a)
a<-table.element(a,'Tabulation of Expected Results',ncol(table1)+1,TRUE)
a<-table.row.end(a)
a<-table.row.start(a)
a<-table.element(a,paste(V1,' x ', V2),ncol(table1)+1,TRUE)
a<-table.row.end(a)
a<-table.row.start(a)
a<-table.element(a, ' ', 1,TRUE)
for(nc in 1:ncol(table1)){
a<-table.element(a, colnames(table1)[nc], 1, TRUE)
}
a<-table.row.end(a)
for(nr in 1:nrow(table1) ){
a<-table.element(a, rownames(table1)[nr], 1, TRUE)
for(nc in 1:ncol(table1) ){
a<-table.element(a, round(cst$expected[nr, nc], digits=2), 1, FALSE)
}
a<-table.row.end(a)
}
a<-table.end(a)
table.save(a,file='mytable1.tab')
}
a<-table.start()
a<-table.row.start(a)
a<-table.element(a,'Statistical Results',2,TRUE)
a<-table.row.end(a)
a<-table.row.start(a)
a<-table.element(a, cst$method, 2,TRUE)
a<-table.row.end(a)
a<-table.row.start(a)
if (par3=='Pearson Chi-Squared') a<-table.element(a, 'Pearson Chi Square Statistic', 1, TRUE)
if (par3=='Exact Pearson Chi-Squared by Simulation') a<-table.element(a, 'Exact Pearson Chi Square Statistic', 1, TRUE)
if (par3=='McNemar Chi-Squared') a<-table.element(a, 'McNemar Chi Square Statistic', 1, TRUE)
if (par3=='Fisher Exact Test') a<-table.element(a, 'Odds Ratio', 1, TRUE)
if (par3=='Fisher Exact Test') {
if ((ncol(table1) == 2) & (nrow(table1) == 2)) {
a<-table.element(a, round(cst$estimate, digits=2), 1,FALSE)
} else {
a<-table.element(a, '--', 1,FALSE)
}
} else {
a<-table.element(a, round(cst$statistic, digits=2), 1,FALSE)
}
a<-table.row.end(a)
if(!simulate.p.value){
if(par3!='Fisher Exact Test') {
a<-table.row.start(a)
a<-table.element(a, 'Degrees of Freedom', 1, TRUE)
a<-table.element(a, cst$parameter, 1,FALSE)
a<-table.row.end(a)
}
}
a<-table.row.start(a)
a<-table.element(a, 'P value', 1, TRUE)
a<-table.element(a, round(cst$p.value, digits=2), 1,FALSE)
a<-table.row.end(a)
a<-table.end(a)
table.save(a,file='mytable2.tab')