Free Statistics

of Irreproducible Research!

Author's title

Author*The author of this computation has been verified*
R Software Modulerwasp_multipleregression.wasp
Title produced by softwareMultiple Regression
Date of computationSun, 14 Dec 2014 14:47:26 +0000
Cite this page as followsStatistical Computations at FreeStatistics.org, Office for Research Development and Education, URL https://freestatistics.org/blog/index.php?v=date/2014/Dec/14/t14185684590686s5yp8cphtc4.htm/, Retrieved Thu, 16 May 2024 14:00:28 +0000
Statistical Computations at FreeStatistics.org, Office for Research Development and Education, URL https://freestatistics.org/blog/index.php?pk=267650, Retrieved Thu, 16 May 2024 14:00:28 +0000
QR Codes:

Original text written by user:
IsPrivate?No (this computation is public)
User-defined keywords
Estimated Impact85
Family? (F = Feedback message, R = changed R code, M = changed R Module, P = changed Parameters, D = changed Data)
-       [Multiple Regression] [edfb] [2014-12-14 14:47:26] [624214a256768d6065ce8a528542dcc5] [Current]
Feedback Forum

Post a new message
Dataseries X:
12.9	26	50
12.8	37	54
14.8	52	73
12	58	73
6.3	68	75
11.3	62	72
9.3	56	70
10	74	81
10.8	58	71
13.4	51	61
11.5	53	76
8.3	29	70
11.7	54	60
10.4	54	70
11.8	47	76
11.3	68	67
12.7	67	76
5.7	41	75
8	45	63
12.5	56	70
7.6	41	75
9.2	53	60
11.1	66	73
12.2	37	64
12.3	51	59
11.4	51	64
8.8	56	60
12.6	37	78
13	42	67
13.2	66	66
9.9	34	68
10.5	49	66
13.4	55	73
10.9	49	72
10.3	40	59
11.4	63	78
8.6	56	68
13.2	54	73
8.8	32	65
9	67	71
10.3	66	76
8.5	51	63
13.5	55	59
4.9	50	73
6.4	60	66
9.6	56	62
11.6	63	69


Summary of computational transaction
Raw Inputview raw input (R code)
Raw Outputview raw output of R engine
Computing time5 seconds
R Server'Sir Maurice George Kendall' @ kendall.wessa.net

\begin{tabular}{lllllllll}
\hline
Summary of computational transaction \tabularnewline
Raw Input & view raw input (R code)  \tabularnewline
Raw Output & view raw output of R engine  \tabularnewline
Computing time & 5 seconds \tabularnewline
R Server & 'Sir Maurice George Kendall' @ kendall.wessa.net \tabularnewline
\hline
\end{tabular}
%Source: https://freestatistics.org/blog/index.php?pk=267650&T=0

[TABLE]
[ROW][C]Summary of computational transaction[/C][/ROW]
[ROW][C]Raw Input[/C][C]view raw input (R code) [/C][/ROW]
[ROW][C]Raw Output[/C][C]view raw output of R engine [/C][/ROW]
[ROW][C]Computing time[/C][C]5 seconds[/C][/ROW]
[ROW][C]R Server[/C][C]'Sir Maurice George Kendall' @ kendall.wessa.net[/C][/ROW]
[/TABLE]
Source: https://freestatistics.org/blog/index.php?pk=267650&T=0

Globally Unique Identifier (entire table): ba.freestatistics.org/blog/index.php?pk=267650&T=0

As an alternative you can also use a QR Code:  

The GUIDs for individual cells are displayed in the table below:

Summary of computational transaction
Raw Inputview raw input (R code)
Raw Outputview raw output of R engine
Computing time5 seconds
R Server'Sir Maurice George Kendall' @ kendall.wessa.net


Multiple Linear Regression - Estimated Regression Equation
TOT[t] = + 13.5962 + 0.0184079AMS.I.V[t] -0.0574864AMS.E.V[t] + e[t]

\begin{tabular}{lllllllll}
\hline
Multiple Linear Regression - Estimated Regression Equation \tabularnewline
TOT[t] =  +  13.5962 +  0.0184079AMS.I.V[t] -0.0574864AMS.E.V[t]  + e[t] \tabularnewline
\hline
\end{tabular}
%Source: https://freestatistics.org/blog/index.php?pk=267650&T=1

[TABLE]
[ROW][C]Multiple Linear Regression - Estimated Regression Equation[/C][/ROW]
[ROW][C]TOT[t] =  +  13.5962 +  0.0184079AMS.I.V[t] -0.0574864AMS.E.V[t]  + e[t][/C][/ROW]
[/TABLE]
Source: https://freestatistics.org/blog/index.php?pk=267650&T=1

Globally Unique Identifier (entire table): ba.freestatistics.org/blog/index.php?pk=267650&T=1

As an alternative you can also use a QR Code:  

The GUIDs for individual cells are displayed in the table below:

Multiple Linear Regression - Estimated Regression Equation
TOT[t] = + 13.5962 + 0.0184079AMS.I.V[t] -0.0574864AMS.E.V[t] + e[t]


Multiple Linear Regression - Ordinary Least Squares
VariableParameterS.D.T-STATH0: parameter = 02-tail p-value1-tail p-value
(Intercept)13.59623.39654.0030.0002367830.000118391
AMS.I.V0.01840790.03261090.56450.5752990.28765
AMS.E.V-0.05748640.0538658-1.0670.2916950.145848

\begin{tabular}{lllllllll}
\hline
Multiple Linear Regression - Ordinary Least Squares \tabularnewline
Variable & Parameter & S.D. & T-STATH0: parameter = 0 & 2-tail p-value & 1-tail p-value \tabularnewline
(Intercept) & 13.5962 & 3.3965 & 4.003 & 0.000236783 & 0.000118391 \tabularnewline
AMS.I.V & 0.0184079 & 0.0326109 & 0.5645 & 0.575299 & 0.28765 \tabularnewline
AMS.E.V & -0.0574864 & 0.0538658 & -1.067 & 0.291695 & 0.145848 \tabularnewline
\hline
\end{tabular}
%Source: https://freestatistics.org/blog/index.php?pk=267650&T=2

[TABLE]
[ROW][C]Multiple Linear Regression - Ordinary Least Squares[/C][/ROW]
[ROW][C]Variable[/C][C]Parameter[/C][C]S.D.[/C][C]T-STATH0: parameter = 0[/C][C]2-tail p-value[/C][C]1-tail p-value[/C][/ROW]
[ROW][C](Intercept)[/C][C]13.5962[/C][C]3.3965[/C][C]4.003[/C][C]0.000236783[/C][C]0.000118391[/C][/ROW]
[ROW][C]AMS.I.V[/C][C]0.0184079[/C][C]0.0326109[/C][C]0.5645[/C][C]0.575299[/C][C]0.28765[/C][/ROW]
[ROW][C]AMS.E.V[/C][C]-0.0574864[/C][C]0.0538658[/C][C]-1.067[/C][C]0.291695[/C][C]0.145848[/C][/ROW]
[/TABLE]
Source: https://freestatistics.org/blog/index.php?pk=267650&T=2

Globally Unique Identifier (entire table): ba.freestatistics.org/blog/index.php?pk=267650&T=2

As an alternative you can also use a QR Code:  

The GUIDs for individual cells are displayed in the table below:

Multiple Linear Regression - Ordinary Least Squares
VariableParameterS.D.T-STATH0: parameter = 02-tail p-value1-tail p-value
(Intercept)13.59623.39654.0030.0002367830.000118391
AMS.I.V0.01840790.03261090.56450.5752990.28765
AMS.E.V-0.05748640.0538658-1.0670.2916950.145848


Multiple Linear Regression - Regression Statistics
Multiple R0.160375
R-squared0.02572
Adjusted R-squared-0.0185654
F-TEST (value)0.580778
F-TEST (DF numerator)2
F-TEST (DF denominator)44
p-value0.563694
Multiple Linear Regression - Residual Statistics
Residual Standard Deviation2.27861
Sum Squared Residuals228.451

\begin{tabular}{lllllllll}
\hline
Multiple Linear Regression - Regression Statistics \tabularnewline
Multiple R & 0.160375 \tabularnewline
R-squared & 0.02572 \tabularnewline
Adjusted R-squared & -0.0185654 \tabularnewline
F-TEST (value) & 0.580778 \tabularnewline
F-TEST (DF numerator) & 2 \tabularnewline
F-TEST (DF denominator) & 44 \tabularnewline
p-value & 0.563694 \tabularnewline
Multiple Linear Regression - Residual Statistics \tabularnewline
Residual Standard Deviation & 2.27861 \tabularnewline
Sum Squared Residuals & 228.451 \tabularnewline
\hline
\end{tabular}
%Source: https://freestatistics.org/blog/index.php?pk=267650&T=3

[TABLE]
[ROW][C]Multiple Linear Regression - Regression Statistics[/C][/ROW]
[ROW][C]Multiple R[/C][C]0.160375[/C][/ROW]
[ROW][C]R-squared[/C][C]0.02572[/C][/ROW]
[ROW][C]Adjusted R-squared[/C][C]-0.0185654[/C][/ROW]
[ROW][C]F-TEST (value)[/C][C]0.580778[/C][/ROW]
[ROW][C]F-TEST (DF numerator)[/C][C]2[/C][/ROW]
[ROW][C]F-TEST (DF denominator)[/C][C]44[/C][/ROW]
[ROW][C]p-value[/C][C]0.563694[/C][/ROW]
[ROW][C]Multiple Linear Regression - Residual Statistics[/C][/ROW]
[ROW][C]Residual Standard Deviation[/C][C]2.27861[/C][/ROW]
[ROW][C]Sum Squared Residuals[/C][C]228.451[/C][/ROW]
[/TABLE]
Source: https://freestatistics.org/blog/index.php?pk=267650&T=3

Globally Unique Identifier (entire table): ba.freestatistics.org/blog/index.php?pk=267650&T=3

As an alternative you can also use a QR Code:  

The GUIDs for individual cells are displayed in the table below:

Multiple Linear Regression - Regression Statistics
Multiple R0.160375
R-squared0.02572
Adjusted R-squared-0.0185654
F-TEST (value)0.580778
F-TEST (DF numerator)2
F-TEST (DF denominator)44
p-value0.563694
Multiple Linear Regression - Residual Statistics
Residual Standard Deviation2.27861
Sum Squared Residuals228.451


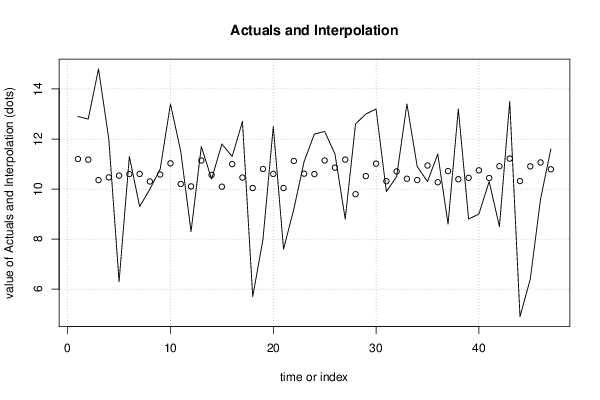
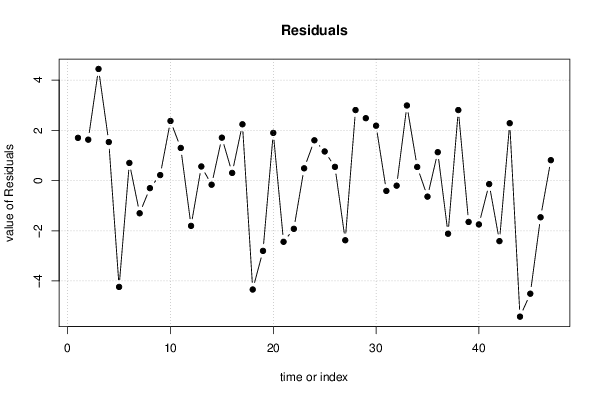
Multiple Linear Regression - Actuals, Interpolation, and Residuals
Time or IndexActualsInterpolationForecastResidualsPrediction Error
112.911.20051.69951
212.811.1731.62697
314.810.35694.44309
41210.46741.53265
56.310.5365-4.23646
611.310.59850.701528
79.310.603-1.303
81010.302-0.30199
910.810.58230.217673
1013.411.02832.37166
1111.510.20291.29714
128.310.106-1.80598
1311.711.1410.558955
1410.410.5662-0.166182
1511.810.09241.70759
1611.310.99640.303648
1712.710.46062.23943
185.710.0394-4.33945
19810.8029-2.80291
2012.510.6031.897
217.610.0394-2.43945
229.211.1226-1.92264
2311.110.61460.485382
2412.210.59821.60183
2512.311.14331.15669
2611.410.85590.544124
278.811.1779-2.37786
2812.69.793362.80664
291310.51772.48225
3013.211.0172.18298
319.910.313-0.412996
3210.510.7041-0.204088
3313.410.41212.98787
3410.910.35920.540831
3510.310.9408-0.640821
3611.410.2721.12804
378.610.718-2.11797
3813.210.39372.80628
398.810.4486-1.64864
40910.748-1.748
4110.310.4422-0.142159
428.510.9134-2.41336
4313.511.21692.28306
444.910.3201-5.42009
456.410.9066-4.50657
469.611.0629-1.46289
4711.610.78930.810661

\begin{tabular}{lllllllll}
\hline
Multiple Linear Regression - Actuals, Interpolation, and Residuals \tabularnewline
Time or Index & Actuals & InterpolationForecast & ResidualsPrediction Error \tabularnewline
1 & 12.9 & 11.2005 & 1.69951 \tabularnewline
2 & 12.8 & 11.173 & 1.62697 \tabularnewline
3 & 14.8 & 10.3569 & 4.44309 \tabularnewline
4 & 12 & 10.4674 & 1.53265 \tabularnewline
5 & 6.3 & 10.5365 & -4.23646 \tabularnewline
6 & 11.3 & 10.5985 & 0.701528 \tabularnewline
7 & 9.3 & 10.603 & -1.303 \tabularnewline
8 & 10 & 10.302 & -0.30199 \tabularnewline
9 & 10.8 & 10.5823 & 0.217673 \tabularnewline
10 & 13.4 & 11.0283 & 2.37166 \tabularnewline
11 & 11.5 & 10.2029 & 1.29714 \tabularnewline
12 & 8.3 & 10.106 & -1.80598 \tabularnewline
13 & 11.7 & 11.141 & 0.558955 \tabularnewline
14 & 10.4 & 10.5662 & -0.166182 \tabularnewline
15 & 11.8 & 10.0924 & 1.70759 \tabularnewline
16 & 11.3 & 10.9964 & 0.303648 \tabularnewline
17 & 12.7 & 10.4606 & 2.23943 \tabularnewline
18 & 5.7 & 10.0394 & -4.33945 \tabularnewline
19 & 8 & 10.8029 & -2.80291 \tabularnewline
20 & 12.5 & 10.603 & 1.897 \tabularnewline
21 & 7.6 & 10.0394 & -2.43945 \tabularnewline
22 & 9.2 & 11.1226 & -1.92264 \tabularnewline
23 & 11.1 & 10.6146 & 0.485382 \tabularnewline
24 & 12.2 & 10.5982 & 1.60183 \tabularnewline
25 & 12.3 & 11.1433 & 1.15669 \tabularnewline
26 & 11.4 & 10.8559 & 0.544124 \tabularnewline
27 & 8.8 & 11.1779 & -2.37786 \tabularnewline
28 & 12.6 & 9.79336 & 2.80664 \tabularnewline
29 & 13 & 10.5177 & 2.48225 \tabularnewline
30 & 13.2 & 11.017 & 2.18298 \tabularnewline
31 & 9.9 & 10.313 & -0.412996 \tabularnewline
32 & 10.5 & 10.7041 & -0.204088 \tabularnewline
33 & 13.4 & 10.4121 & 2.98787 \tabularnewline
34 & 10.9 & 10.3592 & 0.540831 \tabularnewline
35 & 10.3 & 10.9408 & -0.640821 \tabularnewline
36 & 11.4 & 10.272 & 1.12804 \tabularnewline
37 & 8.6 & 10.718 & -2.11797 \tabularnewline
38 & 13.2 & 10.3937 & 2.80628 \tabularnewline
39 & 8.8 & 10.4486 & -1.64864 \tabularnewline
40 & 9 & 10.748 & -1.748 \tabularnewline
41 & 10.3 & 10.4422 & -0.142159 \tabularnewline
42 & 8.5 & 10.9134 & -2.41336 \tabularnewline
43 & 13.5 & 11.2169 & 2.28306 \tabularnewline
44 & 4.9 & 10.3201 & -5.42009 \tabularnewline
45 & 6.4 & 10.9066 & -4.50657 \tabularnewline
46 & 9.6 & 11.0629 & -1.46289 \tabularnewline
47 & 11.6 & 10.7893 & 0.810661 \tabularnewline
\hline
\end{tabular}
%Source: https://freestatistics.org/blog/index.php?pk=267650&T=4

[TABLE]
[ROW][C]Multiple Linear Regression - Actuals, Interpolation, and Residuals[/C][/ROW]
[ROW][C]Time or Index[/C][C]Actuals[/C][C]InterpolationForecast[/C][C]ResidualsPrediction Error[/C][/ROW]
[ROW][C]1[/C][C]12.9[/C][C]11.2005[/C][C]1.69951[/C][/ROW]
[ROW][C]2[/C][C]12.8[/C][C]11.173[/C][C]1.62697[/C][/ROW]
[ROW][C]3[/C][C]14.8[/C][C]10.3569[/C][C]4.44309[/C][/ROW]
[ROW][C]4[/C][C]12[/C][C]10.4674[/C][C]1.53265[/C][/ROW]
[ROW][C]5[/C][C]6.3[/C][C]10.5365[/C][C]-4.23646[/C][/ROW]
[ROW][C]6[/C][C]11.3[/C][C]10.5985[/C][C]0.701528[/C][/ROW]
[ROW][C]7[/C][C]9.3[/C][C]10.603[/C][C]-1.303[/C][/ROW]
[ROW][C]8[/C][C]10[/C][C]10.302[/C][C]-0.30199[/C][/ROW]
[ROW][C]9[/C][C]10.8[/C][C]10.5823[/C][C]0.217673[/C][/ROW]
[ROW][C]10[/C][C]13.4[/C][C]11.0283[/C][C]2.37166[/C][/ROW]
[ROW][C]11[/C][C]11.5[/C][C]10.2029[/C][C]1.29714[/C][/ROW]
[ROW][C]12[/C][C]8.3[/C][C]10.106[/C][C]-1.80598[/C][/ROW]
[ROW][C]13[/C][C]11.7[/C][C]11.141[/C][C]0.558955[/C][/ROW]
[ROW][C]14[/C][C]10.4[/C][C]10.5662[/C][C]-0.166182[/C][/ROW]
[ROW][C]15[/C][C]11.8[/C][C]10.0924[/C][C]1.70759[/C][/ROW]
[ROW][C]16[/C][C]11.3[/C][C]10.9964[/C][C]0.303648[/C][/ROW]
[ROW][C]17[/C][C]12.7[/C][C]10.4606[/C][C]2.23943[/C][/ROW]
[ROW][C]18[/C][C]5.7[/C][C]10.0394[/C][C]-4.33945[/C][/ROW]
[ROW][C]19[/C][C]8[/C][C]10.8029[/C][C]-2.80291[/C][/ROW]
[ROW][C]20[/C][C]12.5[/C][C]10.603[/C][C]1.897[/C][/ROW]
[ROW][C]21[/C][C]7.6[/C][C]10.0394[/C][C]-2.43945[/C][/ROW]
[ROW][C]22[/C][C]9.2[/C][C]11.1226[/C][C]-1.92264[/C][/ROW]
[ROW][C]23[/C][C]11.1[/C][C]10.6146[/C][C]0.485382[/C][/ROW]
[ROW][C]24[/C][C]12.2[/C][C]10.5982[/C][C]1.60183[/C][/ROW]
[ROW][C]25[/C][C]12.3[/C][C]11.1433[/C][C]1.15669[/C][/ROW]
[ROW][C]26[/C][C]11.4[/C][C]10.8559[/C][C]0.544124[/C][/ROW]
[ROW][C]27[/C][C]8.8[/C][C]11.1779[/C][C]-2.37786[/C][/ROW]
[ROW][C]28[/C][C]12.6[/C][C]9.79336[/C][C]2.80664[/C][/ROW]
[ROW][C]29[/C][C]13[/C][C]10.5177[/C][C]2.48225[/C][/ROW]
[ROW][C]30[/C][C]13.2[/C][C]11.017[/C][C]2.18298[/C][/ROW]
[ROW][C]31[/C][C]9.9[/C][C]10.313[/C][C]-0.412996[/C][/ROW]
[ROW][C]32[/C][C]10.5[/C][C]10.7041[/C][C]-0.204088[/C][/ROW]
[ROW][C]33[/C][C]13.4[/C][C]10.4121[/C][C]2.98787[/C][/ROW]
[ROW][C]34[/C][C]10.9[/C][C]10.3592[/C][C]0.540831[/C][/ROW]
[ROW][C]35[/C][C]10.3[/C][C]10.9408[/C][C]-0.640821[/C][/ROW]
[ROW][C]36[/C][C]11.4[/C][C]10.272[/C][C]1.12804[/C][/ROW]
[ROW][C]37[/C][C]8.6[/C][C]10.718[/C][C]-2.11797[/C][/ROW]
[ROW][C]38[/C][C]13.2[/C][C]10.3937[/C][C]2.80628[/C][/ROW]
[ROW][C]39[/C][C]8.8[/C][C]10.4486[/C][C]-1.64864[/C][/ROW]
[ROW][C]40[/C][C]9[/C][C]10.748[/C][C]-1.748[/C][/ROW]
[ROW][C]41[/C][C]10.3[/C][C]10.4422[/C][C]-0.142159[/C][/ROW]
[ROW][C]42[/C][C]8.5[/C][C]10.9134[/C][C]-2.41336[/C][/ROW]
[ROW][C]43[/C][C]13.5[/C][C]11.2169[/C][C]2.28306[/C][/ROW]
[ROW][C]44[/C][C]4.9[/C][C]10.3201[/C][C]-5.42009[/C][/ROW]
[ROW][C]45[/C][C]6.4[/C][C]10.9066[/C][C]-4.50657[/C][/ROW]
[ROW][C]46[/C][C]9.6[/C][C]11.0629[/C][C]-1.46289[/C][/ROW]
[ROW][C]47[/C][C]11.6[/C][C]10.7893[/C][C]0.810661[/C][/ROW]
[/TABLE]
Source: https://freestatistics.org/blog/index.php?pk=267650&T=4

Globally Unique Identifier (entire table): ba.freestatistics.org/blog/index.php?pk=267650&T=4

As an alternative you can also use a QR Code:  

The GUIDs for individual cells are displayed in the table below:

Multiple Linear Regression - Actuals, Interpolation, and Residuals
Time or IndexActualsInterpolationForecastResidualsPrediction Error
112.911.20051.69951
212.811.1731.62697
314.810.35694.44309
41210.46741.53265
56.310.5365-4.23646
611.310.59850.701528
79.310.603-1.303
81010.302-0.30199
910.810.58230.217673
1013.411.02832.37166
1111.510.20291.29714
128.310.106-1.80598
1311.711.1410.558955
1410.410.5662-0.166182
1511.810.09241.70759
1611.310.99640.303648
1712.710.46062.23943
185.710.0394-4.33945
19810.8029-2.80291
2012.510.6031.897
217.610.0394-2.43945
229.211.1226-1.92264
2311.110.61460.485382
2412.210.59821.60183
2512.311.14331.15669
2611.410.85590.544124
278.811.1779-2.37786
2812.69.793362.80664
291310.51772.48225
3013.211.0172.18298
319.910.313-0.412996
3210.510.7041-0.204088
3313.410.41212.98787
3410.910.35920.540831
3510.310.9408-0.640821
3611.410.2721.12804
378.610.718-2.11797
3813.210.39372.80628
398.810.4486-1.64864
40910.748-1.748
4110.310.4422-0.142159
428.510.9134-2.41336
4313.511.21692.28306
444.910.3201-5.42009
456.410.9066-4.50657
469.611.0629-1.46289
4711.610.78930.810661


Goldfeld-Quandt test for Heteroskedasticity
p-valuesAlternative Hypothesis
breakpoint indexgreater2-sidedless
60.5073080.9853840.492692
70.4436870.8873750.556313
80.3484220.6968440.651578
90.2256220.4512450.774378
100.4530270.9060540.546973
110.3836120.7672230.616388
120.5978330.8043350.402167
130.5016280.9967440.498372
140.402240.804480.59776
150.348330.696660.65167
160.2610880.5221770.738912
170.2517580.5035150.748242
180.4869730.9739460.513027
190.5522640.8954730.447736
200.5128750.9742490.487125
210.513670.972660.48633
220.5092660.9814680.490734
230.4220140.8440270.577986
240.3781740.7563480.621826
250.3283470.6566950.671653
260.2605830.5211650.739417
270.2630080.5260170.736992
280.2832140.5664290.716786
290.3093980.6187950.690602
300.3057420.6114840.694258
310.2318310.4636620.768169
320.1689040.3378090.831096
330.2284710.4569420.771529
340.1804380.3608770.819562
350.1306330.2612670.869367
360.1072750.2145490.892725
370.07947940.1589590.920521
380.2360020.4720040.763998
390.2857630.5715260.714237
400.2346870.4693750.765313
410.1783120.3566240.821688

\begin{tabular}{lllllllll}
\hline
Goldfeld-Quandt test for Heteroskedasticity \tabularnewline
p-values & Alternative Hypothesis \tabularnewline
breakpoint index & greater & 2-sided & less \tabularnewline
6 & 0.507308 & 0.985384 & 0.492692 \tabularnewline
7 & 0.443687 & 0.887375 & 0.556313 \tabularnewline
8 & 0.348422 & 0.696844 & 0.651578 \tabularnewline
9 & 0.225622 & 0.451245 & 0.774378 \tabularnewline
10 & 0.453027 & 0.906054 & 0.546973 \tabularnewline
11 & 0.383612 & 0.767223 & 0.616388 \tabularnewline
12 & 0.597833 & 0.804335 & 0.402167 \tabularnewline
13 & 0.501628 & 0.996744 & 0.498372 \tabularnewline
14 & 0.40224 & 0.80448 & 0.59776 \tabularnewline
15 & 0.34833 & 0.69666 & 0.65167 \tabularnewline
16 & 0.261088 & 0.522177 & 0.738912 \tabularnewline
17 & 0.251758 & 0.503515 & 0.748242 \tabularnewline
18 & 0.486973 & 0.973946 & 0.513027 \tabularnewline
19 & 0.552264 & 0.895473 & 0.447736 \tabularnewline
20 & 0.512875 & 0.974249 & 0.487125 \tabularnewline
21 & 0.51367 & 0.97266 & 0.48633 \tabularnewline
22 & 0.509266 & 0.981468 & 0.490734 \tabularnewline
23 & 0.422014 & 0.844027 & 0.577986 \tabularnewline
24 & 0.378174 & 0.756348 & 0.621826 \tabularnewline
25 & 0.328347 & 0.656695 & 0.671653 \tabularnewline
26 & 0.260583 & 0.521165 & 0.739417 \tabularnewline
27 & 0.263008 & 0.526017 & 0.736992 \tabularnewline
28 & 0.283214 & 0.566429 & 0.716786 \tabularnewline
29 & 0.309398 & 0.618795 & 0.690602 \tabularnewline
30 & 0.305742 & 0.611484 & 0.694258 \tabularnewline
31 & 0.231831 & 0.463662 & 0.768169 \tabularnewline
32 & 0.168904 & 0.337809 & 0.831096 \tabularnewline
33 & 0.228471 & 0.456942 & 0.771529 \tabularnewline
34 & 0.180438 & 0.360877 & 0.819562 \tabularnewline
35 & 0.130633 & 0.261267 & 0.869367 \tabularnewline
36 & 0.107275 & 0.214549 & 0.892725 \tabularnewline
37 & 0.0794794 & 0.158959 & 0.920521 \tabularnewline
38 & 0.236002 & 0.472004 & 0.763998 \tabularnewline
39 & 0.285763 & 0.571526 & 0.714237 \tabularnewline
40 & 0.234687 & 0.469375 & 0.765313 \tabularnewline
41 & 0.178312 & 0.356624 & 0.821688 \tabularnewline
\hline
\end{tabular}
%Source: https://freestatistics.org/blog/index.php?pk=267650&T=5

[TABLE]
[ROW][C]Goldfeld-Quandt test for Heteroskedasticity[/C][/ROW]
[ROW][C]p-values[/C][C]Alternative Hypothesis[/C][/ROW]
[ROW][C]breakpoint index[/C][C]greater[/C][C]2-sided[/C][C]less[/C][/ROW]
[ROW][C]6[/C][C]0.507308[/C][C]0.985384[/C][C]0.492692[/C][/ROW]
[ROW][C]7[/C][C]0.443687[/C][C]0.887375[/C][C]0.556313[/C][/ROW]
[ROW][C]8[/C][C]0.348422[/C][C]0.696844[/C][C]0.651578[/C][/ROW]
[ROW][C]9[/C][C]0.225622[/C][C]0.451245[/C][C]0.774378[/C][/ROW]
[ROW][C]10[/C][C]0.453027[/C][C]0.906054[/C][C]0.546973[/C][/ROW]
[ROW][C]11[/C][C]0.383612[/C][C]0.767223[/C][C]0.616388[/C][/ROW]
[ROW][C]12[/C][C]0.597833[/C][C]0.804335[/C][C]0.402167[/C][/ROW]
[ROW][C]13[/C][C]0.501628[/C][C]0.996744[/C][C]0.498372[/C][/ROW]
[ROW][C]14[/C][C]0.40224[/C][C]0.80448[/C][C]0.59776[/C][/ROW]
[ROW][C]15[/C][C]0.34833[/C][C]0.69666[/C][C]0.65167[/C][/ROW]
[ROW][C]16[/C][C]0.261088[/C][C]0.522177[/C][C]0.738912[/C][/ROW]
[ROW][C]17[/C][C]0.251758[/C][C]0.503515[/C][C]0.748242[/C][/ROW]
[ROW][C]18[/C][C]0.486973[/C][C]0.973946[/C][C]0.513027[/C][/ROW]
[ROW][C]19[/C][C]0.552264[/C][C]0.895473[/C][C]0.447736[/C][/ROW]
[ROW][C]20[/C][C]0.512875[/C][C]0.974249[/C][C]0.487125[/C][/ROW]
[ROW][C]21[/C][C]0.51367[/C][C]0.97266[/C][C]0.48633[/C][/ROW]
[ROW][C]22[/C][C]0.509266[/C][C]0.981468[/C][C]0.490734[/C][/ROW]
[ROW][C]23[/C][C]0.422014[/C][C]0.844027[/C][C]0.577986[/C][/ROW]
[ROW][C]24[/C][C]0.378174[/C][C]0.756348[/C][C]0.621826[/C][/ROW]
[ROW][C]25[/C][C]0.328347[/C][C]0.656695[/C][C]0.671653[/C][/ROW]
[ROW][C]26[/C][C]0.260583[/C][C]0.521165[/C][C]0.739417[/C][/ROW]
[ROW][C]27[/C][C]0.263008[/C][C]0.526017[/C][C]0.736992[/C][/ROW]
[ROW][C]28[/C][C]0.283214[/C][C]0.566429[/C][C]0.716786[/C][/ROW]
[ROW][C]29[/C][C]0.309398[/C][C]0.618795[/C][C]0.690602[/C][/ROW]
[ROW][C]30[/C][C]0.305742[/C][C]0.611484[/C][C]0.694258[/C][/ROW]
[ROW][C]31[/C][C]0.231831[/C][C]0.463662[/C][C]0.768169[/C][/ROW]
[ROW][C]32[/C][C]0.168904[/C][C]0.337809[/C][C]0.831096[/C][/ROW]
[ROW][C]33[/C][C]0.228471[/C][C]0.456942[/C][C]0.771529[/C][/ROW]
[ROW][C]34[/C][C]0.180438[/C][C]0.360877[/C][C]0.819562[/C][/ROW]
[ROW][C]35[/C][C]0.130633[/C][C]0.261267[/C][C]0.869367[/C][/ROW]
[ROW][C]36[/C][C]0.107275[/C][C]0.214549[/C][C]0.892725[/C][/ROW]
[ROW][C]37[/C][C]0.0794794[/C][C]0.158959[/C][C]0.920521[/C][/ROW]
[ROW][C]38[/C][C]0.236002[/C][C]0.472004[/C][C]0.763998[/C][/ROW]
[ROW][C]39[/C][C]0.285763[/C][C]0.571526[/C][C]0.714237[/C][/ROW]
[ROW][C]40[/C][C]0.234687[/C][C]0.469375[/C][C]0.765313[/C][/ROW]
[ROW][C]41[/C][C]0.178312[/C][C]0.356624[/C][C]0.821688[/C][/ROW]
[/TABLE]
Source: https://freestatistics.org/blog/index.php?pk=267650&T=5

Globally Unique Identifier (entire table): ba.freestatistics.org/blog/index.php?pk=267650&T=5

As an alternative you can also use a QR Code:  

The GUIDs for individual cells are displayed in the table below:

Goldfeld-Quandt test for Heteroskedasticity
p-valuesAlternative Hypothesis
breakpoint indexgreater2-sidedless
60.5073080.9853840.492692
70.4436870.8873750.556313
80.3484220.6968440.651578
90.2256220.4512450.774378
100.4530270.9060540.546973
110.3836120.7672230.616388
120.5978330.8043350.402167
130.5016280.9967440.498372
140.402240.804480.59776
150.348330.696660.65167
160.2610880.5221770.738912
170.2517580.5035150.748242
180.4869730.9739460.513027
190.5522640.8954730.447736
200.5128750.9742490.487125
210.513670.972660.48633
220.5092660.9814680.490734
230.4220140.8440270.577986
240.3781740.7563480.621826
250.3283470.6566950.671653
260.2605830.5211650.739417
270.2630080.5260170.736992
280.2832140.5664290.716786
290.3093980.6187950.690602
300.3057420.6114840.694258
310.2318310.4636620.768169
320.1689040.3378090.831096
330.2284710.4569420.771529
340.1804380.3608770.819562
350.1306330.2612670.869367
360.1072750.2145490.892725
370.07947940.1589590.920521
380.2360020.4720040.763998
390.2857630.5715260.714237
400.2346870.4693750.765313
410.1783120.3566240.821688


Meta Analysis of Goldfeld-Quandt test for Heteroskedasticity
Description# significant tests% significant testsOK/NOK
1% type I error level00OK
5% type I error level00OK
10% type I error level00OK

\begin{tabular}{lllllllll}
\hline
Meta Analysis of Goldfeld-Quandt test for Heteroskedasticity \tabularnewline
Description & # significant tests & % significant tests & OK/NOK \tabularnewline
1% type I error level & 0 & 0 & OK \tabularnewline
5% type I error level & 0 & 0 & OK \tabularnewline
10% type I error level & 0 & 0 & OK \tabularnewline
\hline
\end{tabular}
%Source: https://freestatistics.org/blog/index.php?pk=267650&T=6

[TABLE]
[ROW][C]Meta Analysis of Goldfeld-Quandt test for Heteroskedasticity[/C][/ROW]
[ROW][C]Description[/C][C]# significant tests[/C][C]% significant tests[/C][C]OK/NOK[/C][/ROW]
[ROW][C]1% type I error level[/C][C]0[/C][C]0[/C][C]OK[/C][/ROW]
[ROW][C]5% type I error level[/C][C]0[/C][C]0[/C][C]OK[/C][/ROW]
[ROW][C]10% type I error level[/C][C]0[/C][C]0[/C][C]OK[/C][/ROW]
[/TABLE]
Source: https://freestatistics.org/blog/index.php?pk=267650&T=6

Globally Unique Identifier (entire table): ba.freestatistics.org/blog/index.php?pk=267650&T=6

As an alternative you can also use a QR Code:  

The GUIDs for individual cells are displayed in the table below:

Meta Analysis of Goldfeld-Quandt test for Heteroskedasticity
Description# significant tests% significant testsOK/NOK
1% type I error level00OK
5% type I error level00OK
10% type I error level00OK


Parameters (Session):
par1 = two.sided ; par2 = 0.95 ; par3 = 20 ;
Parameters (R input):
par1 = 1 ; par2 = Do not include Seasonal Dummies ; par3 = No Linear Trend ;
R code (references can be found in the software module):
par3 <- 'No Linear Trend'
par2 <- 'Do not include Seasonal Dummies'
par1 <- '1'
library(lattice)
library(lmtest)
n25 <- 25 #minimum number of obs. for Goldfeld-Quandt test
par1 <- as.numeric(par1)
x <- t(y)
k <- length(x[1,])
n <- length(x[,1])
x1 <- cbind(x[,par1], x[,1:k!=par1])
mycolnames <- c(colnames(x)[par1], colnames(x)[1:k!=par1])
colnames(x1) <- mycolnames #colnames(x)[par1]
x <- x1
if (par3 == 'First Differences'){
x2 <- array(0, dim=c(n-1,k), dimnames=list(1:(n-1), paste('(1-B)',colnames(x),sep='')))
for (i in 1:n-1) {
for (j in 1:k) {
x2[i,j] <- x[i+1,j] - x[i,j]
}
}
x <- x2
}
if (par2 == 'Include Monthly Dummies'){
x2 <- array(0, dim=c(n,11), dimnames=list(1:n, paste('M', seq(1:11), sep ='')))
for (i in 1:11){
x2[seq(i,n,12),i] <- 1
}
x <- cbind(x, x2)
}
if (par2 == 'Include Quarterly Dummies'){
x2 <- array(0, dim=c(n,3), dimnames=list(1:n, paste('Q', seq(1:3), sep ='')))
for (i in 1:3){
x2[seq(i,n,4),i] <- 1
}
x <- cbind(x, x2)
}
k <- length(x[1,])
if (par3 == 'Linear Trend'){
x <- cbind(x, c(1:n))
colnames(x)[k+1] <- 't'
}
x
k <- length(x[1,])
df <- as.data.frame(x)
(mylm <- lm(df))
(mysum <- summary(mylm))
if (n > n25) {
kp3 <- k + 3
nmkm3 <- n - k - 3
gqarr <- array(NA, dim=c(nmkm3-kp3+1,3))
numgqtests <- 0
numsignificant1 <- 0
numsignificant5 <- 0
numsignificant10 <- 0
for (mypoint in kp3:nmkm3) {
j <- 0
numgqtests <- numgqtests + 1
for (myalt in c('greater', 'two.sided', 'less')) {
j <- j + 1
gqarr[mypoint-kp3+1,j] <- gqtest(mylm, point=mypoint, alternative=myalt)$p.value
}
if (gqarr[mypoint-kp3+1,2] < 0.01) numsignificant1 <- numsignificant1 + 1
if (gqarr[mypoint-kp3+1,2] < 0.05) numsignificant5 <- numsignificant5 + 1
if (gqarr[mypoint-kp3+1,2] < 0.10) numsignificant10 <- numsignificant10 + 1
}
gqarr
}
bitmap(file='test0.png')
plot(x[,1], type='l', main='Actuals and Interpolation', ylab='value of Actuals and Interpolation (dots)', xlab='time or index')
points(x[,1]-mysum$resid)
grid()
dev.off()
bitmap(file='test1.png')
plot(mysum$resid, type='b', pch=19, main='Residuals', ylab='value of Residuals', xlab='time or index')
grid()
dev.off()
bitmap(file='test2.png')
hist(mysum$resid, main='Residual Histogram', xlab='values of Residuals')
grid()
dev.off()
bitmap(file='test3.png')
densityplot(~mysum$resid,col='black',main='Residual Density Plot', xlab='values of Residuals')
dev.off()
bitmap(file='test4.png')
qqnorm(mysum$resid, main='Residual Normal Q-Q Plot')
qqline(mysum$resid)
grid()
dev.off()
(myerror <- as.ts(mysum$resid))
bitmap(file='test5.png')
dum <- cbind(lag(myerror,k=1),myerror)
dum
dum1 <- dum[2:length(myerror),]
dum1
z <- as.data.frame(dum1)
z
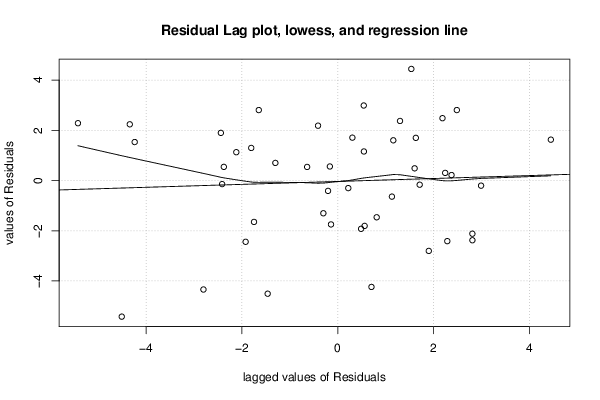
plot(z,main=paste('Residual Lag plot, lowess, and regression line'), ylab='values of Residuals', xlab='lagged values of Residuals')
lines(lowess(z))
abline(lm(z))
grid()
dev.off()
bitmap(file='test6.png')
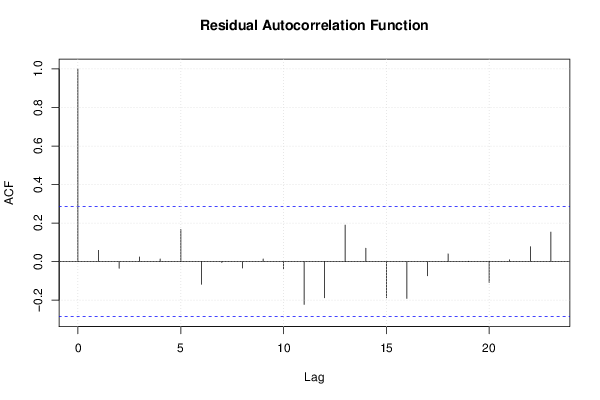
acf(mysum$resid, lag.max=length(mysum$resid)/2, main='Residual Autocorrelation Function')
grid()
dev.off()
bitmap(file='test7.png')
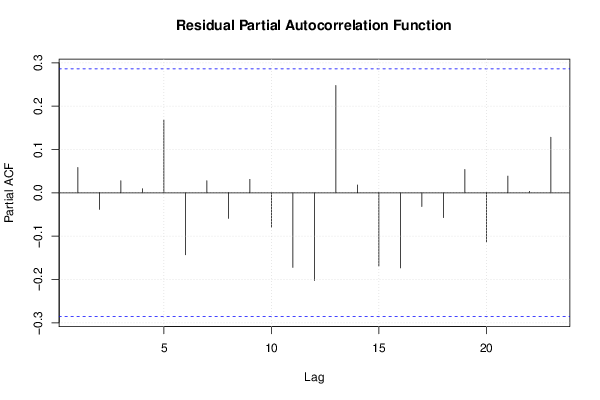
pacf(mysum$resid, lag.max=length(mysum$resid)/2, main='Residual Partial Autocorrelation Function')
grid()
dev.off()
bitmap(file='test8.png')
opar <- par(mfrow = c(2,2), oma = c(0, 0, 1.1, 0))
plot(mylm, las = 1, sub='Residual Diagnostics')
par(opar)
dev.off()
if (n > n25) {
bitmap(file='test9.png')
plot(kp3:nmkm3,gqarr[,2], main='Goldfeld-Quandt test',ylab='2-sided p-value',xlab='breakpoint')
grid()
dev.off()
}
load(file='createtable')
a<-table.start()
a<-table.row.start(a)
a<-table.element(a, 'Multiple Linear Regression - Estimated Regression Equation', 1, TRUE)
a<-table.row.end(a)
myeq <- colnames(x)[1]
myeq <- paste(myeq, '[t] = ', sep='')
for (i in 1:k){
if (mysum$coefficients[i,1] > 0) myeq <- paste(myeq, '+', '')
myeq <- paste(myeq, signif(mysum$coefficients[i,1],6), sep=' ')
if (rownames(mysum$coefficients)[i] != '(Intercept)') {
myeq <- paste(myeq, rownames(mysum$coefficients)[i], sep='')
if (rownames(mysum$coefficients)[i] != 't') myeq <- paste(myeq, '[t]', sep='')
}
}
myeq <- paste(myeq, ' + e[t]')
a<-table.row.start(a)
a<-table.element(a, myeq)
a<-table.row.end(a)
a<-table.end(a)
table.save(a,file='mytable1.tab')
a<-table.start()
a<-table.row.start(a)
a<-table.element(a,hyperlink('ols1.htm','Multiple Linear Regression - Ordinary Least Squares',''), 6, TRUE)
a<-table.row.end(a)
a<-table.row.start(a)
a<-table.element(a,'Variable',header=TRUE)
a<-table.element(a,'Parameter',header=TRUE)
a<-table.element(a,'S.D.',header=TRUE)
a<-table.element(a,'T-STAT
H0: parameter = 0',header=TRUE)
a<-table.element(a,'2-tail p-value',header=TRUE)
a<-table.element(a,'1-tail p-value',header=TRUE)
a<-table.row.end(a)
for (i in 1:k){
a<-table.row.start(a)
a<-table.element(a,rownames(mysum$coefficients)[i],header=TRUE)
a<-table.element(a,signif(mysum$coefficients[i,1],6))
a<-table.element(a, signif(mysum$coefficients[i,2],6))
a<-table.element(a, signif(mysum$coefficients[i,3],4))
a<-table.element(a, signif(mysum$coefficients[i,4],6))
a<-table.element(a, signif(mysum$coefficients[i,4]/2,6))
a<-table.row.end(a)
}
a<-table.end(a)
table.save(a,file='mytable2.tab')
a<-table.start()
a<-table.row.start(a)
a<-table.element(a, 'Multiple Linear Regression - Regression Statistics', 2, TRUE)
a<-table.row.end(a)
a<-table.row.start(a)
a<-table.element(a, 'Multiple R',1,TRUE)
a<-table.element(a, signif(sqrt(mysum$r.squared),6))
a<-table.row.end(a)
a<-table.row.start(a)
a<-table.element(a, 'R-squared',1,TRUE)
a<-table.element(a, signif(mysum$r.squared,6))
a<-table.row.end(a)
a<-table.row.start(a)
a<-table.element(a, 'Adjusted R-squared',1,TRUE)
a<-table.element(a, signif(mysum$adj.r.squared,6))
a<-table.row.end(a)
a<-table.row.start(a)
a<-table.element(a, 'F-TEST (value)',1,TRUE)
a<-table.element(a, signif(mysum$fstatistic[1],6))
a<-table.row.end(a)
a<-table.row.start(a)
a<-table.element(a, 'F-TEST (DF numerator)',1,TRUE)
a<-table.element(a, signif(mysum$fstatistic[2],6))
a<-table.row.end(a)
a<-table.row.start(a)
a<-table.element(a, 'F-TEST (DF denominator)',1,TRUE)
a<-table.element(a, signif(mysum$fstatistic[3],6))
a<-table.row.end(a)
a<-table.row.start(a)
a<-table.element(a, 'p-value',1,TRUE)
a<-table.element(a, signif(1-pf(mysum$fstatistic[1],mysum$fstatistic[2],mysum$fstatistic[3]),6))
a<-table.row.end(a)
a<-table.row.start(a)
a<-table.element(a, 'Multiple Linear Regression - Residual Statistics', 2, TRUE)
a<-table.row.end(a)
a<-table.row.start(a)
a<-table.element(a, 'Residual Standard Deviation',1,TRUE)
a<-table.element(a, signif(mysum$sigma,6))
a<-table.row.end(a)
a<-table.row.start(a)
a<-table.element(a, 'Sum Squared Residuals',1,TRUE)
a<-table.element(a, signif(sum(myerror*myerror),6))
a<-table.row.end(a)
a<-table.end(a)
table.save(a,file='mytable3.tab')
a<-table.start()
a<-table.row.start(a)
a<-table.element(a, 'Multiple Linear Regression - Actuals, Interpolation, and Residuals', 4, TRUE)
a<-table.row.end(a)
a<-table.row.start(a)
a<-table.element(a, 'Time or Index', 1, TRUE)
a<-table.element(a, 'Actuals', 1, TRUE)
a<-table.element(a, 'Interpolation
Forecast', 1, TRUE)
a<-table.element(a, 'Residuals
Prediction Error', 1, TRUE)
a<-table.row.end(a)
for (i in 1:n) {
a<-table.row.start(a)
a<-table.element(a,i, 1, TRUE)
a<-table.element(a,signif(x[i],6))
a<-table.element(a,signif(x[i]-mysum$resid[i],6))
a<-table.element(a,signif(mysum$resid[i],6))
a<-table.row.end(a)
}
a<-table.end(a)
table.save(a,file='mytable4.tab')
if (n > n25) {
a<-table.start()
a<-table.row.start(a)
a<-table.element(a,'Goldfeld-Quandt test for Heteroskedasticity',4,TRUE)
a<-table.row.end(a)
a<-table.row.start(a)
a<-table.element(a,'p-values',header=TRUE)
a<-table.element(a,'Alternative Hypothesis',3,header=TRUE)
a<-table.row.end(a)
a<-table.row.start(a)
a<-table.element(a,'breakpoint index',header=TRUE)
a<-table.element(a,'greater',header=TRUE)
a<-table.element(a,'2-sided',header=TRUE)
a<-table.element(a,'less',header=TRUE)
a<-table.row.end(a)
for (mypoint in kp3:nmkm3) {
a<-table.row.start(a)
a<-table.element(a,mypoint,header=TRUE)
a<-table.element(a,signif(gqarr[mypoint-kp3+1,1],6))
a<-table.element(a,signif(gqarr[mypoint-kp3+1,2],6))
a<-table.element(a,signif(gqarr[mypoint-kp3+1,3],6))
a<-table.row.end(a)
}
a<-table.end(a)
table.save(a,file='mytable5.tab')
a<-table.start()
a<-table.row.start(a)
a<-table.element(a,'Meta Analysis of Goldfeld-Quandt test for Heteroskedasticity',4,TRUE)
a<-table.row.end(a)
a<-table.row.start(a)
a<-table.element(a,'Description',header=TRUE)
a<-table.element(a,'# significant tests',header=TRUE)
a<-table.element(a,'% significant tests',header=TRUE)
a<-table.element(a,'OK/NOK',header=TRUE)
a<-table.row.end(a)
a<-table.row.start(a)
a<-table.element(a,'1% type I error level',header=TRUE)
a<-table.element(a,signif(numsignificant1,6))
a<-table.element(a,signif(numsignificant1/numgqtests,6))
if (numsignificant1/numgqtests < 0.01) dum <- 'OK' else dum <- 'NOK'
a<-table.element(a,dum)
a<-table.row.end(a)
a<-table.row.start(a)
a<-table.element(a,'5% type I error level',header=TRUE)
a<-table.element(a,signif(numsignificant5,6))
a<-table.element(a,signif(numsignificant5/numgqtests,6))
if (numsignificant5/numgqtests < 0.05) dum <- 'OK' else dum <- 'NOK'
a<-table.element(a,dum)
a<-table.row.end(a)
a<-table.row.start(a)
a<-table.element(a,'10% type I error level',header=TRUE)
a<-table.element(a,signif(numsignificant10,6))
a<-table.element(a,signif(numsignificant10/numgqtests,6))
if (numsignificant10/numgqtests < 0.1) dum <- 'OK' else dum <- 'NOK'
a<-table.element(a,dum)
a<-table.row.end(a)
a<-table.end(a)
table.save(a,file='mytable6.tab')
}