Free Statistics

of Irreproducible Research!

Author's title

Author*The author of this computation has been verified*
R Software Modulerwasp_multipleregression.wasp
Title produced by softwareMultiple Regression
Date of computationSun, 14 Dec 2014 15:27:52 +0000
Cite this page as followsStatistical Computations at FreeStatistics.org, Office for Research Development and Education, URL https://freestatistics.org/blog/index.php?v=date/2014/Dec/14/t1418570895ke44gyozqmckprm.htm/, Retrieved Thu, 16 May 2024 07:45:58 +0000
Statistical Computations at FreeStatistics.org, Office for Research Development and Education, URL https://freestatistics.org/blog/index.php?pk=267684, Retrieved Thu, 16 May 2024 07:45:58 +0000
QR Codes:

Original text written by user:
IsPrivate?No (this computation is public)
User-defined keywords
Estimated Impact79
Family? (F = Feedback message, R = changed R code, M = changed R Module, P = changed Parameters, D = changed Data)
-       [Multiple Regression] [fff] [2014-12-14 15:27:52] [624214a256768d6065ce8a528542dcc5] [Current]
Feedback Forum

Post a new message
Dataseries X:
12,2	57	62
7,4	67	71
6,7	43	54
12,6	52	65
13,3	43	52
11,1	84	84
8,2	67	42
11,4	49	66
6,4	70	65
10,6	52	78
11,9	43	66
9,6	56	61
6,4	65	71
13,8	63	69
13,8	57	72
11,7	63	68
10,9	53	70
16,1	57	68
9,9	64	67
9	58	72
9,7	43	69
10,8	51	71
10,3	53	62
12,7	56	64
9,3	61	58
5,9	39	52
11,4	48	59
13	50	68
10,8	35	76
12,3	30	65
11,8	49	59
7,9	61	69
12,3	47	63
11,6	56	75
6,7	50	63
10,9	43	60
12,1	67	73
13,3	62	63
10,1	57	70
14,3	54	66
13,3	48	63
9,3	61	64
15,9	43	61
9,1	44	62
13	58	61
14,5	46	66
14,6	66	56
12,6	38	59
7,7	53	71
4,3	59	71
11,8	58	64
11,2	60	66
12,6	52	62
5,6	34	65
9,9	69	68
7,7	48	60
7,3	58	65
11,4	57	68
13,6	42	64
7,9	64	74
10,7	58	69
8,3	26	68
9,6	61	72
14,2	52	67
11,1	61	66


Summary of computational transaction
Raw Inputview raw input (R code)
Raw Outputview raw output of R engine
Computing time4 seconds
R Server'George Udny Yule' @ yule.wessa.net

\begin{tabular}{lllllllll}
\hline
Summary of computational transaction \tabularnewline
Raw Input & view raw input (R code)  \tabularnewline
Raw Output & view raw output of R engine  \tabularnewline
Computing time & 4 seconds \tabularnewline
R Server & 'George Udny Yule' @ yule.wessa.net \tabularnewline
\hline
\end{tabular}
%Source: https://freestatistics.org/blog/index.php?pk=267684&T=0

[TABLE]
[ROW][C]Summary of computational transaction[/C][/ROW]
[ROW][C]Raw Input[/C][C]view raw input (R code) [/C][/ROW]
[ROW][C]Raw Output[/C][C]view raw output of R engine [/C][/ROW]
[ROW][C]Computing time[/C][C]4 seconds[/C][/ROW]
[ROW][C]R Server[/C][C]'George Udny Yule' @ yule.wessa.net[/C][/ROW]
[/TABLE]
Source: https://freestatistics.org/blog/index.php?pk=267684&T=0

Globally Unique Identifier (entire table): ba.freestatistics.org/blog/index.php?pk=267684&T=0

As an alternative you can also use a QR Code:  

The GUIDs for individual cells are displayed in the table below:

Summary of computational transaction
Raw Inputview raw input (R code)
Raw Outputview raw output of R engine
Computing time4 seconds
R Server'George Udny Yule' @ yule.wessa.net


Multiple Linear Regression - Estimated Regression Equation
TOT.M[t] = + 11.4035 -0.0150664AMS.I.M[t] + 0.00205809AMS.E.M[t] + e[t]

\begin{tabular}{lllllllll}
\hline
Multiple Linear Regression - Estimated Regression Equation \tabularnewline
TOT.M[t] =  +  11.4035 -0.0150664AMS.I.M[t] +  0.00205809AMS.E.M[t]  + e[t] \tabularnewline
\hline
\end{tabular}
%Source: https://freestatistics.org/blog/index.php?pk=267684&T=1

[TABLE]
[ROW][C]Multiple Linear Regression - Estimated Regression Equation[/C][/ROW]
[ROW][C]TOT.M[t] =  +  11.4035 -0.0150664AMS.I.M[t] +  0.00205809AMS.E.M[t]  + e[t][/C][/ROW]
[/TABLE]
Source: https://freestatistics.org/blog/index.php?pk=267684&T=1

Globally Unique Identifier (entire table): ba.freestatistics.org/blog/index.php?pk=267684&T=1

As an alternative you can also use a QR Code:  

The GUIDs for individual cells are displayed in the table below:

Multiple Linear Regression - Estimated Regression Equation
TOT.M[t] = + 11.4035 -0.0150664AMS.I.M[t] + 0.00205809AMS.E.M[t] + e[t]


Multiple Linear Regression - Ordinary Least Squares
VariableParameterS.D.T-STATH0: parameter = 02-tail p-value1-tail p-value
(Intercept)11.40353.452753.3030.001592480.00079624
AMS.I.M-0.01506640.0332979-0.45250.6525080.326254
AMS.E.M0.002058090.0526640.039080.9689520.484476

\begin{tabular}{lllllllll}
\hline
Multiple Linear Regression - Ordinary Least Squares \tabularnewline
Variable & Parameter & S.D. & T-STATH0: parameter = 0 & 2-tail p-value & 1-tail p-value \tabularnewline
(Intercept) & 11.4035 & 3.45275 & 3.303 & 0.00159248 & 0.00079624 \tabularnewline
AMS.I.M & -0.0150664 & 0.0332979 & -0.4525 & 0.652508 & 0.326254 \tabularnewline
AMS.E.M & 0.00205809 & 0.052664 & 0.03908 & 0.968952 & 0.484476 \tabularnewline
\hline
\end{tabular}
%Source: https://freestatistics.org/blog/index.php?pk=267684&T=2

[TABLE]
[ROW][C]Multiple Linear Regression - Ordinary Least Squares[/C][/ROW]
[ROW][C]Variable[/C][C]Parameter[/C][C]S.D.[/C][C]T-STATH0: parameter = 0[/C][C]2-tail p-value[/C][C]1-tail p-value[/C][/ROW]
[ROW][C](Intercept)[/C][C]11.4035[/C][C]3.45275[/C][C]3.303[/C][C]0.00159248[/C][C]0.00079624[/C][/ROW]
[ROW][C]AMS.I.M[/C][C]-0.0150664[/C][C]0.0332979[/C][C]-0.4525[/C][C]0.652508[/C][C]0.326254[/C][/ROW]
[ROW][C]AMS.E.M[/C][C]0.00205809[/C][C]0.052664[/C][C]0.03908[/C][C]0.968952[/C][C]0.484476[/C][/ROW]
[/TABLE]
Source: https://freestatistics.org/blog/index.php?pk=267684&T=2

Globally Unique Identifier (entire table): ba.freestatistics.org/blog/index.php?pk=267684&T=2

As an alternative you can also use a QR Code:  

The GUIDs for individual cells are displayed in the table below:

Multiple Linear Regression - Ordinary Least Squares
VariableParameterS.D.T-STATH0: parameter = 02-tail p-value1-tail p-value
(Intercept)11.40353.452753.3030.001592480.00079624
AMS.I.M-0.01506640.0332979-0.45250.6525080.326254
AMS.E.M0.002058090.0526640.039080.9689520.484476


Multiple Linear Regression - Regression Statistics
Multiple R0.0583681
R-squared0.00340684
Adjusted R-squared-0.0287413
F-TEST (value)0.105973
F-TEST (DF numerator)2
F-TEST (DF denominator)62
p-value0.899612
Multiple Linear Regression - Residual Statistics
Residual Standard Deviation2.66907
Sum Squared Residuals441.685

\begin{tabular}{lllllllll}
\hline
Multiple Linear Regression - Regression Statistics \tabularnewline
Multiple R & 0.0583681 \tabularnewline
R-squared & 0.00340684 \tabularnewline
Adjusted R-squared & -0.0287413 \tabularnewline
F-TEST (value) & 0.105973 \tabularnewline
F-TEST (DF numerator) & 2 \tabularnewline
F-TEST (DF denominator) & 62 \tabularnewline
p-value & 0.899612 \tabularnewline
Multiple Linear Regression - Residual Statistics \tabularnewline
Residual Standard Deviation & 2.66907 \tabularnewline
Sum Squared Residuals & 441.685 \tabularnewline
\hline
\end{tabular}
%Source: https://freestatistics.org/blog/index.php?pk=267684&T=3

[TABLE]
[ROW][C]Multiple Linear Regression - Regression Statistics[/C][/ROW]
[ROW][C]Multiple R[/C][C]0.0583681[/C][/ROW]
[ROW][C]R-squared[/C][C]0.00340684[/C][/ROW]
[ROW][C]Adjusted R-squared[/C][C]-0.0287413[/C][/ROW]
[ROW][C]F-TEST (value)[/C][C]0.105973[/C][/ROW]
[ROW][C]F-TEST (DF numerator)[/C][C]2[/C][/ROW]
[ROW][C]F-TEST (DF denominator)[/C][C]62[/C][/ROW]
[ROW][C]p-value[/C][C]0.899612[/C][/ROW]
[ROW][C]Multiple Linear Regression - Residual Statistics[/C][/ROW]
[ROW][C]Residual Standard Deviation[/C][C]2.66907[/C][/ROW]
[ROW][C]Sum Squared Residuals[/C][C]441.685[/C][/ROW]
[/TABLE]
Source: https://freestatistics.org/blog/index.php?pk=267684&T=3

Globally Unique Identifier (entire table): ba.freestatistics.org/blog/index.php?pk=267684&T=3

As an alternative you can also use a QR Code:  

The GUIDs for individual cells are displayed in the table below:

Multiple Linear Regression - Regression Statistics
Multiple R0.0583681
R-squared0.00340684
Adjusted R-squared-0.0287413
F-TEST (value)0.105973
F-TEST (DF numerator)2
F-TEST (DF denominator)62
p-value0.899612
Multiple Linear Regression - Residual Statistics
Residual Standard Deviation2.66907
Sum Squared Residuals441.685


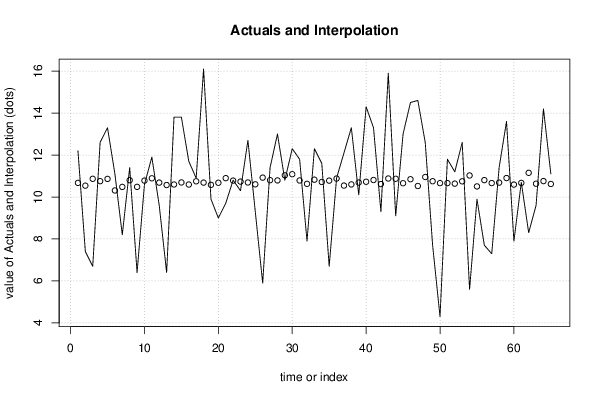
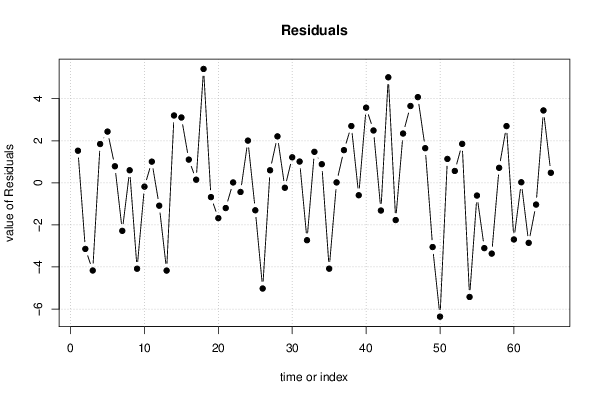
Multiple Linear Regression - Actuals, Interpolation, and Residuals
Time or IndexActualsInterpolationForecastResidualsPrediction Error
112.210.67231.52765
27.410.5402-3.1402
36.710.8668-4.16681
412.610.75391.84615
513.310.86272.43731
611.110.31080.789169
78.210.4805-2.28052
811.410.80110.598891
96.410.4827-4.08266
1010.610.7806-0.180606
1111.910.89151.00849
129.610.6854-1.08535
136.410.5703-4.17034
1413.810.59643.20365
1513.810.69293.10707
1611.710.59431.1057
1710.910.74910.150925
1816.110.68475.41531
199.910.5772-0.677171
20910.6779-1.67786
219.710.8977-1.19768
2210.810.78130.0187338
2310.310.7326-0.432611
2412.710.69152.00847
259.310.6038-1.30385
265.910.923-5.02296
2711.410.80180.598232
281310.79022.20984
2910.811.0326-0.232619
3012.311.08531.21469
3111.810.78671.0133
327.910.6265-2.72649
3312.310.82511.47493
3411.610.71420.885833
356.710.7799-4.07987
3610.910.87920.0208417
3712.110.54431.55568
3813.310.59912.70093
3910.110.6888-0.58881
4014.310.72583.57422
4113.310.812.49
429.310.6162-1.3162
4315.910.88125.01878
449.110.8682-1.76821
451310.65522.34478
4614.510.84633.65369
4714.610.52444.0756
4812.610.95241.64757
497.710.7511-3.05113
504.310.6607-6.36074
5111.810.66141.13861
5211.210.63540.564622
5312.610.74771.85232
545.611.025-5.42505
559.910.5039-0.603897
567.710.8038-3.10383
577.310.6635-3.36345
5811.410.68470.715306
5913.610.90252.69754
607.910.5916-2.69158
6110.710.67170.0283146
628.311.1518-2.85175
639.610.6327-1.03266
6414.210.7583.44203
6511.110.62030.479688

\begin{tabular}{lllllllll}
\hline
Multiple Linear Regression - Actuals, Interpolation, and Residuals \tabularnewline
Time or Index & Actuals & InterpolationForecast & ResidualsPrediction Error \tabularnewline
1 & 12.2 & 10.6723 & 1.52765 \tabularnewline
2 & 7.4 & 10.5402 & -3.1402 \tabularnewline
3 & 6.7 & 10.8668 & -4.16681 \tabularnewline
4 & 12.6 & 10.7539 & 1.84615 \tabularnewline
5 & 13.3 & 10.8627 & 2.43731 \tabularnewline
6 & 11.1 & 10.3108 & 0.789169 \tabularnewline
7 & 8.2 & 10.4805 & -2.28052 \tabularnewline
8 & 11.4 & 10.8011 & 0.598891 \tabularnewline
9 & 6.4 & 10.4827 & -4.08266 \tabularnewline
10 & 10.6 & 10.7806 & -0.180606 \tabularnewline
11 & 11.9 & 10.8915 & 1.00849 \tabularnewline
12 & 9.6 & 10.6854 & -1.08535 \tabularnewline
13 & 6.4 & 10.5703 & -4.17034 \tabularnewline
14 & 13.8 & 10.5964 & 3.20365 \tabularnewline
15 & 13.8 & 10.6929 & 3.10707 \tabularnewline
16 & 11.7 & 10.5943 & 1.1057 \tabularnewline
17 & 10.9 & 10.7491 & 0.150925 \tabularnewline
18 & 16.1 & 10.6847 & 5.41531 \tabularnewline
19 & 9.9 & 10.5772 & -0.677171 \tabularnewline
20 & 9 & 10.6779 & -1.67786 \tabularnewline
21 & 9.7 & 10.8977 & -1.19768 \tabularnewline
22 & 10.8 & 10.7813 & 0.0187338 \tabularnewline
23 & 10.3 & 10.7326 & -0.432611 \tabularnewline
24 & 12.7 & 10.6915 & 2.00847 \tabularnewline
25 & 9.3 & 10.6038 & -1.30385 \tabularnewline
26 & 5.9 & 10.923 & -5.02296 \tabularnewline
27 & 11.4 & 10.8018 & 0.598232 \tabularnewline
28 & 13 & 10.7902 & 2.20984 \tabularnewline
29 & 10.8 & 11.0326 & -0.232619 \tabularnewline
30 & 12.3 & 11.0853 & 1.21469 \tabularnewline
31 & 11.8 & 10.7867 & 1.0133 \tabularnewline
32 & 7.9 & 10.6265 & -2.72649 \tabularnewline
33 & 12.3 & 10.8251 & 1.47493 \tabularnewline
34 & 11.6 & 10.7142 & 0.885833 \tabularnewline
35 & 6.7 & 10.7799 & -4.07987 \tabularnewline
36 & 10.9 & 10.8792 & 0.0208417 \tabularnewline
37 & 12.1 & 10.5443 & 1.55568 \tabularnewline
38 & 13.3 & 10.5991 & 2.70093 \tabularnewline
39 & 10.1 & 10.6888 & -0.58881 \tabularnewline
40 & 14.3 & 10.7258 & 3.57422 \tabularnewline
41 & 13.3 & 10.81 & 2.49 \tabularnewline
42 & 9.3 & 10.6162 & -1.3162 \tabularnewline
43 & 15.9 & 10.8812 & 5.01878 \tabularnewline
44 & 9.1 & 10.8682 & -1.76821 \tabularnewline
45 & 13 & 10.6552 & 2.34478 \tabularnewline
46 & 14.5 & 10.8463 & 3.65369 \tabularnewline
47 & 14.6 & 10.5244 & 4.0756 \tabularnewline
48 & 12.6 & 10.9524 & 1.64757 \tabularnewline
49 & 7.7 & 10.7511 & -3.05113 \tabularnewline
50 & 4.3 & 10.6607 & -6.36074 \tabularnewline
51 & 11.8 & 10.6614 & 1.13861 \tabularnewline
52 & 11.2 & 10.6354 & 0.564622 \tabularnewline
53 & 12.6 & 10.7477 & 1.85232 \tabularnewline
54 & 5.6 & 11.025 & -5.42505 \tabularnewline
55 & 9.9 & 10.5039 & -0.603897 \tabularnewline
56 & 7.7 & 10.8038 & -3.10383 \tabularnewline
57 & 7.3 & 10.6635 & -3.36345 \tabularnewline
58 & 11.4 & 10.6847 & 0.715306 \tabularnewline
59 & 13.6 & 10.9025 & 2.69754 \tabularnewline
60 & 7.9 & 10.5916 & -2.69158 \tabularnewline
61 & 10.7 & 10.6717 & 0.0283146 \tabularnewline
62 & 8.3 & 11.1518 & -2.85175 \tabularnewline
63 & 9.6 & 10.6327 & -1.03266 \tabularnewline
64 & 14.2 & 10.758 & 3.44203 \tabularnewline
65 & 11.1 & 10.6203 & 0.479688 \tabularnewline
\hline
\end{tabular}
%Source: https://freestatistics.org/blog/index.php?pk=267684&T=4

[TABLE]
[ROW][C]Multiple Linear Regression - Actuals, Interpolation, and Residuals[/C][/ROW]
[ROW][C]Time or Index[/C][C]Actuals[/C][C]InterpolationForecast[/C][C]ResidualsPrediction Error[/C][/ROW]
[ROW][C]1[/C][C]12.2[/C][C]10.6723[/C][C]1.52765[/C][/ROW]
[ROW][C]2[/C][C]7.4[/C][C]10.5402[/C][C]-3.1402[/C][/ROW]
[ROW][C]3[/C][C]6.7[/C][C]10.8668[/C][C]-4.16681[/C][/ROW]
[ROW][C]4[/C][C]12.6[/C][C]10.7539[/C][C]1.84615[/C][/ROW]
[ROW][C]5[/C][C]13.3[/C][C]10.8627[/C][C]2.43731[/C][/ROW]
[ROW][C]6[/C][C]11.1[/C][C]10.3108[/C][C]0.789169[/C][/ROW]
[ROW][C]7[/C][C]8.2[/C][C]10.4805[/C][C]-2.28052[/C][/ROW]
[ROW][C]8[/C][C]11.4[/C][C]10.8011[/C][C]0.598891[/C][/ROW]
[ROW][C]9[/C][C]6.4[/C][C]10.4827[/C][C]-4.08266[/C][/ROW]
[ROW][C]10[/C][C]10.6[/C][C]10.7806[/C][C]-0.180606[/C][/ROW]
[ROW][C]11[/C][C]11.9[/C][C]10.8915[/C][C]1.00849[/C][/ROW]
[ROW][C]12[/C][C]9.6[/C][C]10.6854[/C][C]-1.08535[/C][/ROW]
[ROW][C]13[/C][C]6.4[/C][C]10.5703[/C][C]-4.17034[/C][/ROW]
[ROW][C]14[/C][C]13.8[/C][C]10.5964[/C][C]3.20365[/C][/ROW]
[ROW][C]15[/C][C]13.8[/C][C]10.6929[/C][C]3.10707[/C][/ROW]
[ROW][C]16[/C][C]11.7[/C][C]10.5943[/C][C]1.1057[/C][/ROW]
[ROW][C]17[/C][C]10.9[/C][C]10.7491[/C][C]0.150925[/C][/ROW]
[ROW][C]18[/C][C]16.1[/C][C]10.6847[/C][C]5.41531[/C][/ROW]
[ROW][C]19[/C][C]9.9[/C][C]10.5772[/C][C]-0.677171[/C][/ROW]
[ROW][C]20[/C][C]9[/C][C]10.6779[/C][C]-1.67786[/C][/ROW]
[ROW][C]21[/C][C]9.7[/C][C]10.8977[/C][C]-1.19768[/C][/ROW]
[ROW][C]22[/C][C]10.8[/C][C]10.7813[/C][C]0.0187338[/C][/ROW]
[ROW][C]23[/C][C]10.3[/C][C]10.7326[/C][C]-0.432611[/C][/ROW]
[ROW][C]24[/C][C]12.7[/C][C]10.6915[/C][C]2.00847[/C][/ROW]
[ROW][C]25[/C][C]9.3[/C][C]10.6038[/C][C]-1.30385[/C][/ROW]
[ROW][C]26[/C][C]5.9[/C][C]10.923[/C][C]-5.02296[/C][/ROW]
[ROW][C]27[/C][C]11.4[/C][C]10.8018[/C][C]0.598232[/C][/ROW]
[ROW][C]28[/C][C]13[/C][C]10.7902[/C][C]2.20984[/C][/ROW]
[ROW][C]29[/C][C]10.8[/C][C]11.0326[/C][C]-0.232619[/C][/ROW]
[ROW][C]30[/C][C]12.3[/C][C]11.0853[/C][C]1.21469[/C][/ROW]
[ROW][C]31[/C][C]11.8[/C][C]10.7867[/C][C]1.0133[/C][/ROW]
[ROW][C]32[/C][C]7.9[/C][C]10.6265[/C][C]-2.72649[/C][/ROW]
[ROW][C]33[/C][C]12.3[/C][C]10.8251[/C][C]1.47493[/C][/ROW]
[ROW][C]34[/C][C]11.6[/C][C]10.7142[/C][C]0.885833[/C][/ROW]
[ROW][C]35[/C][C]6.7[/C][C]10.7799[/C][C]-4.07987[/C][/ROW]
[ROW][C]36[/C][C]10.9[/C][C]10.8792[/C][C]0.0208417[/C][/ROW]
[ROW][C]37[/C][C]12.1[/C][C]10.5443[/C][C]1.55568[/C][/ROW]
[ROW][C]38[/C][C]13.3[/C][C]10.5991[/C][C]2.70093[/C][/ROW]
[ROW][C]39[/C][C]10.1[/C][C]10.6888[/C][C]-0.58881[/C][/ROW]
[ROW][C]40[/C][C]14.3[/C][C]10.7258[/C][C]3.57422[/C][/ROW]
[ROW][C]41[/C][C]13.3[/C][C]10.81[/C][C]2.49[/C][/ROW]
[ROW][C]42[/C][C]9.3[/C][C]10.6162[/C][C]-1.3162[/C][/ROW]
[ROW][C]43[/C][C]15.9[/C][C]10.8812[/C][C]5.01878[/C][/ROW]
[ROW][C]44[/C][C]9.1[/C][C]10.8682[/C][C]-1.76821[/C][/ROW]
[ROW][C]45[/C][C]13[/C][C]10.6552[/C][C]2.34478[/C][/ROW]
[ROW][C]46[/C][C]14.5[/C][C]10.8463[/C][C]3.65369[/C][/ROW]
[ROW][C]47[/C][C]14.6[/C][C]10.5244[/C][C]4.0756[/C][/ROW]
[ROW][C]48[/C][C]12.6[/C][C]10.9524[/C][C]1.64757[/C][/ROW]
[ROW][C]49[/C][C]7.7[/C][C]10.7511[/C][C]-3.05113[/C][/ROW]
[ROW][C]50[/C][C]4.3[/C][C]10.6607[/C][C]-6.36074[/C][/ROW]
[ROW][C]51[/C][C]11.8[/C][C]10.6614[/C][C]1.13861[/C][/ROW]
[ROW][C]52[/C][C]11.2[/C][C]10.6354[/C][C]0.564622[/C][/ROW]
[ROW][C]53[/C][C]12.6[/C][C]10.7477[/C][C]1.85232[/C][/ROW]
[ROW][C]54[/C][C]5.6[/C][C]11.025[/C][C]-5.42505[/C][/ROW]
[ROW][C]55[/C][C]9.9[/C][C]10.5039[/C][C]-0.603897[/C][/ROW]
[ROW][C]56[/C][C]7.7[/C][C]10.8038[/C][C]-3.10383[/C][/ROW]
[ROW][C]57[/C][C]7.3[/C][C]10.6635[/C][C]-3.36345[/C][/ROW]
[ROW][C]58[/C][C]11.4[/C][C]10.6847[/C][C]0.715306[/C][/ROW]
[ROW][C]59[/C][C]13.6[/C][C]10.9025[/C][C]2.69754[/C][/ROW]
[ROW][C]60[/C][C]7.9[/C][C]10.5916[/C][C]-2.69158[/C][/ROW]
[ROW][C]61[/C][C]10.7[/C][C]10.6717[/C][C]0.0283146[/C][/ROW]
[ROW][C]62[/C][C]8.3[/C][C]11.1518[/C][C]-2.85175[/C][/ROW]
[ROW][C]63[/C][C]9.6[/C][C]10.6327[/C][C]-1.03266[/C][/ROW]
[ROW][C]64[/C][C]14.2[/C][C]10.758[/C][C]3.44203[/C][/ROW]
[ROW][C]65[/C][C]11.1[/C][C]10.6203[/C][C]0.479688[/C][/ROW]
[/TABLE]
Source: https://freestatistics.org/blog/index.php?pk=267684&T=4

Globally Unique Identifier (entire table): ba.freestatistics.org/blog/index.php?pk=267684&T=4

As an alternative you can also use a QR Code:  

The GUIDs for individual cells are displayed in the table below:

Multiple Linear Regression - Actuals, Interpolation, and Residuals
Time or IndexActualsInterpolationForecastResidualsPrediction Error
112.210.67231.52765
27.410.5402-3.1402
36.710.8668-4.16681
412.610.75391.84615
513.310.86272.43731
611.110.31080.789169
78.210.4805-2.28052
811.410.80110.598891
96.410.4827-4.08266
1010.610.7806-0.180606
1111.910.89151.00849
129.610.6854-1.08535
136.410.5703-4.17034
1413.810.59643.20365
1513.810.69293.10707
1611.710.59431.1057
1710.910.74910.150925
1816.110.68475.41531
199.910.5772-0.677171
20910.6779-1.67786
219.710.8977-1.19768
2210.810.78130.0187338
2310.310.7326-0.432611
2412.710.69152.00847
259.310.6038-1.30385
265.910.923-5.02296
2711.410.80180.598232
281310.79022.20984
2910.811.0326-0.232619
3012.311.08531.21469
3111.810.78671.0133
327.910.6265-2.72649
3312.310.82511.47493
3411.610.71420.885833
356.710.7799-4.07987
3610.910.87920.0208417
3712.110.54431.55568
3813.310.59912.70093
3910.110.6888-0.58881
4014.310.72583.57422
4113.310.812.49
429.310.6162-1.3162
4315.910.88125.01878
449.110.8682-1.76821
451310.65522.34478
4614.510.84633.65369
4714.610.52444.0756
4812.610.95241.64757
497.710.7511-3.05113
504.310.6607-6.36074
5111.810.66141.13861
5211.210.63540.564622
5312.610.74771.85232
545.611.025-5.42505
559.910.5039-0.603897
567.710.8038-3.10383
577.310.6635-3.36345
5811.410.68470.715306
5913.610.90252.69754
607.910.5916-2.69158
6110.710.67170.0283146
628.311.1518-2.85175
639.610.6327-1.03266
6414.210.7583.44203
6511.110.62030.479688


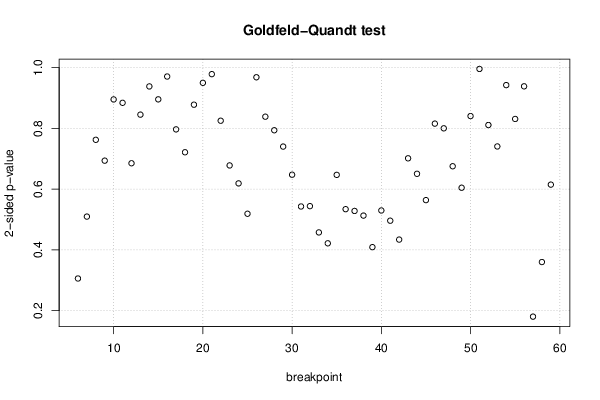
Goldfeld-Quandt test for Heteroskedasticity
p-valuesAlternative Hypothesis
breakpoint indexgreater2-sidedless
60.8470970.3058070.152903
70.7451860.5096280.254814
80.6187220.7625560.381278
90.6530820.6938360.346918
100.5522360.8955290.447764
110.4421940.8843880.557806
120.3426340.6852670.657366
130.4227070.8454150.577293
140.5308020.9383960.469198
150.552080.8958390.44792
160.4855170.9710350.514483
170.3984630.7969260.601537
180.6392170.7215650.360783
190.5609340.8781310.439066
200.5248690.9502610.475131
210.4894130.9788250.510587
220.4126870.8253740.587313
230.3390640.6781290.660936
240.3095220.6190430.690478
250.2595310.5190630.740469
260.4842750.968550.515725
270.419350.8387010.58065
280.3970270.7940540.602973
290.3701440.7402890.629856
300.323770.647540.67623
310.2714770.5429530.728523
320.2720420.5440850.727958
330.2287820.4575640.771218
340.2108540.4217070.789146
350.3235360.6470720.676464
360.2670640.5341270.732936
370.2641280.5282570.735872
380.2564860.5129720.743514
390.204510.4090210.79549
400.264870.5297410.73513
410.2480470.4960950.751953
420.2169530.4339060.783047
430.3508130.7016260.649187
440.3252730.6505470.674727
450.2819890.5639790.718011
460.4079150.815830.592085
470.4002110.8004230.599789
480.3377310.6754630.662269
490.3023340.6046670.697666
500.579650.8407010.42035
510.4979630.9959260.502037
520.4056310.8112610.594369
530.3703540.7407070.629646
540.5286490.9427020.471351
550.4156090.8312170.584391
560.5306690.9386620.469331
570.9099450.180110.0900549
580.8200130.3599750.179987
590.6925580.6148840.307442

\begin{tabular}{lllllllll}
\hline
Goldfeld-Quandt test for Heteroskedasticity \tabularnewline
p-values & Alternative Hypothesis \tabularnewline
breakpoint index & greater & 2-sided & less \tabularnewline
6 & 0.847097 & 0.305807 & 0.152903 \tabularnewline
7 & 0.745186 & 0.509628 & 0.254814 \tabularnewline
8 & 0.618722 & 0.762556 & 0.381278 \tabularnewline
9 & 0.653082 & 0.693836 & 0.346918 \tabularnewline
10 & 0.552236 & 0.895529 & 0.447764 \tabularnewline
11 & 0.442194 & 0.884388 & 0.557806 \tabularnewline
12 & 0.342634 & 0.685267 & 0.657366 \tabularnewline
13 & 0.422707 & 0.845415 & 0.577293 \tabularnewline
14 & 0.530802 & 0.938396 & 0.469198 \tabularnewline
15 & 0.55208 & 0.895839 & 0.44792 \tabularnewline
16 & 0.485517 & 0.971035 & 0.514483 \tabularnewline
17 & 0.398463 & 0.796926 & 0.601537 \tabularnewline
18 & 0.639217 & 0.721565 & 0.360783 \tabularnewline
19 & 0.560934 & 0.878131 & 0.439066 \tabularnewline
20 & 0.524869 & 0.950261 & 0.475131 \tabularnewline
21 & 0.489413 & 0.978825 & 0.510587 \tabularnewline
22 & 0.412687 & 0.825374 & 0.587313 \tabularnewline
23 & 0.339064 & 0.678129 & 0.660936 \tabularnewline
24 & 0.309522 & 0.619043 & 0.690478 \tabularnewline
25 & 0.259531 & 0.519063 & 0.740469 \tabularnewline
26 & 0.484275 & 0.96855 & 0.515725 \tabularnewline
27 & 0.41935 & 0.838701 & 0.58065 \tabularnewline
28 & 0.397027 & 0.794054 & 0.602973 \tabularnewline
29 & 0.370144 & 0.740289 & 0.629856 \tabularnewline
30 & 0.32377 & 0.64754 & 0.67623 \tabularnewline
31 & 0.271477 & 0.542953 & 0.728523 \tabularnewline
32 & 0.272042 & 0.544085 & 0.727958 \tabularnewline
33 & 0.228782 & 0.457564 & 0.771218 \tabularnewline
34 & 0.210854 & 0.421707 & 0.789146 \tabularnewline
35 & 0.323536 & 0.647072 & 0.676464 \tabularnewline
36 & 0.267064 & 0.534127 & 0.732936 \tabularnewline
37 & 0.264128 & 0.528257 & 0.735872 \tabularnewline
38 & 0.256486 & 0.512972 & 0.743514 \tabularnewline
39 & 0.20451 & 0.409021 & 0.79549 \tabularnewline
40 & 0.26487 & 0.529741 & 0.73513 \tabularnewline
41 & 0.248047 & 0.496095 & 0.751953 \tabularnewline
42 & 0.216953 & 0.433906 & 0.783047 \tabularnewline
43 & 0.350813 & 0.701626 & 0.649187 \tabularnewline
44 & 0.325273 & 0.650547 & 0.674727 \tabularnewline
45 & 0.281989 & 0.563979 & 0.718011 \tabularnewline
46 & 0.407915 & 0.81583 & 0.592085 \tabularnewline
47 & 0.400211 & 0.800423 & 0.599789 \tabularnewline
48 & 0.337731 & 0.675463 & 0.662269 \tabularnewline
49 & 0.302334 & 0.604667 & 0.697666 \tabularnewline
50 & 0.57965 & 0.840701 & 0.42035 \tabularnewline
51 & 0.497963 & 0.995926 & 0.502037 \tabularnewline
52 & 0.405631 & 0.811261 & 0.594369 \tabularnewline
53 & 0.370354 & 0.740707 & 0.629646 \tabularnewline
54 & 0.528649 & 0.942702 & 0.471351 \tabularnewline
55 & 0.415609 & 0.831217 & 0.584391 \tabularnewline
56 & 0.530669 & 0.938662 & 0.469331 \tabularnewline
57 & 0.909945 & 0.18011 & 0.0900549 \tabularnewline
58 & 0.820013 & 0.359975 & 0.179987 \tabularnewline
59 & 0.692558 & 0.614884 & 0.307442 \tabularnewline
\hline
\end{tabular}
%Source: https://freestatistics.org/blog/index.php?pk=267684&T=5

[TABLE]
[ROW][C]Goldfeld-Quandt test for Heteroskedasticity[/C][/ROW]
[ROW][C]p-values[/C][C]Alternative Hypothesis[/C][/ROW]
[ROW][C]breakpoint index[/C][C]greater[/C][C]2-sided[/C][C]less[/C][/ROW]
[ROW][C]6[/C][C]0.847097[/C][C]0.305807[/C][C]0.152903[/C][/ROW]
[ROW][C]7[/C][C]0.745186[/C][C]0.509628[/C][C]0.254814[/C][/ROW]
[ROW][C]8[/C][C]0.618722[/C][C]0.762556[/C][C]0.381278[/C][/ROW]
[ROW][C]9[/C][C]0.653082[/C][C]0.693836[/C][C]0.346918[/C][/ROW]
[ROW][C]10[/C][C]0.552236[/C][C]0.895529[/C][C]0.447764[/C][/ROW]
[ROW][C]11[/C][C]0.442194[/C][C]0.884388[/C][C]0.557806[/C][/ROW]
[ROW][C]12[/C][C]0.342634[/C][C]0.685267[/C][C]0.657366[/C][/ROW]
[ROW][C]13[/C][C]0.422707[/C][C]0.845415[/C][C]0.577293[/C][/ROW]
[ROW][C]14[/C][C]0.530802[/C][C]0.938396[/C][C]0.469198[/C][/ROW]
[ROW][C]15[/C][C]0.55208[/C][C]0.895839[/C][C]0.44792[/C][/ROW]
[ROW][C]16[/C][C]0.485517[/C][C]0.971035[/C][C]0.514483[/C][/ROW]
[ROW][C]17[/C][C]0.398463[/C][C]0.796926[/C][C]0.601537[/C][/ROW]
[ROW][C]18[/C][C]0.639217[/C][C]0.721565[/C][C]0.360783[/C][/ROW]
[ROW][C]19[/C][C]0.560934[/C][C]0.878131[/C][C]0.439066[/C][/ROW]
[ROW][C]20[/C][C]0.524869[/C][C]0.950261[/C][C]0.475131[/C][/ROW]
[ROW][C]21[/C][C]0.489413[/C][C]0.978825[/C][C]0.510587[/C][/ROW]
[ROW][C]22[/C][C]0.412687[/C][C]0.825374[/C][C]0.587313[/C][/ROW]
[ROW][C]23[/C][C]0.339064[/C][C]0.678129[/C][C]0.660936[/C][/ROW]
[ROW][C]24[/C][C]0.309522[/C][C]0.619043[/C][C]0.690478[/C][/ROW]
[ROW][C]25[/C][C]0.259531[/C][C]0.519063[/C][C]0.740469[/C][/ROW]
[ROW][C]26[/C][C]0.484275[/C][C]0.96855[/C][C]0.515725[/C][/ROW]
[ROW][C]27[/C][C]0.41935[/C][C]0.838701[/C][C]0.58065[/C][/ROW]
[ROW][C]28[/C][C]0.397027[/C][C]0.794054[/C][C]0.602973[/C][/ROW]
[ROW][C]29[/C][C]0.370144[/C][C]0.740289[/C][C]0.629856[/C][/ROW]
[ROW][C]30[/C][C]0.32377[/C][C]0.64754[/C][C]0.67623[/C][/ROW]
[ROW][C]31[/C][C]0.271477[/C][C]0.542953[/C][C]0.728523[/C][/ROW]
[ROW][C]32[/C][C]0.272042[/C][C]0.544085[/C][C]0.727958[/C][/ROW]
[ROW][C]33[/C][C]0.228782[/C][C]0.457564[/C][C]0.771218[/C][/ROW]
[ROW][C]34[/C][C]0.210854[/C][C]0.421707[/C][C]0.789146[/C][/ROW]
[ROW][C]35[/C][C]0.323536[/C][C]0.647072[/C][C]0.676464[/C][/ROW]
[ROW][C]36[/C][C]0.267064[/C][C]0.534127[/C][C]0.732936[/C][/ROW]
[ROW][C]37[/C][C]0.264128[/C][C]0.528257[/C][C]0.735872[/C][/ROW]
[ROW][C]38[/C][C]0.256486[/C][C]0.512972[/C][C]0.743514[/C][/ROW]
[ROW][C]39[/C][C]0.20451[/C][C]0.409021[/C][C]0.79549[/C][/ROW]
[ROW][C]40[/C][C]0.26487[/C][C]0.529741[/C][C]0.73513[/C][/ROW]
[ROW][C]41[/C][C]0.248047[/C][C]0.496095[/C][C]0.751953[/C][/ROW]
[ROW][C]42[/C][C]0.216953[/C][C]0.433906[/C][C]0.783047[/C][/ROW]
[ROW][C]43[/C][C]0.350813[/C][C]0.701626[/C][C]0.649187[/C][/ROW]
[ROW][C]44[/C][C]0.325273[/C][C]0.650547[/C][C]0.674727[/C][/ROW]
[ROW][C]45[/C][C]0.281989[/C][C]0.563979[/C][C]0.718011[/C][/ROW]
[ROW][C]46[/C][C]0.407915[/C][C]0.81583[/C][C]0.592085[/C][/ROW]
[ROW][C]47[/C][C]0.400211[/C][C]0.800423[/C][C]0.599789[/C][/ROW]
[ROW][C]48[/C][C]0.337731[/C][C]0.675463[/C][C]0.662269[/C][/ROW]
[ROW][C]49[/C][C]0.302334[/C][C]0.604667[/C][C]0.697666[/C][/ROW]
[ROW][C]50[/C][C]0.57965[/C][C]0.840701[/C][C]0.42035[/C][/ROW]
[ROW][C]51[/C][C]0.497963[/C][C]0.995926[/C][C]0.502037[/C][/ROW]
[ROW][C]52[/C][C]0.405631[/C][C]0.811261[/C][C]0.594369[/C][/ROW]
[ROW][C]53[/C][C]0.370354[/C][C]0.740707[/C][C]0.629646[/C][/ROW]
[ROW][C]54[/C][C]0.528649[/C][C]0.942702[/C][C]0.471351[/C][/ROW]
[ROW][C]55[/C][C]0.415609[/C][C]0.831217[/C][C]0.584391[/C][/ROW]
[ROW][C]56[/C][C]0.530669[/C][C]0.938662[/C][C]0.469331[/C][/ROW]
[ROW][C]57[/C][C]0.909945[/C][C]0.18011[/C][C]0.0900549[/C][/ROW]
[ROW][C]58[/C][C]0.820013[/C][C]0.359975[/C][C]0.179987[/C][/ROW]
[ROW][C]59[/C][C]0.692558[/C][C]0.614884[/C][C]0.307442[/C][/ROW]
[/TABLE]
Source: https://freestatistics.org/blog/index.php?pk=267684&T=5

Globally Unique Identifier (entire table): ba.freestatistics.org/blog/index.php?pk=267684&T=5

As an alternative you can also use a QR Code:  

The GUIDs for individual cells are displayed in the table below:

Goldfeld-Quandt test for Heteroskedasticity
p-valuesAlternative Hypothesis
breakpoint indexgreater2-sidedless
60.8470970.3058070.152903
70.7451860.5096280.254814
80.6187220.7625560.381278
90.6530820.6938360.346918
100.5522360.8955290.447764
110.4421940.8843880.557806
120.3426340.6852670.657366
130.4227070.8454150.577293
140.5308020.9383960.469198
150.552080.8958390.44792
160.4855170.9710350.514483
170.3984630.7969260.601537
180.6392170.7215650.360783
190.5609340.8781310.439066
200.5248690.9502610.475131
210.4894130.9788250.510587
220.4126870.8253740.587313
230.3390640.6781290.660936
240.3095220.6190430.690478
250.2595310.5190630.740469
260.4842750.968550.515725
270.419350.8387010.58065
280.3970270.7940540.602973
290.3701440.7402890.629856
300.323770.647540.67623
310.2714770.5429530.728523
320.2720420.5440850.727958
330.2287820.4575640.771218
340.2108540.4217070.789146
350.3235360.6470720.676464
360.2670640.5341270.732936
370.2641280.5282570.735872
380.2564860.5129720.743514
390.204510.4090210.79549
400.264870.5297410.73513
410.2480470.4960950.751953
420.2169530.4339060.783047
430.3508130.7016260.649187
440.3252730.6505470.674727
450.2819890.5639790.718011
460.4079150.815830.592085
470.4002110.8004230.599789
480.3377310.6754630.662269
490.3023340.6046670.697666
500.579650.8407010.42035
510.4979630.9959260.502037
520.4056310.8112610.594369
530.3703540.7407070.629646
540.5286490.9427020.471351
550.4156090.8312170.584391
560.5306690.9386620.469331
570.9099450.180110.0900549
580.8200130.3599750.179987
590.6925580.6148840.307442


Meta Analysis of Goldfeld-Quandt test for Heteroskedasticity
Description# significant tests% significant testsOK/NOK
1% type I error level00OK
5% type I error level00OK
10% type I error level00OK

\begin{tabular}{lllllllll}
\hline
Meta Analysis of Goldfeld-Quandt test for Heteroskedasticity \tabularnewline
Description & # significant tests & % significant tests & OK/NOK \tabularnewline
1% type I error level & 0 & 0 & OK \tabularnewline
5% type I error level & 0 & 0 & OK \tabularnewline
10% type I error level & 0 & 0 & OK \tabularnewline
\hline
\end{tabular}
%Source: https://freestatistics.org/blog/index.php?pk=267684&T=6

[TABLE]
[ROW][C]Meta Analysis of Goldfeld-Quandt test for Heteroskedasticity[/C][/ROW]
[ROW][C]Description[/C][C]# significant tests[/C][C]% significant tests[/C][C]OK/NOK[/C][/ROW]
[ROW][C]1% type I error level[/C][C]0[/C][C]0[/C][C]OK[/C][/ROW]
[ROW][C]5% type I error level[/C][C]0[/C][C]0[/C][C]OK[/C][/ROW]
[ROW][C]10% type I error level[/C][C]0[/C][C]0[/C][C]OK[/C][/ROW]
[/TABLE]
Source: https://freestatistics.org/blog/index.php?pk=267684&T=6

Globally Unique Identifier (entire table): ba.freestatistics.org/blog/index.php?pk=267684&T=6

As an alternative you can also use a QR Code:  

The GUIDs for individual cells are displayed in the table below:

Meta Analysis of Goldfeld-Quandt test for Heteroskedasticity
Description# significant tests% significant testsOK/NOK
1% type I error level00OK
5% type I error level00OK
10% type I error level00OK


Parameters (Session):
par1 = two.sided ; par2 = 0.95 ; par3 = 20 ;
Parameters (R input):
par1 = 1 ; par2 = Do not include Seasonal Dummies ; par3 = No Linear Trend ;
R code (references can be found in the software module):
library(lattice)
library(lmtest)
n25 <- 25 #minimum number of obs. for Goldfeld-Quandt test
par1 <- as.numeric(par1)
x <- t(y)
k <- length(x[1,])
n <- length(x[,1])
x1 <- cbind(x[,par1], x[,1:k!=par1])
mycolnames <- c(colnames(x)[par1], colnames(x)[1:k!=par1])
colnames(x1) <- mycolnames #colnames(x)[par1]
x <- x1
if (par3 == 'First Differences'){
x2 <- array(0, dim=c(n-1,k), dimnames=list(1:(n-1), paste('(1-B)',colnames(x),sep='')))
for (i in 1:n-1) {
for (j in 1:k) {
x2[i,j] <- x[i+1,j] - x[i,j]
}
}
x <- x2
}
if (par2 == 'Include Monthly Dummies'){
x2 <- array(0, dim=c(n,11), dimnames=list(1:n, paste('M', seq(1:11), sep ='')))
for (i in 1:11){
x2[seq(i,n,12),i] <- 1
}
x <- cbind(x, x2)
}
if (par2 == 'Include Quarterly Dummies'){
x2 <- array(0, dim=c(n,3), dimnames=list(1:n, paste('Q', seq(1:3), sep ='')))
for (i in 1:3){
x2[seq(i,n,4),i] <- 1
}
x <- cbind(x, x2)
}
k <- length(x[1,])
if (par3 == 'Linear Trend'){
x <- cbind(x, c(1:n))
colnames(x)[k+1] <- 't'
}
x
k <- length(x[1,])
df <- as.data.frame(x)
(mylm <- lm(df))
(mysum <- summary(mylm))
if (n > n25) {
kp3 <- k + 3
nmkm3 <- n - k - 3
gqarr <- array(NA, dim=c(nmkm3-kp3+1,3))
numgqtests <- 0
numsignificant1 <- 0
numsignificant5 <- 0
numsignificant10 <- 0
for (mypoint in kp3:nmkm3) {
j <- 0
numgqtests <- numgqtests + 1
for (myalt in c('greater', 'two.sided', 'less')) {
j <- j + 1
gqarr[mypoint-kp3+1,j] <- gqtest(mylm, point=mypoint, alternative=myalt)$p.value
}
if (gqarr[mypoint-kp3+1,2] < 0.01) numsignificant1 <- numsignificant1 + 1
if (gqarr[mypoint-kp3+1,2] < 0.05) numsignificant5 <- numsignificant5 + 1
if (gqarr[mypoint-kp3+1,2] < 0.10) numsignificant10 <- numsignificant10 + 1
}
gqarr
}
bitmap(file='test0.png')
plot(x[,1], type='l', main='Actuals and Interpolation', ylab='value of Actuals and Interpolation (dots)', xlab='time or index')
points(x[,1]-mysum$resid)
grid()
dev.off()
bitmap(file='test1.png')
plot(mysum$resid, type='b', pch=19, main='Residuals', ylab='value of Residuals', xlab='time or index')
grid()
dev.off()
bitmap(file='test2.png')
hist(mysum$resid, main='Residual Histogram', xlab='values of Residuals')
grid()
dev.off()
bitmap(file='test3.png')
densityplot(~mysum$resid,col='black',main='Residual Density Plot', xlab='values of Residuals')
dev.off()
bitmap(file='test4.png')
qqnorm(mysum$resid, main='Residual Normal Q-Q Plot')
qqline(mysum$resid)
grid()
dev.off()
(myerror <- as.ts(mysum$resid))
bitmap(file='test5.png')
dum <- cbind(lag(myerror,k=1),myerror)
dum
dum1 <- dum[2:length(myerror),]
dum1
z <- as.data.frame(dum1)
z
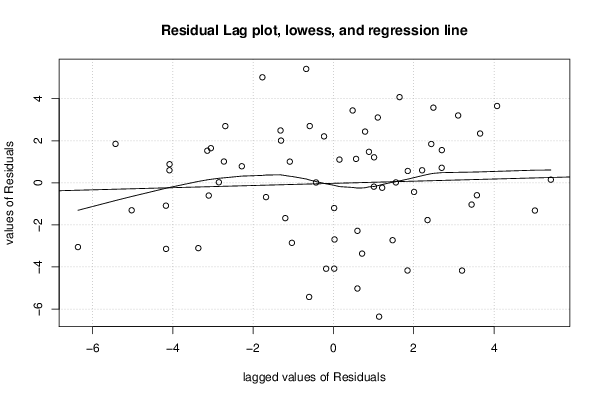
plot(z,main=paste('Residual Lag plot, lowess, and regression line'), ylab='values of Residuals', xlab='lagged values of Residuals')
lines(lowess(z))
abline(lm(z))
grid()
dev.off()
bitmap(file='test6.png')
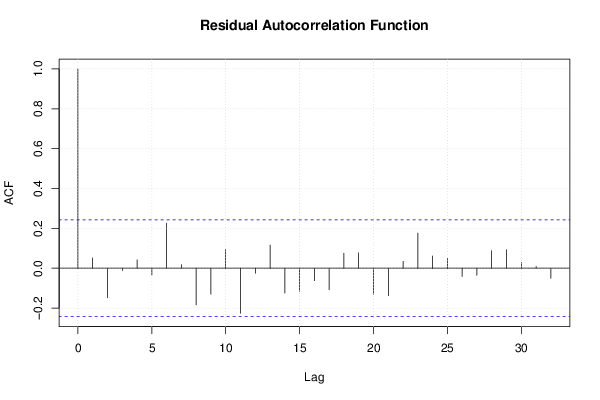
acf(mysum$resid, lag.max=length(mysum$resid)/2, main='Residual Autocorrelation Function')
grid()
dev.off()
bitmap(file='test7.png')
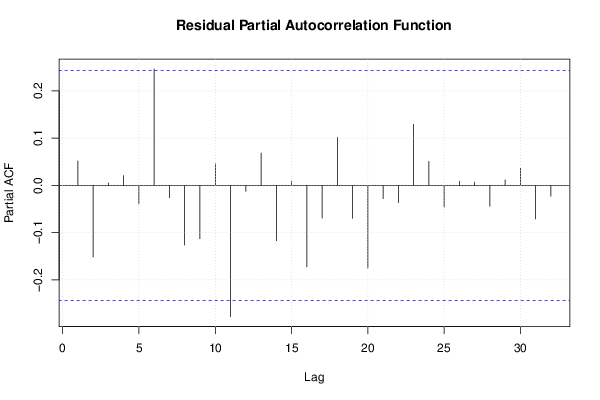
pacf(mysum$resid, lag.max=length(mysum$resid)/2, main='Residual Partial Autocorrelation Function')
grid()
dev.off()
bitmap(file='test8.png')
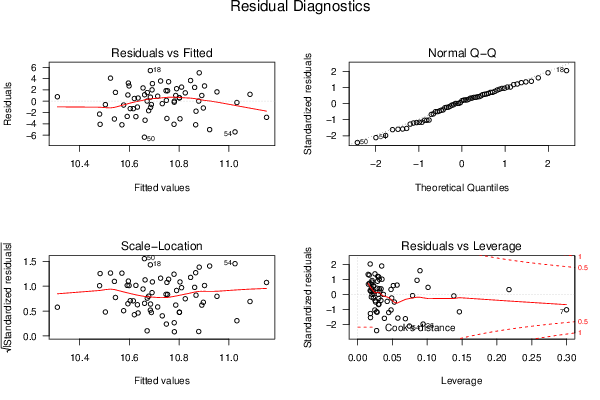
opar <- par(mfrow = c(2,2), oma = c(0, 0, 1.1, 0))
plot(mylm, las = 1, sub='Residual Diagnostics')
par(opar)
dev.off()
if (n > n25) {
bitmap(file='test9.png')
plot(kp3:nmkm3,gqarr[,2], main='Goldfeld-Quandt test',ylab='2-sided p-value',xlab='breakpoint')
grid()
dev.off()
}
load(file='createtable')
a<-table.start()
a<-table.row.start(a)
a<-table.element(a, 'Multiple Linear Regression - Estimated Regression Equation', 1, TRUE)
a<-table.row.end(a)
myeq <- colnames(x)[1]
myeq <- paste(myeq, '[t] = ', sep='')
for (i in 1:k){
if (mysum$coefficients[i,1] > 0) myeq <- paste(myeq, '+', '')
myeq <- paste(myeq, signif(mysum$coefficients[i,1],6), sep=' ')
if (rownames(mysum$coefficients)[i] != '(Intercept)') {
myeq <- paste(myeq, rownames(mysum$coefficients)[i], sep='')
if (rownames(mysum$coefficients)[i] != 't') myeq <- paste(myeq, '[t]', sep='')
}
}
myeq <- paste(myeq, ' + e[t]')
a<-table.row.start(a)
a<-table.element(a, myeq)
a<-table.row.end(a)
a<-table.end(a)
table.save(a,file='mytable1.tab')
a<-table.start()
a<-table.row.start(a)
a<-table.element(a,hyperlink('ols1.htm','Multiple Linear Regression - Ordinary Least Squares',''), 6, TRUE)
a<-table.row.end(a)
a<-table.row.start(a)
a<-table.element(a,'Variable',header=TRUE)
a<-table.element(a,'Parameter',header=TRUE)
a<-table.element(a,'S.D.',header=TRUE)
a<-table.element(a,'T-STAT
H0: parameter = 0',header=TRUE)
a<-table.element(a,'2-tail p-value',header=TRUE)
a<-table.element(a,'1-tail p-value',header=TRUE)
a<-table.row.end(a)
for (i in 1:k){
a<-table.row.start(a)
a<-table.element(a,rownames(mysum$coefficients)[i],header=TRUE)
a<-table.element(a,signif(mysum$coefficients[i,1],6))
a<-table.element(a, signif(mysum$coefficients[i,2],6))
a<-table.element(a, signif(mysum$coefficients[i,3],4))
a<-table.element(a, signif(mysum$coefficients[i,4],6))
a<-table.element(a, signif(mysum$coefficients[i,4]/2,6))
a<-table.row.end(a)
}
a<-table.end(a)
table.save(a,file='mytable2.tab')
a<-table.start()
a<-table.row.start(a)
a<-table.element(a, 'Multiple Linear Regression - Regression Statistics', 2, TRUE)
a<-table.row.end(a)
a<-table.row.start(a)
a<-table.element(a, 'Multiple R',1,TRUE)
a<-table.element(a, signif(sqrt(mysum$r.squared),6))
a<-table.row.end(a)
a<-table.row.start(a)
a<-table.element(a, 'R-squared',1,TRUE)
a<-table.element(a, signif(mysum$r.squared,6))
a<-table.row.end(a)
a<-table.row.start(a)
a<-table.element(a, 'Adjusted R-squared',1,TRUE)
a<-table.element(a, signif(mysum$adj.r.squared,6))
a<-table.row.end(a)
a<-table.row.start(a)
a<-table.element(a, 'F-TEST (value)',1,TRUE)
a<-table.element(a, signif(mysum$fstatistic[1],6))
a<-table.row.end(a)
a<-table.row.start(a)
a<-table.element(a, 'F-TEST (DF numerator)',1,TRUE)
a<-table.element(a, signif(mysum$fstatistic[2],6))
a<-table.row.end(a)
a<-table.row.start(a)
a<-table.element(a, 'F-TEST (DF denominator)',1,TRUE)
a<-table.element(a, signif(mysum$fstatistic[3],6))
a<-table.row.end(a)
a<-table.row.start(a)
a<-table.element(a, 'p-value',1,TRUE)
a<-table.element(a, signif(1-pf(mysum$fstatistic[1],mysum$fstatistic[2],mysum$fstatistic[3]),6))
a<-table.row.end(a)
a<-table.row.start(a)
a<-table.element(a, 'Multiple Linear Regression - Residual Statistics', 2, TRUE)
a<-table.row.end(a)
a<-table.row.start(a)
a<-table.element(a, 'Residual Standard Deviation',1,TRUE)
a<-table.element(a, signif(mysum$sigma,6))
a<-table.row.end(a)
a<-table.row.start(a)
a<-table.element(a, 'Sum Squared Residuals',1,TRUE)
a<-table.element(a, signif(sum(myerror*myerror),6))
a<-table.row.end(a)
a<-table.end(a)
table.save(a,file='mytable3.tab')
a<-table.start()
a<-table.row.start(a)
a<-table.element(a, 'Multiple Linear Regression - Actuals, Interpolation, and Residuals', 4, TRUE)
a<-table.row.end(a)
a<-table.row.start(a)
a<-table.element(a, 'Time or Index', 1, TRUE)
a<-table.element(a, 'Actuals', 1, TRUE)
a<-table.element(a, 'Interpolation
Forecast', 1, TRUE)
a<-table.element(a, 'Residuals
Prediction Error', 1, TRUE)
a<-table.row.end(a)
for (i in 1:n) {
a<-table.row.start(a)
a<-table.element(a,i, 1, TRUE)
a<-table.element(a,signif(x[i],6))
a<-table.element(a,signif(x[i]-mysum$resid[i],6))
a<-table.element(a,signif(mysum$resid[i],6))
a<-table.row.end(a)
}
a<-table.end(a)
table.save(a,file='mytable4.tab')
if (n > n25) {
a<-table.start()
a<-table.row.start(a)
a<-table.element(a,'Goldfeld-Quandt test for Heteroskedasticity',4,TRUE)
a<-table.row.end(a)
a<-table.row.start(a)
a<-table.element(a,'p-values',header=TRUE)
a<-table.element(a,'Alternative Hypothesis',3,header=TRUE)
a<-table.row.end(a)
a<-table.row.start(a)
a<-table.element(a,'breakpoint index',header=TRUE)
a<-table.element(a,'greater',header=TRUE)
a<-table.element(a,'2-sided',header=TRUE)
a<-table.element(a,'less',header=TRUE)
a<-table.row.end(a)
for (mypoint in kp3:nmkm3) {
a<-table.row.start(a)
a<-table.element(a,mypoint,header=TRUE)
a<-table.element(a,signif(gqarr[mypoint-kp3+1,1],6))
a<-table.element(a,signif(gqarr[mypoint-kp3+1,2],6))
a<-table.element(a,signif(gqarr[mypoint-kp3+1,3],6))
a<-table.row.end(a)
}
a<-table.end(a)
table.save(a,file='mytable5.tab')
a<-table.start()
a<-table.row.start(a)
a<-table.element(a,'Meta Analysis of Goldfeld-Quandt test for Heteroskedasticity',4,TRUE)
a<-table.row.end(a)
a<-table.row.start(a)
a<-table.element(a,'Description',header=TRUE)
a<-table.element(a,'# significant tests',header=TRUE)
a<-table.element(a,'% significant tests',header=TRUE)
a<-table.element(a,'OK/NOK',header=TRUE)
a<-table.row.end(a)
a<-table.row.start(a)
a<-table.element(a,'1% type I error level',header=TRUE)
a<-table.element(a,signif(numsignificant1,6))
a<-table.element(a,signif(numsignificant1/numgqtests,6))
if (numsignificant1/numgqtests < 0.01) dum <- 'OK' else dum <- 'NOK'
a<-table.element(a,dum)
a<-table.row.end(a)
a<-table.row.start(a)
a<-table.element(a,'5% type I error level',header=TRUE)
a<-table.element(a,signif(numsignificant5,6))
a<-table.element(a,signif(numsignificant5/numgqtests,6))
if (numsignificant5/numgqtests < 0.05) dum <- 'OK' else dum <- 'NOK'
a<-table.element(a,dum)
a<-table.row.end(a)
a<-table.row.start(a)
a<-table.element(a,'10% type I error level',header=TRUE)
a<-table.element(a,signif(numsignificant10,6))
a<-table.element(a,signif(numsignificant10/numgqtests,6))
if (numsignificant10/numgqtests < 0.1) dum <- 'OK' else dum <- 'NOK'
a<-table.element(a,dum)
a<-table.row.end(a)
a<-table.end(a)
table.save(a,file='mytable6.tab')
}