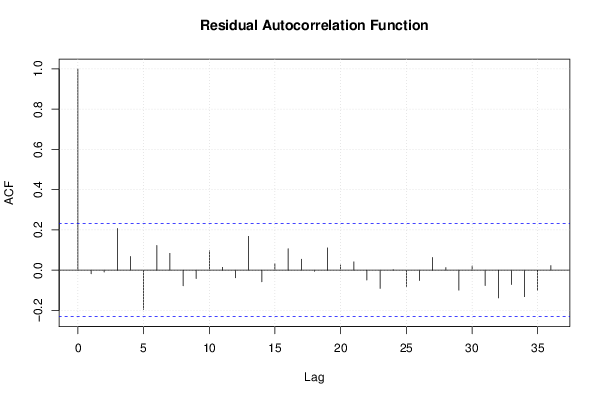
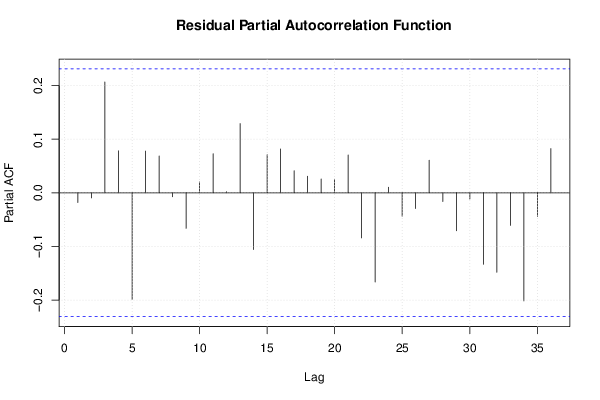
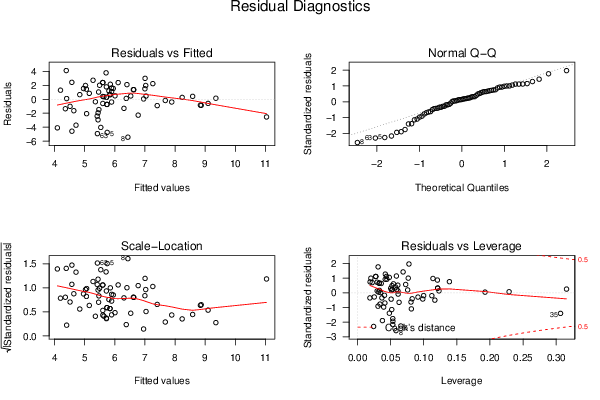
Free Statistics

of Irreproducible Research!

Author's title

Author*The author of this computation has been verified*
R Software Modulerwasp_multipleregression.wasp
Title produced by softwareMultiple Regression
Date of computationSun, 14 Dec 2014 16:29:04 +0000
Cite this page as followsStatistical Computations at FreeStatistics.org, Office for Research Development and Education, URL https://freestatistics.org/blog/index.php?v=date/2014/Dec/14/t1418574578fdyu8ysaofrua0u.htm/, Retrieved Thu, 16 May 2024 18:44:26 +0000
Statistical Computations at FreeStatistics.org, Office for Research Development and Education, URL https://freestatistics.org/blog/index.php?pk=267735, Retrieved Thu, 16 May 2024 18:44:26 +0000
QR Codes:

Original text written by user:
IsPrivate?No (this computation is public)
User-defined keywords
Estimated Impact87
Family? (F = Feedback message, R = changed R code, M = changed R Module, P = changed Parameters, D = changed Data)
-       [Multiple Regression] [] [2014-12-14 16:29:04] [04df4205f362f56e0d1a9032a00a5d3d] [Current]
Feedback Forum

Post a new message
Dataseries X:
137	99	42	42	3,0
148	137	109	80	7,5
131	108	49	20	6,0
59	62	23	34	6,0
90	72	61	42	1,0
83	58	38	13	6,0
116	97	32	37	5,0
42	88	16	25	1,0
155	104	22	28	6,5
96	99	24	45	7,5
66	60	28	25	3,5
99	75	59	59	7,5
108	69	38	27	6,5
97	34	12	25	0,0
106	95	37	64	5,5
80	57	47	32	5,0
74	54	13	31	7,0
114	64	14	26	0,0
140	76	-2	58	4,5
98	88	24	21	1,5
126	102	23	33	2,5
98	61	24	16	5,5
95	80	14	20	8,0
110	49	52	37	1,0
70	78	15	35	5,0
86	45	19	27	3,0
130	55	35	41	3,0
96	96	24	40	8,0
99	38	19	17	5,5
68	35	14	10	7
131	227	93	66	9,5
71	79	10	23	6
68	130	15	25	9
89	179	2	56	7,5
87	305	4	42	8,5
49	52	61	16	6,5
96	40	31	9	8,5
100	214	31	48	8
141	119	42	53	7
110	159	25	55	9,5
146	125	28	51	7
147	84	13	30	3,5
61	139	13	38	6,5
60	95	23	27	6,5
109	130	10	56	8,5
68	72	5	25	4
73	206	32	43	8,5
65	111	15	28	8
52	83	14	24	8,5
62	119	23	29	7
101	186	38	57	8,5
42	50	12	37	7,5
96	137	34	44	8,5
57	98	20	39	7
86	122	60	30	10
88	94	25	27	7,5
85	82	34	28	5
102	83	45	31	8
86	89	48	19	6,5
114	225	29	51	8
94	204	19	51	9
64	44	27	24	3
105	79	39	39	0,5
49	52	61	16	6,5
95	116	67	31	4,5
102	83	45	31	8
63	153	8	39	7,5
117	106	22	38	9,5
57	58	17	31	6,5
73	74	34	22	6
105	131	25	51	8
31	78	13	16	5


Summary of computational transaction
Raw Inputview raw input (R code)
Raw Outputview raw output of R engine
Computing time5 seconds
R Server'Sir Ronald Aylmer Fisher' @ fisher.wessa.net

\begin{tabular}{lllllllll}
\hline
Summary of computational transaction \tabularnewline
Raw Input & view raw input (R code)  \tabularnewline
Raw Output & view raw output of R engine  \tabularnewline
Computing time & 5 seconds \tabularnewline
R Server & 'Sir Ronald Aylmer Fisher' @ fisher.wessa.net \tabularnewline
\hline
\end{tabular}
%Source: https://freestatistics.org/blog/index.php?pk=267735&T=0

[TABLE]
[ROW][C]Summary of computational transaction[/C][/ROW]
[ROW][C]Raw Input[/C][C]view raw input (R code) [/C][/ROW]
[ROW][C]Raw Output[/C][C]view raw output of R engine [/C][/ROW]
[ROW][C]Computing time[/C][C]5 seconds[/C][/ROW]
[ROW][C]R Server[/C][C]'Sir Ronald Aylmer Fisher' @ fisher.wessa.net[/C][/ROW]
[/TABLE]
Source: https://freestatistics.org/blog/index.php?pk=267735&T=0

Globally Unique Identifier (entire table): ba.freestatistics.org/blog/index.php?pk=267735&T=0

As an alternative you can also use a QR Code:  

The GUIDs for individual cells are displayed in the table below:

Summary of computational transaction
Raw Inputview raw input (R code)
Raw Outputview raw output of R engine
Computing time5 seconds
R Server'Sir Ronald Aylmer Fisher' @ fisher.wessa.net


Multiple Linear Regression - Estimated Regression Equation
Ex[t] = + 4.6833 -0.0172386LFM[t] + 0.0250107B[t] + 0.0103742PRH[t] + 0.00434793CH[t] + e[t]

\begin{tabular}{lllllllll}
\hline
Multiple Linear Regression - Estimated Regression Equation \tabularnewline
Ex[t] =  +  4.6833 -0.0172386LFM[t] +  0.0250107B[t] +  0.0103742PRH[t] +  0.00434793CH[t]  + e[t] \tabularnewline
\hline
\end{tabular}
%Source: https://freestatistics.org/blog/index.php?pk=267735&T=1

[TABLE]
[ROW][C]Multiple Linear Regression - Estimated Regression Equation[/C][/ROW]
[ROW][C]Ex[t] =  +  4.6833 -0.0172386LFM[t] +  0.0250107B[t] +  0.0103742PRH[t] +  0.00434793CH[t]  + e[t][/C][/ROW]
[/TABLE]
Source: https://freestatistics.org/blog/index.php?pk=267735&T=1

Globally Unique Identifier (entire table): ba.freestatistics.org/blog/index.php?pk=267735&T=1

As an alternative you can also use a QR Code:  

The GUIDs for individual cells are displayed in the table below:

Multiple Linear Regression - Estimated Regression Equation
Ex[t] = + 4.6833 -0.0172386LFM[t] + 0.0250107B[t] + 0.0103742PRH[t] + 0.00434793CH[t] + e[t]


Multiple Linear Regression - Ordinary Least Squares
VariableParameterS.D.T-STATH0: parameter = 02-tail p-value1-tail p-value
(Intercept)4.68330.9471634.9455.39485e-062.69742e-06
LFM-0.01723860.0104877-1.6440.1049230.0524617
B0.02501070.006110174.0930.0001166825.83411e-05
PRH0.01037420.01376910.75340.4538220.226911
CH0.004347930.02474460.17570.861050.430525

\begin{tabular}{lllllllll}
\hline
Multiple Linear Regression - Ordinary Least Squares \tabularnewline
Variable & Parameter & S.D. & T-STATH0: parameter = 0 & 2-tail p-value & 1-tail p-value \tabularnewline
(Intercept) & 4.6833 & 0.947163 & 4.945 & 5.39485e-06 & 2.69742e-06 \tabularnewline
LFM & -0.0172386 & 0.0104877 & -1.644 & 0.104923 & 0.0524617 \tabularnewline
B & 0.0250107 & 0.00611017 & 4.093 & 0.000116682 & 5.83411e-05 \tabularnewline
PRH & 0.0103742 & 0.0137691 & 0.7534 & 0.453822 & 0.226911 \tabularnewline
CH & 0.00434793 & 0.0247446 & 0.1757 & 0.86105 & 0.430525 \tabularnewline
\hline
\end{tabular}
%Source: https://freestatistics.org/blog/index.php?pk=267735&T=2

[TABLE]
[ROW][C]Multiple Linear Regression - Ordinary Least Squares[/C][/ROW]
[ROW][C]Variable[/C][C]Parameter[/C][C]S.D.[/C][C]T-STATH0: parameter = 0[/C][C]2-tail p-value[/C][C]1-tail p-value[/C][/ROW]
[ROW][C](Intercept)[/C][C]4.6833[/C][C]0.947163[/C][C]4.945[/C][C]5.39485e-06[/C][C]2.69742e-06[/C][/ROW]
[ROW][C]LFM[/C][C]-0.0172386[/C][C]0.0104877[/C][C]-1.644[/C][C]0.104923[/C][C]0.0524617[/C][/ROW]
[ROW][C]B[/C][C]0.0250107[/C][C]0.00611017[/C][C]4.093[/C][C]0.000116682[/C][C]5.83411e-05[/C][/ROW]
[ROW][C]PRH[/C][C]0.0103742[/C][C]0.0137691[/C][C]0.7534[/C][C]0.453822[/C][C]0.226911[/C][/ROW]
[ROW][C]CH[/C][C]0.00434793[/C][C]0.0247446[/C][C]0.1757[/C][C]0.86105[/C][C]0.430525[/C][/ROW]
[/TABLE]
Source: https://freestatistics.org/blog/index.php?pk=267735&T=2

Globally Unique Identifier (entire table): ba.freestatistics.org/blog/index.php?pk=267735&T=2

As an alternative you can also use a QR Code:  

The GUIDs for individual cells are displayed in the table below:

Multiple Linear Regression - Ordinary Least Squares
VariableParameterS.D.T-STATH0: parameter = 02-tail p-value1-tail p-value
(Intercept)4.68330.9471634.9455.39485e-062.69742e-06
LFM-0.01723860.0104877-1.6440.1049230.0524617
B0.02501070.006110174.0930.0001166825.83411e-05
PRH0.01037420.01376910.75340.4538220.226911
CH0.004347930.02474460.17570.861050.430525


Multiple Linear Regression - Regression Statistics
Multiple R0.533807
R-squared0.28495
Adjusted R-squared0.24226
F-TEST (value)6.67493
F-TEST (DF numerator)4
F-TEST (DF denominator)67
p-value0.000139109
Multiple Linear Regression - Residual Statistics
Residual Standard Deviation2.17272
Sum Squared Residuals316.288

\begin{tabular}{lllllllll}
\hline
Multiple Linear Regression - Regression Statistics \tabularnewline
Multiple R & 0.533807 \tabularnewline
R-squared & 0.28495 \tabularnewline
Adjusted R-squared & 0.24226 \tabularnewline
F-TEST (value) & 6.67493 \tabularnewline
F-TEST (DF numerator) & 4 \tabularnewline
F-TEST (DF denominator) & 67 \tabularnewline
p-value & 0.000139109 \tabularnewline
Multiple Linear Regression - Residual Statistics \tabularnewline
Residual Standard Deviation & 2.17272 \tabularnewline
Sum Squared Residuals & 316.288 \tabularnewline
\hline
\end{tabular}
%Source: https://freestatistics.org/blog/index.php?pk=267735&T=3

[TABLE]
[ROW][C]Multiple Linear Regression - Regression Statistics[/C][/ROW]
[ROW][C]Multiple R[/C][C]0.533807[/C][/ROW]
[ROW][C]R-squared[/C][C]0.28495[/C][/ROW]
[ROW][C]Adjusted R-squared[/C][C]0.24226[/C][/ROW]
[ROW][C]F-TEST (value)[/C][C]6.67493[/C][/ROW]
[ROW][C]F-TEST (DF numerator)[/C][C]4[/C][/ROW]
[ROW][C]F-TEST (DF denominator)[/C][C]67[/C][/ROW]
[ROW][C]p-value[/C][C]0.000139109[/C][/ROW]
[ROW][C]Multiple Linear Regression - Residual Statistics[/C][/ROW]
[ROW][C]Residual Standard Deviation[/C][C]2.17272[/C][/ROW]
[ROW][C]Sum Squared Residuals[/C][C]316.288[/C][/ROW]
[/TABLE]
Source: https://freestatistics.org/blog/index.php?pk=267735&T=3

Globally Unique Identifier (entire table): ba.freestatistics.org/blog/index.php?pk=267735&T=3

As an alternative you can also use a QR Code:  

The GUIDs for individual cells are displayed in the table below:

Multiple Linear Regression - Regression Statistics
Multiple R0.533807
R-squared0.28495
Adjusted R-squared0.24226
F-TEST (value)6.67493
F-TEST (DF numerator)4
F-TEST (DF denominator)67
p-value0.000139109
Multiple Linear Regression - Residual Statistics
Residual Standard Deviation2.17272
Sum Squared Residuals316.288


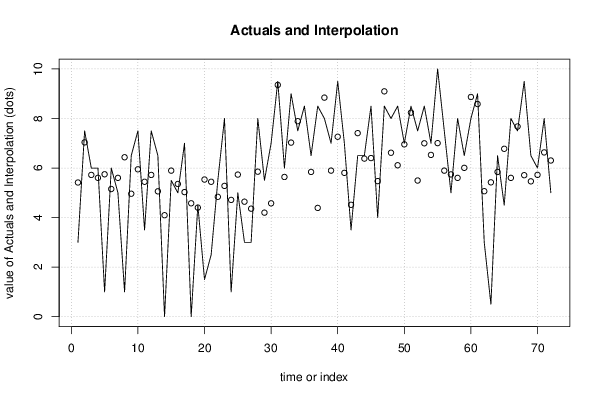
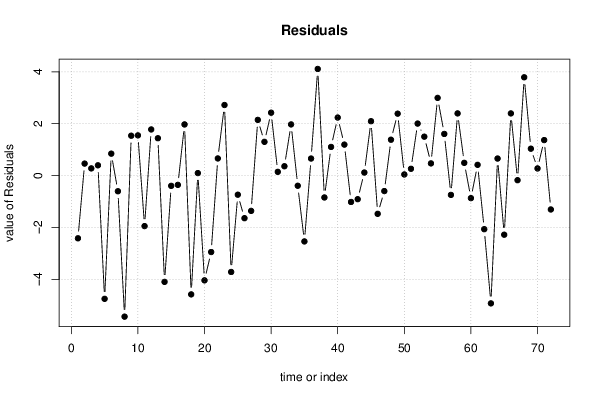
Multiple Linear Regression - Actuals, Interpolation, and Residuals
Time or IndexActualsInterpolationForecastResidualsPrediction Error
135.41601-2.41601
27.57.037090.462915
365.72150.278501
465.603330.396674
515.74804-4.74804
665.153860.846137
755.60251-0.602513
816.43491-5.43491
96.54.962411.53759
107.55.94911.5509
113.55.44537-1.94537
127.55.721091.77891
136.55.058891.44111
1404.09471-4.09471
155.55.89414-0.394143
1655.35655-0.356547
1775.027871.97213
1804.57707-4.57707
194.54.402140.0978567
201.55.53515-4.03515
212.55.44442-2.94442
225.54.838120.661879
2385.278692.72131
2414.71291-3.71291
2555.73523-0.735227
2634.64077-1.64077
2734.35924-1.35924
2885.852322.14768
295.54.198111.30189
3074.575172.42483
319.59.354250.14575
3265.638950.361047
3397.026781.97322
347.57.89022-0.39022
358.511.0359-2.53593
366.55.841560.658437
378.54.389564.11044
3888.84204-0.842041
3975.895091.10491
409.57.262252.23775
4175.805031.19497
423.54.51543-1.01543
436.57.40833-0.908325
446.56.381010.118994
458.56.402922.09708
4645.47242-1.47242
478.59.09603-0.596032
4886.616341.38366
498.56.112372.38763
5076.955480.0445173
518.58.236250.263747
527.55.495182.00482
538.56.99891.5011
5476.528810.471193
55107.004982.99502
567.55.894061.60594
5755.74337-0.743366
5885.602482.39752
596.56.007310.49269
6088.86811-0.868114
6198.583920.416082
6235.06496-2.06496
630.55.42326-4.92326
646.55.841560.658437
654.56.77674-2.27674
6685.602482.39752
677.57.67648-0.176475
689.55.710983.78902
696.55.462471.03753
7065.724060.275944
7186.630751.36925
7256.30417-1.30417

\begin{tabular}{lllllllll}
\hline
Multiple Linear Regression - Actuals, Interpolation, and Residuals \tabularnewline
Time or Index & Actuals & InterpolationForecast & ResidualsPrediction Error \tabularnewline
1 & 3 & 5.41601 & -2.41601 \tabularnewline
2 & 7.5 & 7.03709 & 0.462915 \tabularnewline
3 & 6 & 5.7215 & 0.278501 \tabularnewline
4 & 6 & 5.60333 & 0.396674 \tabularnewline
5 & 1 & 5.74804 & -4.74804 \tabularnewline
6 & 6 & 5.15386 & 0.846137 \tabularnewline
7 & 5 & 5.60251 & -0.602513 \tabularnewline
8 & 1 & 6.43491 & -5.43491 \tabularnewline
9 & 6.5 & 4.96241 & 1.53759 \tabularnewline
10 & 7.5 & 5.9491 & 1.5509 \tabularnewline
11 & 3.5 & 5.44537 & -1.94537 \tabularnewline
12 & 7.5 & 5.72109 & 1.77891 \tabularnewline
13 & 6.5 & 5.05889 & 1.44111 \tabularnewline
14 & 0 & 4.09471 & -4.09471 \tabularnewline
15 & 5.5 & 5.89414 & -0.394143 \tabularnewline
16 & 5 & 5.35655 & -0.356547 \tabularnewline
17 & 7 & 5.02787 & 1.97213 \tabularnewline
18 & 0 & 4.57707 & -4.57707 \tabularnewline
19 & 4.5 & 4.40214 & 0.0978567 \tabularnewline
20 & 1.5 & 5.53515 & -4.03515 \tabularnewline
21 & 2.5 & 5.44442 & -2.94442 \tabularnewline
22 & 5.5 & 4.83812 & 0.661879 \tabularnewline
23 & 8 & 5.27869 & 2.72131 \tabularnewline
24 & 1 & 4.71291 & -3.71291 \tabularnewline
25 & 5 & 5.73523 & -0.735227 \tabularnewline
26 & 3 & 4.64077 & -1.64077 \tabularnewline
27 & 3 & 4.35924 & -1.35924 \tabularnewline
28 & 8 & 5.85232 & 2.14768 \tabularnewline
29 & 5.5 & 4.19811 & 1.30189 \tabularnewline
30 & 7 & 4.57517 & 2.42483 \tabularnewline
31 & 9.5 & 9.35425 & 0.14575 \tabularnewline
32 & 6 & 5.63895 & 0.361047 \tabularnewline
33 & 9 & 7.02678 & 1.97322 \tabularnewline
34 & 7.5 & 7.89022 & -0.39022 \tabularnewline
35 & 8.5 & 11.0359 & -2.53593 \tabularnewline
36 & 6.5 & 5.84156 & 0.658437 \tabularnewline
37 & 8.5 & 4.38956 & 4.11044 \tabularnewline
38 & 8 & 8.84204 & -0.842041 \tabularnewline
39 & 7 & 5.89509 & 1.10491 \tabularnewline
40 & 9.5 & 7.26225 & 2.23775 \tabularnewline
41 & 7 & 5.80503 & 1.19497 \tabularnewline
42 & 3.5 & 4.51543 & -1.01543 \tabularnewline
43 & 6.5 & 7.40833 & -0.908325 \tabularnewline
44 & 6.5 & 6.38101 & 0.118994 \tabularnewline
45 & 8.5 & 6.40292 & 2.09708 \tabularnewline
46 & 4 & 5.47242 & -1.47242 \tabularnewline
47 & 8.5 & 9.09603 & -0.596032 \tabularnewline
48 & 8 & 6.61634 & 1.38366 \tabularnewline
49 & 8.5 & 6.11237 & 2.38763 \tabularnewline
50 & 7 & 6.95548 & 0.0445173 \tabularnewline
51 & 8.5 & 8.23625 & 0.263747 \tabularnewline
52 & 7.5 & 5.49518 & 2.00482 \tabularnewline
53 & 8.5 & 6.9989 & 1.5011 \tabularnewline
54 & 7 & 6.52881 & 0.471193 \tabularnewline
55 & 10 & 7.00498 & 2.99502 \tabularnewline
56 & 7.5 & 5.89406 & 1.60594 \tabularnewline
57 & 5 & 5.74337 & -0.743366 \tabularnewline
58 & 8 & 5.60248 & 2.39752 \tabularnewline
59 & 6.5 & 6.00731 & 0.49269 \tabularnewline
60 & 8 & 8.86811 & -0.868114 \tabularnewline
61 & 9 & 8.58392 & 0.416082 \tabularnewline
62 & 3 & 5.06496 & -2.06496 \tabularnewline
63 & 0.5 & 5.42326 & -4.92326 \tabularnewline
64 & 6.5 & 5.84156 & 0.658437 \tabularnewline
65 & 4.5 & 6.77674 & -2.27674 \tabularnewline
66 & 8 & 5.60248 & 2.39752 \tabularnewline
67 & 7.5 & 7.67648 & -0.176475 \tabularnewline
68 & 9.5 & 5.71098 & 3.78902 \tabularnewline
69 & 6.5 & 5.46247 & 1.03753 \tabularnewline
70 & 6 & 5.72406 & 0.275944 \tabularnewline
71 & 8 & 6.63075 & 1.36925 \tabularnewline
72 & 5 & 6.30417 & -1.30417 \tabularnewline
\hline
\end{tabular}
%Source: https://freestatistics.org/blog/index.php?pk=267735&T=4

[TABLE]
[ROW][C]Multiple Linear Regression - Actuals, Interpolation, and Residuals[/C][/ROW]
[ROW][C]Time or Index[/C][C]Actuals[/C][C]InterpolationForecast[/C][C]ResidualsPrediction Error[/C][/ROW]
[ROW][C]1[/C][C]3[/C][C]5.41601[/C][C]-2.41601[/C][/ROW]
[ROW][C]2[/C][C]7.5[/C][C]7.03709[/C][C]0.462915[/C][/ROW]
[ROW][C]3[/C][C]6[/C][C]5.7215[/C][C]0.278501[/C][/ROW]
[ROW][C]4[/C][C]6[/C][C]5.60333[/C][C]0.396674[/C][/ROW]
[ROW][C]5[/C][C]1[/C][C]5.74804[/C][C]-4.74804[/C][/ROW]
[ROW][C]6[/C][C]6[/C][C]5.15386[/C][C]0.846137[/C][/ROW]
[ROW][C]7[/C][C]5[/C][C]5.60251[/C][C]-0.602513[/C][/ROW]
[ROW][C]8[/C][C]1[/C][C]6.43491[/C][C]-5.43491[/C][/ROW]
[ROW][C]9[/C][C]6.5[/C][C]4.96241[/C][C]1.53759[/C][/ROW]
[ROW][C]10[/C][C]7.5[/C][C]5.9491[/C][C]1.5509[/C][/ROW]
[ROW][C]11[/C][C]3.5[/C][C]5.44537[/C][C]-1.94537[/C][/ROW]
[ROW][C]12[/C][C]7.5[/C][C]5.72109[/C][C]1.77891[/C][/ROW]
[ROW][C]13[/C][C]6.5[/C][C]5.05889[/C][C]1.44111[/C][/ROW]
[ROW][C]14[/C][C]0[/C][C]4.09471[/C][C]-4.09471[/C][/ROW]
[ROW][C]15[/C][C]5.5[/C][C]5.89414[/C][C]-0.394143[/C][/ROW]
[ROW][C]16[/C][C]5[/C][C]5.35655[/C][C]-0.356547[/C][/ROW]
[ROW][C]17[/C][C]7[/C][C]5.02787[/C][C]1.97213[/C][/ROW]
[ROW][C]18[/C][C]0[/C][C]4.57707[/C][C]-4.57707[/C][/ROW]
[ROW][C]19[/C][C]4.5[/C][C]4.40214[/C][C]0.0978567[/C][/ROW]
[ROW][C]20[/C][C]1.5[/C][C]5.53515[/C][C]-4.03515[/C][/ROW]
[ROW][C]21[/C][C]2.5[/C][C]5.44442[/C][C]-2.94442[/C][/ROW]
[ROW][C]22[/C][C]5.5[/C][C]4.83812[/C][C]0.661879[/C][/ROW]
[ROW][C]23[/C][C]8[/C][C]5.27869[/C][C]2.72131[/C][/ROW]
[ROW][C]24[/C][C]1[/C][C]4.71291[/C][C]-3.71291[/C][/ROW]
[ROW][C]25[/C][C]5[/C][C]5.73523[/C][C]-0.735227[/C][/ROW]
[ROW][C]26[/C][C]3[/C][C]4.64077[/C][C]-1.64077[/C][/ROW]
[ROW][C]27[/C][C]3[/C][C]4.35924[/C][C]-1.35924[/C][/ROW]
[ROW][C]28[/C][C]8[/C][C]5.85232[/C][C]2.14768[/C][/ROW]
[ROW][C]29[/C][C]5.5[/C][C]4.19811[/C][C]1.30189[/C][/ROW]
[ROW][C]30[/C][C]7[/C][C]4.57517[/C][C]2.42483[/C][/ROW]
[ROW][C]31[/C][C]9.5[/C][C]9.35425[/C][C]0.14575[/C][/ROW]
[ROW][C]32[/C][C]6[/C][C]5.63895[/C][C]0.361047[/C][/ROW]
[ROW][C]33[/C][C]9[/C][C]7.02678[/C][C]1.97322[/C][/ROW]
[ROW][C]34[/C][C]7.5[/C][C]7.89022[/C][C]-0.39022[/C][/ROW]
[ROW][C]35[/C][C]8.5[/C][C]11.0359[/C][C]-2.53593[/C][/ROW]
[ROW][C]36[/C][C]6.5[/C][C]5.84156[/C][C]0.658437[/C][/ROW]
[ROW][C]37[/C][C]8.5[/C][C]4.38956[/C][C]4.11044[/C][/ROW]
[ROW][C]38[/C][C]8[/C][C]8.84204[/C][C]-0.842041[/C][/ROW]
[ROW][C]39[/C][C]7[/C][C]5.89509[/C][C]1.10491[/C][/ROW]
[ROW][C]40[/C][C]9.5[/C][C]7.26225[/C][C]2.23775[/C][/ROW]
[ROW][C]41[/C][C]7[/C][C]5.80503[/C][C]1.19497[/C][/ROW]
[ROW][C]42[/C][C]3.5[/C][C]4.51543[/C][C]-1.01543[/C][/ROW]
[ROW][C]43[/C][C]6.5[/C][C]7.40833[/C][C]-0.908325[/C][/ROW]
[ROW][C]44[/C][C]6.5[/C][C]6.38101[/C][C]0.118994[/C][/ROW]
[ROW][C]45[/C][C]8.5[/C][C]6.40292[/C][C]2.09708[/C][/ROW]
[ROW][C]46[/C][C]4[/C][C]5.47242[/C][C]-1.47242[/C][/ROW]
[ROW][C]47[/C][C]8.5[/C][C]9.09603[/C][C]-0.596032[/C][/ROW]
[ROW][C]48[/C][C]8[/C][C]6.61634[/C][C]1.38366[/C][/ROW]
[ROW][C]49[/C][C]8.5[/C][C]6.11237[/C][C]2.38763[/C][/ROW]
[ROW][C]50[/C][C]7[/C][C]6.95548[/C][C]0.0445173[/C][/ROW]
[ROW][C]51[/C][C]8.5[/C][C]8.23625[/C][C]0.263747[/C][/ROW]
[ROW][C]52[/C][C]7.5[/C][C]5.49518[/C][C]2.00482[/C][/ROW]
[ROW][C]53[/C][C]8.5[/C][C]6.9989[/C][C]1.5011[/C][/ROW]
[ROW][C]54[/C][C]7[/C][C]6.52881[/C][C]0.471193[/C][/ROW]
[ROW][C]55[/C][C]10[/C][C]7.00498[/C][C]2.99502[/C][/ROW]
[ROW][C]56[/C][C]7.5[/C][C]5.89406[/C][C]1.60594[/C][/ROW]
[ROW][C]57[/C][C]5[/C][C]5.74337[/C][C]-0.743366[/C][/ROW]
[ROW][C]58[/C][C]8[/C][C]5.60248[/C][C]2.39752[/C][/ROW]
[ROW][C]59[/C][C]6.5[/C][C]6.00731[/C][C]0.49269[/C][/ROW]
[ROW][C]60[/C][C]8[/C][C]8.86811[/C][C]-0.868114[/C][/ROW]
[ROW][C]61[/C][C]9[/C][C]8.58392[/C][C]0.416082[/C][/ROW]
[ROW][C]62[/C][C]3[/C][C]5.06496[/C][C]-2.06496[/C][/ROW]
[ROW][C]63[/C][C]0.5[/C][C]5.42326[/C][C]-4.92326[/C][/ROW]
[ROW][C]64[/C][C]6.5[/C][C]5.84156[/C][C]0.658437[/C][/ROW]
[ROW][C]65[/C][C]4.5[/C][C]6.77674[/C][C]-2.27674[/C][/ROW]
[ROW][C]66[/C][C]8[/C][C]5.60248[/C][C]2.39752[/C][/ROW]
[ROW][C]67[/C][C]7.5[/C][C]7.67648[/C][C]-0.176475[/C][/ROW]
[ROW][C]68[/C][C]9.5[/C][C]5.71098[/C][C]3.78902[/C][/ROW]
[ROW][C]69[/C][C]6.5[/C][C]5.46247[/C][C]1.03753[/C][/ROW]
[ROW][C]70[/C][C]6[/C][C]5.72406[/C][C]0.275944[/C][/ROW]
[ROW][C]71[/C][C]8[/C][C]6.63075[/C][C]1.36925[/C][/ROW]
[ROW][C]72[/C][C]5[/C][C]6.30417[/C][C]-1.30417[/C][/ROW]
[/TABLE]
Source: https://freestatistics.org/blog/index.php?pk=267735&T=4

Globally Unique Identifier (entire table): ba.freestatistics.org/blog/index.php?pk=267735&T=4

As an alternative you can also use a QR Code:  

The GUIDs for individual cells are displayed in the table below:

Multiple Linear Regression - Actuals, Interpolation, and Residuals
Time or IndexActualsInterpolationForecastResidualsPrediction Error
135.41601-2.41601
27.57.037090.462915
365.72150.278501
465.603330.396674
515.74804-4.74804
665.153860.846137
755.60251-0.602513
816.43491-5.43491
96.54.962411.53759
107.55.94911.5509
113.55.44537-1.94537
127.55.721091.77891
136.55.058891.44111
1404.09471-4.09471
155.55.89414-0.394143
1655.35655-0.356547
1775.027871.97213
1804.57707-4.57707
194.54.402140.0978567
201.55.53515-4.03515
212.55.44442-2.94442
225.54.838120.661879
2385.278692.72131
2414.71291-3.71291
2555.73523-0.735227
2634.64077-1.64077
2734.35924-1.35924
2885.852322.14768
295.54.198111.30189
3074.575172.42483
319.59.354250.14575
3265.638950.361047
3397.026781.97322
347.57.89022-0.39022
358.511.0359-2.53593
366.55.841560.658437
378.54.389564.11044
3888.84204-0.842041
3975.895091.10491
409.57.262252.23775
4175.805031.19497
423.54.51543-1.01543
436.57.40833-0.908325
446.56.381010.118994
458.56.402922.09708
4645.47242-1.47242
478.59.09603-0.596032
4886.616341.38366
498.56.112372.38763
5076.955480.0445173
518.58.236250.263747
527.55.495182.00482
538.56.99891.5011
5476.528810.471193
55107.004982.99502
567.55.894061.60594
5755.74337-0.743366
5885.602482.39752
596.56.007310.49269
6088.86811-0.868114
6198.583920.416082
6235.06496-2.06496
630.55.42326-4.92326
646.55.841560.658437
654.56.77674-2.27674
6685.602482.39752
677.57.67648-0.176475
689.55.710983.78902
696.55.462471.03753
7065.724060.275944
7186.630751.36925
7256.30417-1.30417


Goldfeld-Quandt test for Heteroskedasticity
p-valuesAlternative Hypothesis
breakpoint indexgreater2-sidedless
80.9357540.1284930.0642465
90.8875990.2248030.112401
100.902360.1952790.0976395
110.8483970.3032050.151603
120.8211110.3577790.178889
130.7643650.4712690.235635
140.9086510.1826990.0913493
150.8635830.2728340.136417
160.8177850.3644290.182215
170.8472070.3055860.152793
180.9392060.1215880.060794
190.9095930.1808130.0904067
200.9450760.1098480.054924
210.9545370.09092580.0454629
220.9447950.110410.0552051
230.9671550.06569060.0328453
240.9857980.02840310.0142016
250.9792780.04144420.0207221
260.9770950.045810.022905
270.9769980.04600490.0230024
280.976180.04764030.0238202
290.9735970.05280580.0264029
300.9788390.04232170.0211608
310.9676870.06462650.0323133
320.9536570.09268580.0463429
330.9505140.0989720.049486
340.9323670.1352660.0676331
350.9285470.1429060.071453
360.9043420.1913160.0956581
370.9582550.08349030.0417451
380.9424240.1151520.0575758
390.9228080.1543840.0771921
400.9188140.1623720.081186
410.8919290.2161410.108071
420.8781630.2436750.121837
430.8449440.3101130.155056
440.7965110.4069770.203489
450.7707310.4585380.229269
460.7672180.4655650.232782
470.7056990.5886030.294301
480.652680.6946390.34732
490.649480.701040.35052
500.5714850.857030.428515
510.4899810.9799610.510019
520.485430.970860.51457
530.4315010.8630020.568499
540.3719320.7438630.628068
550.4740610.9481230.525939
560.3928770.7857530.607123
570.3246720.6493430.675328
580.3047360.6094720.695264
590.2201260.4402520.779874
600.1718770.3437550.828123
610.1093650.2187290.890635
620.08961650.1792330.910384
630.8191570.3616860.180843
640.9631030.07379340.0368967

\begin{tabular}{lllllllll}
\hline
Goldfeld-Quandt test for Heteroskedasticity \tabularnewline
p-values & Alternative Hypothesis \tabularnewline
breakpoint index & greater & 2-sided & less \tabularnewline
8 & 0.935754 & 0.128493 & 0.0642465 \tabularnewline
9 & 0.887599 & 0.224803 & 0.112401 \tabularnewline
10 & 0.90236 & 0.195279 & 0.0976395 \tabularnewline
11 & 0.848397 & 0.303205 & 0.151603 \tabularnewline
12 & 0.821111 & 0.357779 & 0.178889 \tabularnewline
13 & 0.764365 & 0.471269 & 0.235635 \tabularnewline
14 & 0.908651 & 0.182699 & 0.0913493 \tabularnewline
15 & 0.863583 & 0.272834 & 0.136417 \tabularnewline
16 & 0.817785 & 0.364429 & 0.182215 \tabularnewline
17 & 0.847207 & 0.305586 & 0.152793 \tabularnewline
18 & 0.939206 & 0.121588 & 0.060794 \tabularnewline
19 & 0.909593 & 0.180813 & 0.0904067 \tabularnewline
20 & 0.945076 & 0.109848 & 0.054924 \tabularnewline
21 & 0.954537 & 0.0909258 & 0.0454629 \tabularnewline
22 & 0.944795 & 0.11041 & 0.0552051 \tabularnewline
23 & 0.967155 & 0.0656906 & 0.0328453 \tabularnewline
24 & 0.985798 & 0.0284031 & 0.0142016 \tabularnewline
25 & 0.979278 & 0.0414442 & 0.0207221 \tabularnewline
26 & 0.977095 & 0.04581 & 0.022905 \tabularnewline
27 & 0.976998 & 0.0460049 & 0.0230024 \tabularnewline
28 & 0.97618 & 0.0476403 & 0.0238202 \tabularnewline
29 & 0.973597 & 0.0528058 & 0.0264029 \tabularnewline
30 & 0.978839 & 0.0423217 & 0.0211608 \tabularnewline
31 & 0.967687 & 0.0646265 & 0.0323133 \tabularnewline
32 & 0.953657 & 0.0926858 & 0.0463429 \tabularnewline
33 & 0.950514 & 0.098972 & 0.049486 \tabularnewline
34 & 0.932367 & 0.135266 & 0.0676331 \tabularnewline
35 & 0.928547 & 0.142906 & 0.071453 \tabularnewline
36 & 0.904342 & 0.191316 & 0.0956581 \tabularnewline
37 & 0.958255 & 0.0834903 & 0.0417451 \tabularnewline
38 & 0.942424 & 0.115152 & 0.0575758 \tabularnewline
39 & 0.922808 & 0.154384 & 0.0771921 \tabularnewline
40 & 0.918814 & 0.162372 & 0.081186 \tabularnewline
41 & 0.891929 & 0.216141 & 0.108071 \tabularnewline
42 & 0.878163 & 0.243675 & 0.121837 \tabularnewline
43 & 0.844944 & 0.310113 & 0.155056 \tabularnewline
44 & 0.796511 & 0.406977 & 0.203489 \tabularnewline
45 & 0.770731 & 0.458538 & 0.229269 \tabularnewline
46 & 0.767218 & 0.465565 & 0.232782 \tabularnewline
47 & 0.705699 & 0.588603 & 0.294301 \tabularnewline
48 & 0.65268 & 0.694639 & 0.34732 \tabularnewline
49 & 0.64948 & 0.70104 & 0.35052 \tabularnewline
50 & 0.571485 & 0.85703 & 0.428515 \tabularnewline
51 & 0.489981 & 0.979961 & 0.510019 \tabularnewline
52 & 0.48543 & 0.97086 & 0.51457 \tabularnewline
53 & 0.431501 & 0.863002 & 0.568499 \tabularnewline
54 & 0.371932 & 0.743863 & 0.628068 \tabularnewline
55 & 0.474061 & 0.948123 & 0.525939 \tabularnewline
56 & 0.392877 & 0.785753 & 0.607123 \tabularnewline
57 & 0.324672 & 0.649343 & 0.675328 \tabularnewline
58 & 0.304736 & 0.609472 & 0.695264 \tabularnewline
59 & 0.220126 & 0.440252 & 0.779874 \tabularnewline
60 & 0.171877 & 0.343755 & 0.828123 \tabularnewline
61 & 0.109365 & 0.218729 & 0.890635 \tabularnewline
62 & 0.0896165 & 0.179233 & 0.910384 \tabularnewline
63 & 0.819157 & 0.361686 & 0.180843 \tabularnewline
64 & 0.963103 & 0.0737934 & 0.0368967 \tabularnewline
\hline
\end{tabular}
%Source: https://freestatistics.org/blog/index.php?pk=267735&T=5

[TABLE]
[ROW][C]Goldfeld-Quandt test for Heteroskedasticity[/C][/ROW]
[ROW][C]p-values[/C][C]Alternative Hypothesis[/C][/ROW]
[ROW][C]breakpoint index[/C][C]greater[/C][C]2-sided[/C][C]less[/C][/ROW]
[ROW][C]8[/C][C]0.935754[/C][C]0.128493[/C][C]0.0642465[/C][/ROW]
[ROW][C]9[/C][C]0.887599[/C][C]0.224803[/C][C]0.112401[/C][/ROW]
[ROW][C]10[/C][C]0.90236[/C][C]0.195279[/C][C]0.0976395[/C][/ROW]
[ROW][C]11[/C][C]0.848397[/C][C]0.303205[/C][C]0.151603[/C][/ROW]
[ROW][C]12[/C][C]0.821111[/C][C]0.357779[/C][C]0.178889[/C][/ROW]
[ROW][C]13[/C][C]0.764365[/C][C]0.471269[/C][C]0.235635[/C][/ROW]
[ROW][C]14[/C][C]0.908651[/C][C]0.182699[/C][C]0.0913493[/C][/ROW]
[ROW][C]15[/C][C]0.863583[/C][C]0.272834[/C][C]0.136417[/C][/ROW]
[ROW][C]16[/C][C]0.817785[/C][C]0.364429[/C][C]0.182215[/C][/ROW]
[ROW][C]17[/C][C]0.847207[/C][C]0.305586[/C][C]0.152793[/C][/ROW]
[ROW][C]18[/C][C]0.939206[/C][C]0.121588[/C][C]0.060794[/C][/ROW]
[ROW][C]19[/C][C]0.909593[/C][C]0.180813[/C][C]0.0904067[/C][/ROW]
[ROW][C]20[/C][C]0.945076[/C][C]0.109848[/C][C]0.054924[/C][/ROW]
[ROW][C]21[/C][C]0.954537[/C][C]0.0909258[/C][C]0.0454629[/C][/ROW]
[ROW][C]22[/C][C]0.944795[/C][C]0.11041[/C][C]0.0552051[/C][/ROW]
[ROW][C]23[/C][C]0.967155[/C][C]0.0656906[/C][C]0.0328453[/C][/ROW]
[ROW][C]24[/C][C]0.985798[/C][C]0.0284031[/C][C]0.0142016[/C][/ROW]
[ROW][C]25[/C][C]0.979278[/C][C]0.0414442[/C][C]0.0207221[/C][/ROW]
[ROW][C]26[/C][C]0.977095[/C][C]0.04581[/C][C]0.022905[/C][/ROW]
[ROW][C]27[/C][C]0.976998[/C][C]0.0460049[/C][C]0.0230024[/C][/ROW]
[ROW][C]28[/C][C]0.97618[/C][C]0.0476403[/C][C]0.0238202[/C][/ROW]
[ROW][C]29[/C][C]0.973597[/C][C]0.0528058[/C][C]0.0264029[/C][/ROW]
[ROW][C]30[/C][C]0.978839[/C][C]0.0423217[/C][C]0.0211608[/C][/ROW]
[ROW][C]31[/C][C]0.967687[/C][C]0.0646265[/C][C]0.0323133[/C][/ROW]
[ROW][C]32[/C][C]0.953657[/C][C]0.0926858[/C][C]0.0463429[/C][/ROW]
[ROW][C]33[/C][C]0.950514[/C][C]0.098972[/C][C]0.049486[/C][/ROW]
[ROW][C]34[/C][C]0.932367[/C][C]0.135266[/C][C]0.0676331[/C][/ROW]
[ROW][C]35[/C][C]0.928547[/C][C]0.142906[/C][C]0.071453[/C][/ROW]
[ROW][C]36[/C][C]0.904342[/C][C]0.191316[/C][C]0.0956581[/C][/ROW]
[ROW][C]37[/C][C]0.958255[/C][C]0.0834903[/C][C]0.0417451[/C][/ROW]
[ROW][C]38[/C][C]0.942424[/C][C]0.115152[/C][C]0.0575758[/C][/ROW]
[ROW][C]39[/C][C]0.922808[/C][C]0.154384[/C][C]0.0771921[/C][/ROW]
[ROW][C]40[/C][C]0.918814[/C][C]0.162372[/C][C]0.081186[/C][/ROW]
[ROW][C]41[/C][C]0.891929[/C][C]0.216141[/C][C]0.108071[/C][/ROW]
[ROW][C]42[/C][C]0.878163[/C][C]0.243675[/C][C]0.121837[/C][/ROW]
[ROW][C]43[/C][C]0.844944[/C][C]0.310113[/C][C]0.155056[/C][/ROW]
[ROW][C]44[/C][C]0.796511[/C][C]0.406977[/C][C]0.203489[/C][/ROW]
[ROW][C]45[/C][C]0.770731[/C][C]0.458538[/C][C]0.229269[/C][/ROW]
[ROW][C]46[/C][C]0.767218[/C][C]0.465565[/C][C]0.232782[/C][/ROW]
[ROW][C]47[/C][C]0.705699[/C][C]0.588603[/C][C]0.294301[/C][/ROW]
[ROW][C]48[/C][C]0.65268[/C][C]0.694639[/C][C]0.34732[/C][/ROW]
[ROW][C]49[/C][C]0.64948[/C][C]0.70104[/C][C]0.35052[/C][/ROW]
[ROW][C]50[/C][C]0.571485[/C][C]0.85703[/C][C]0.428515[/C][/ROW]
[ROW][C]51[/C][C]0.489981[/C][C]0.979961[/C][C]0.510019[/C][/ROW]
[ROW][C]52[/C][C]0.48543[/C][C]0.97086[/C][C]0.51457[/C][/ROW]
[ROW][C]53[/C][C]0.431501[/C][C]0.863002[/C][C]0.568499[/C][/ROW]
[ROW][C]54[/C][C]0.371932[/C][C]0.743863[/C][C]0.628068[/C][/ROW]
[ROW][C]55[/C][C]0.474061[/C][C]0.948123[/C][C]0.525939[/C][/ROW]
[ROW][C]56[/C][C]0.392877[/C][C]0.785753[/C][C]0.607123[/C][/ROW]
[ROW][C]57[/C][C]0.324672[/C][C]0.649343[/C][C]0.675328[/C][/ROW]
[ROW][C]58[/C][C]0.304736[/C][C]0.609472[/C][C]0.695264[/C][/ROW]
[ROW][C]59[/C][C]0.220126[/C][C]0.440252[/C][C]0.779874[/C][/ROW]
[ROW][C]60[/C][C]0.171877[/C][C]0.343755[/C][C]0.828123[/C][/ROW]
[ROW][C]61[/C][C]0.109365[/C][C]0.218729[/C][C]0.890635[/C][/ROW]
[ROW][C]62[/C][C]0.0896165[/C][C]0.179233[/C][C]0.910384[/C][/ROW]
[ROW][C]63[/C][C]0.819157[/C][C]0.361686[/C][C]0.180843[/C][/ROW]
[ROW][C]64[/C][C]0.963103[/C][C]0.0737934[/C][C]0.0368967[/C][/ROW]
[/TABLE]
Source: https://freestatistics.org/blog/index.php?pk=267735&T=5

Globally Unique Identifier (entire table): ba.freestatistics.org/blog/index.php?pk=267735&T=5

As an alternative you can also use a QR Code:  

The GUIDs for individual cells are displayed in the table below:

Goldfeld-Quandt test for Heteroskedasticity
p-valuesAlternative Hypothesis
breakpoint indexgreater2-sidedless
80.9357540.1284930.0642465
90.8875990.2248030.112401
100.902360.1952790.0976395
110.8483970.3032050.151603
120.8211110.3577790.178889
130.7643650.4712690.235635
140.9086510.1826990.0913493
150.8635830.2728340.136417
160.8177850.3644290.182215
170.8472070.3055860.152793
180.9392060.1215880.060794
190.9095930.1808130.0904067
200.9450760.1098480.054924
210.9545370.09092580.0454629
220.9447950.110410.0552051
230.9671550.06569060.0328453
240.9857980.02840310.0142016
250.9792780.04144420.0207221
260.9770950.045810.022905
270.9769980.04600490.0230024
280.976180.04764030.0238202
290.9735970.05280580.0264029
300.9788390.04232170.0211608
310.9676870.06462650.0323133
320.9536570.09268580.0463429
330.9505140.0989720.049486
340.9323670.1352660.0676331
350.9285470.1429060.071453
360.9043420.1913160.0956581
370.9582550.08349030.0417451
380.9424240.1151520.0575758
390.9228080.1543840.0771921
400.9188140.1623720.081186
410.8919290.2161410.108071
420.8781630.2436750.121837
430.8449440.3101130.155056
440.7965110.4069770.203489
450.7707310.4585380.229269
460.7672180.4655650.232782
470.7056990.5886030.294301
480.652680.6946390.34732
490.649480.701040.35052
500.5714850.857030.428515
510.4899810.9799610.510019
520.485430.970860.51457
530.4315010.8630020.568499
540.3719320.7438630.628068
550.4740610.9481230.525939
560.3928770.7857530.607123
570.3246720.6493430.675328
580.3047360.6094720.695264
590.2201260.4402520.779874
600.1718770.3437550.828123
610.1093650.2187290.890635
620.08961650.1792330.910384
630.8191570.3616860.180843
640.9631030.07379340.0368967


Meta Analysis of Goldfeld-Quandt test for Heteroskedasticity
Description# significant tests% significant testsOK/NOK
1% type I error level00OK
5% type I error level60.105263NOK
10% type I error level140.245614NOK

\begin{tabular}{lllllllll}
\hline
Meta Analysis of Goldfeld-Quandt test for Heteroskedasticity \tabularnewline
Description & # significant tests & % significant tests & OK/NOK \tabularnewline
1% type I error level & 0 & 0 & OK \tabularnewline
5% type I error level & 6 & 0.105263 & NOK \tabularnewline
10% type I error level & 14 & 0.245614 & NOK \tabularnewline
\hline
\end{tabular}
%Source: https://freestatistics.org/blog/index.php?pk=267735&T=6

[TABLE]
[ROW][C]Meta Analysis of Goldfeld-Quandt test for Heteroskedasticity[/C][/ROW]
[ROW][C]Description[/C][C]# significant tests[/C][C]% significant tests[/C][C]OK/NOK[/C][/ROW]
[ROW][C]1% type I error level[/C][C]0[/C][C]0[/C][C]OK[/C][/ROW]
[ROW][C]5% type I error level[/C][C]6[/C][C]0.105263[/C][C]NOK[/C][/ROW]
[ROW][C]10% type I error level[/C][C]14[/C][C]0.245614[/C][C]NOK[/C][/ROW]
[/TABLE]
Source: https://freestatistics.org/blog/index.php?pk=267735&T=6

Globally Unique Identifier (entire table): ba.freestatistics.org/blog/index.php?pk=267735&T=6

As an alternative you can also use a QR Code:  

The GUIDs for individual cells are displayed in the table below:

Meta Analysis of Goldfeld-Quandt test for Heteroskedasticity
Description# significant tests% significant testsOK/NOK
1% type I error level00OK
5% type I error level60.105263NOK
10% type I error level140.245614NOK


Parameters (Session):
par1 = 5 ; par2 = Do not include Seasonal Dummies ; par3 = No Linear Trend ;
Parameters (R input):
par1 = 5 ; par2 = Do not include Seasonal Dummies ; par3 = No Linear Trend ;
R code (references can be found in the software module):
library(lattice)
library(lmtest)
n25 <- 25 #minimum number of obs. for Goldfeld-Quandt test
par1 <- as.numeric(par1)
x <- t(y)
k <- length(x[1,])
n <- length(x[,1])
x1 <- cbind(x[,par1], x[,1:k!=par1])
mycolnames <- c(colnames(x)[par1], colnames(x)[1:k!=par1])
colnames(x1) <- mycolnames #colnames(x)[par1]
x <- x1
if (par3 == 'First Differences'){
x2 <- array(0, dim=c(n-1,k), dimnames=list(1:(n-1), paste('(1-B)',colnames(x),sep='')))
for (i in 1:n-1) {
for (j in 1:k) {
x2[i,j] <- x[i+1,j] - x[i,j]
}
}
x <- x2
}
if (par2 == 'Include Monthly Dummies'){
x2 <- array(0, dim=c(n,11), dimnames=list(1:n, paste('M', seq(1:11), sep ='')))
for (i in 1:11){
x2[seq(i,n,12),i] <- 1
}
x <- cbind(x, x2)
}
if (par2 == 'Include Quarterly Dummies'){
x2 <- array(0, dim=c(n,3), dimnames=list(1:n, paste('Q', seq(1:3), sep ='')))
for (i in 1:3){
x2[seq(i,n,4),i] <- 1
}
x <- cbind(x, x2)
}
k <- length(x[1,])
if (par3 == 'Linear Trend'){
x <- cbind(x, c(1:n))
colnames(x)[k+1] <- 't'
}
x
k <- length(x[1,])
df <- as.data.frame(x)
(mylm <- lm(df))
(mysum <- summary(mylm))
if (n > n25) {
kp3 <- k + 3
nmkm3 <- n - k - 3
gqarr <- array(NA, dim=c(nmkm3-kp3+1,3))
numgqtests <- 0
numsignificant1 <- 0
numsignificant5 <- 0
numsignificant10 <- 0
for (mypoint in kp3:nmkm3) {
j <- 0
numgqtests <- numgqtests + 1
for (myalt in c('greater', 'two.sided', 'less')) {
j <- j + 1
gqarr[mypoint-kp3+1,j] <- gqtest(mylm, point=mypoint, alternative=myalt)$p.value
}
if (gqarr[mypoint-kp3+1,2] < 0.01) numsignificant1 <- numsignificant1 + 1
if (gqarr[mypoint-kp3+1,2] < 0.05) numsignificant5 <- numsignificant5 + 1
if (gqarr[mypoint-kp3+1,2] < 0.10) numsignificant10 <- numsignificant10 + 1
}
gqarr
}
bitmap(file='test0.png')
plot(x[,1], type='l', main='Actuals and Interpolation', ylab='value of Actuals and Interpolation (dots)', xlab='time or index')
points(x[,1]-mysum$resid)
grid()
dev.off()
bitmap(file='test1.png')
plot(mysum$resid, type='b', pch=19, main='Residuals', ylab='value of Residuals', xlab='time or index')
grid()
dev.off()
bitmap(file='test2.png')
hist(mysum$resid, main='Residual Histogram', xlab='values of Residuals')
grid()
dev.off()
bitmap(file='test3.png')
densityplot(~mysum$resid,col='black',main='Residual Density Plot', xlab='values of Residuals')
dev.off()
bitmap(file='test4.png')
qqnorm(mysum$resid, main='Residual Normal Q-Q Plot')
qqline(mysum$resid)
grid()
dev.off()
(myerror <- as.ts(mysum$resid))
bitmap(file='test5.png')
dum <- cbind(lag(myerror,k=1),myerror)
dum
dum1 <- dum[2:length(myerror),]
dum1
z <- as.data.frame(dum1)
z
plot(z,main=paste('Residual Lag plot, lowess, and regression line'), ylab='values of Residuals', xlab='lagged values of Residuals')
lines(lowess(z))
abline(lm(z))
grid()
dev.off()
bitmap(file='test6.png')
acf(mysum$resid, lag.max=length(mysum$resid)/2, main='Residual Autocorrelation Function')
grid()
dev.off()
bitmap(file='test7.png')
pacf(mysum$resid, lag.max=length(mysum$resid)/2, main='Residual Partial Autocorrelation Function')
grid()
dev.off()
bitmap(file='test8.png')
opar <- par(mfrow = c(2,2), oma = c(0, 0, 1.1, 0))
plot(mylm, las = 1, sub='Residual Diagnostics')
par(opar)
dev.off()
if (n > n25) {
bitmap(file='test9.png')
plot(kp3:nmkm3,gqarr[,2], main='Goldfeld-Quandt test',ylab='2-sided p-value',xlab='breakpoint')
grid()
dev.off()
}
load(file='createtable')
a<-table.start()
a<-table.row.start(a)
a<-table.element(a, 'Multiple Linear Regression - Estimated Regression Equation', 1, TRUE)
a<-table.row.end(a)
myeq <- colnames(x)[1]
myeq <- paste(myeq, '[t] = ', sep='')
for (i in 1:k){
if (mysum$coefficients[i,1] > 0) myeq <- paste(myeq, '+', '')
myeq <- paste(myeq, signif(mysum$coefficients[i,1],6), sep=' ')
if (rownames(mysum$coefficients)[i] != '(Intercept)') {
myeq <- paste(myeq, rownames(mysum$coefficients)[i], sep='')
if (rownames(mysum$coefficients)[i] != 't') myeq <- paste(myeq, '[t]', sep='')
}
}
myeq <- paste(myeq, ' + e[t]')
a<-table.row.start(a)
a<-table.element(a, myeq)
a<-table.row.end(a)
a<-table.end(a)
table.save(a,file='mytable1.tab')
a<-table.start()
a<-table.row.start(a)
a<-table.element(a,hyperlink('ols1.htm','Multiple Linear Regression - Ordinary Least Squares',''), 6, TRUE)
a<-table.row.end(a)
a<-table.row.start(a)
a<-table.element(a,'Variable',header=TRUE)
a<-table.element(a,'Parameter',header=TRUE)
a<-table.element(a,'S.D.',header=TRUE)
a<-table.element(a,'T-STAT
H0: parameter = 0',header=TRUE)
a<-table.element(a,'2-tail p-value',header=TRUE)
a<-table.element(a,'1-tail p-value',header=TRUE)
a<-table.row.end(a)
for (i in 1:k){
a<-table.row.start(a)
a<-table.element(a,rownames(mysum$coefficients)[i],header=TRUE)
a<-table.element(a,signif(mysum$coefficients[i,1],6))
a<-table.element(a, signif(mysum$coefficients[i,2],6))
a<-table.element(a, signif(mysum$coefficients[i,3],4))
a<-table.element(a, signif(mysum$coefficients[i,4],6))
a<-table.element(a, signif(mysum$coefficients[i,4]/2,6))
a<-table.row.end(a)
}
a<-table.end(a)
table.save(a,file='mytable2.tab')
a<-table.start()
a<-table.row.start(a)
a<-table.element(a, 'Multiple Linear Regression - Regression Statistics', 2, TRUE)
a<-table.row.end(a)
a<-table.row.start(a)
a<-table.element(a, 'Multiple R',1,TRUE)
a<-table.element(a, signif(sqrt(mysum$r.squared),6))
a<-table.row.end(a)
a<-table.row.start(a)
a<-table.element(a, 'R-squared',1,TRUE)
a<-table.element(a, signif(mysum$r.squared,6))
a<-table.row.end(a)
a<-table.row.start(a)
a<-table.element(a, 'Adjusted R-squared',1,TRUE)
a<-table.element(a, signif(mysum$adj.r.squared,6))
a<-table.row.end(a)
a<-table.row.start(a)
a<-table.element(a, 'F-TEST (value)',1,TRUE)
a<-table.element(a, signif(mysum$fstatistic[1],6))
a<-table.row.end(a)
a<-table.row.start(a)
a<-table.element(a, 'F-TEST (DF numerator)',1,TRUE)
a<-table.element(a, signif(mysum$fstatistic[2],6))
a<-table.row.end(a)
a<-table.row.start(a)
a<-table.element(a, 'F-TEST (DF denominator)',1,TRUE)
a<-table.element(a, signif(mysum$fstatistic[3],6))
a<-table.row.end(a)
a<-table.row.start(a)
a<-table.element(a, 'p-value',1,TRUE)
a<-table.element(a, signif(1-pf(mysum$fstatistic[1],mysum$fstatistic[2],mysum$fstatistic[3]),6))
a<-table.row.end(a)
a<-table.row.start(a)
a<-table.element(a, 'Multiple Linear Regression - Residual Statistics', 2, TRUE)
a<-table.row.end(a)
a<-table.row.start(a)
a<-table.element(a, 'Residual Standard Deviation',1,TRUE)
a<-table.element(a, signif(mysum$sigma,6))
a<-table.row.end(a)
a<-table.row.start(a)
a<-table.element(a, 'Sum Squared Residuals',1,TRUE)
a<-table.element(a, signif(sum(myerror*myerror),6))
a<-table.row.end(a)
a<-table.end(a)
table.save(a,file='mytable3.tab')
a<-table.start()
a<-table.row.start(a)
a<-table.element(a, 'Multiple Linear Regression - Actuals, Interpolation, and Residuals', 4, TRUE)
a<-table.row.end(a)
a<-table.row.start(a)
a<-table.element(a, 'Time or Index', 1, TRUE)
a<-table.element(a, 'Actuals', 1, TRUE)
a<-table.element(a, 'Interpolation
Forecast', 1, TRUE)
a<-table.element(a, 'Residuals
Prediction Error', 1, TRUE)
a<-table.row.end(a)
for (i in 1:n) {
a<-table.row.start(a)
a<-table.element(a,i, 1, TRUE)
a<-table.element(a,signif(x[i],6))
a<-table.element(a,signif(x[i]-mysum$resid[i],6))
a<-table.element(a,signif(mysum$resid[i],6))
a<-table.row.end(a)
}
a<-table.end(a)
table.save(a,file='mytable4.tab')
if (n > n25) {
a<-table.start()
a<-table.row.start(a)
a<-table.element(a,'Goldfeld-Quandt test for Heteroskedasticity',4,TRUE)
a<-table.row.end(a)
a<-table.row.start(a)
a<-table.element(a,'p-values',header=TRUE)
a<-table.element(a,'Alternative Hypothesis',3,header=TRUE)
a<-table.row.end(a)
a<-table.row.start(a)
a<-table.element(a,'breakpoint index',header=TRUE)
a<-table.element(a,'greater',header=TRUE)
a<-table.element(a,'2-sided',header=TRUE)
a<-table.element(a,'less',header=TRUE)
a<-table.row.end(a)
for (mypoint in kp3:nmkm3) {
a<-table.row.start(a)
a<-table.element(a,mypoint,header=TRUE)
a<-table.element(a,signif(gqarr[mypoint-kp3+1,1],6))
a<-table.element(a,signif(gqarr[mypoint-kp3+1,2],6))
a<-table.element(a,signif(gqarr[mypoint-kp3+1,3],6))
a<-table.row.end(a)
}
a<-table.end(a)
table.save(a,file='mytable5.tab')
a<-table.start()
a<-table.row.start(a)
a<-table.element(a,'Meta Analysis of Goldfeld-Quandt test for Heteroskedasticity',4,TRUE)
a<-table.row.end(a)
a<-table.row.start(a)
a<-table.element(a,'Description',header=TRUE)
a<-table.element(a,'# significant tests',header=TRUE)
a<-table.element(a,'% significant tests',header=TRUE)
a<-table.element(a,'OK/NOK',header=TRUE)
a<-table.row.end(a)
a<-table.row.start(a)
a<-table.element(a,'1% type I error level',header=TRUE)
a<-table.element(a,signif(numsignificant1,6))
a<-table.element(a,signif(numsignificant1/numgqtests,6))
if (numsignificant1/numgqtests < 0.01) dum <- 'OK' else dum <- 'NOK'
a<-table.element(a,dum)
a<-table.row.end(a)
a<-table.row.start(a)
a<-table.element(a,'5% type I error level',header=TRUE)
a<-table.element(a,signif(numsignificant5,6))
a<-table.element(a,signif(numsignificant5/numgqtests,6))
if (numsignificant5/numgqtests < 0.05) dum <- 'OK' else dum <- 'NOK'
a<-table.element(a,dum)
a<-table.row.end(a)
a<-table.row.start(a)
a<-table.element(a,'10% type I error level',header=TRUE)
a<-table.element(a,signif(numsignificant10,6))
a<-table.element(a,signif(numsignificant10/numgqtests,6))
if (numsignificant10/numgqtests < 0.1) dum <- 'OK' else dum <- 'NOK'
a<-table.element(a,dum)
a<-table.row.end(a)
a<-table.end(a)
table.save(a,file='mytable6.tab')
}