Free Statistics

of Irreproducible Research!

Author's title

Author*The author of this computation has been verified*
R Software Modulerwasp_multipleregression.wasp
Title produced by softwareMultiple Regression
Date of computationSun, 14 Dec 2014 16:37:55 +0000
Cite this page as followsStatistical Computations at FreeStatistics.org, Office for Research Development and Education, URL https://freestatistics.org/blog/index.php?v=date/2014/Dec/14/t1418575084rnamahdjrfa5h5b.htm/, Retrieved Thu, 16 May 2024 22:26:29 +0000
Statistical Computations at FreeStatistics.org, Office for Research Development and Education, URL https://freestatistics.org/blog/index.php?pk=267748, Retrieved Thu, 16 May 2024 22:26:29 +0000
QR Codes:

Original text written by user:
IsPrivate?No (this computation is public)
User-defined keywords
Estimated Impact81
Family? (F = Feedback message, R = changed R code, M = changed R Module, P = changed Parameters, D = changed Data)
-       [Multiple Regression] [dfdf] [2014-12-14 16:37:55] [624214a256768d6065ce8a528542dcc5] [Current]
Feedback Forum

Post a new message
Dataseries X:
12.9	26	50
12.2	57	62
12.8	37	54
7.4	67	71
6.7	43	54
12.6	52	65
14.8	52	73
13.3	43	52
11.1	84	84
8.2	67	42
11.4	49	66
6.4	70	65
10.6	52	78
12	58	73
6.3	68	75
11.9	43	66
9.3	56	70
10	74	81
6.4	65	71
13.8	63	69
10.8	58	71
13.8	57	72
11.7	63	68
10.9	53	70
9.9	64	67
11.5	53	76
8.3	29	70
11.7	54	60
9	58	72
9.7	43	69
10.8	51	71
10.3	53	62
10.4	54	70
9.3	61	58
11.8	47	76
5.9	39	52
11.4	48	59
13	50	68
10.8	35	76
11.3	68	67
11.8	49	59
12.7	67	76
10.9	43	60
13.3	62	63
10.1	57	70
14.3	54	66
9.3	61	64
12.5	56	70
7.6	41	75
15.9	43	61
9.2	53	60
11.1	66	73
13	58	61
14.5	46	66
12.3	51	59
11.4	51	64
12.6	37	78
13	42	67
13.2	66	66
7.7	53	71


Summary of computational transaction
Raw Inputview raw input (R code)
Raw Outputview raw output of R engine
Computing time5 seconds
R Server'Gertrude Mary Cox' @ cox.wessa.net
R Framework error message
The field 'Names of X columns' contains a hard return which cannot be interpreted.
Please, resubmit your request without hard returns in the 'Names of X columns'.

\begin{tabular}{lllllllll}
\hline
Summary of computational transaction \tabularnewline
Raw Input & view raw input (R code)  \tabularnewline
Raw Output & view raw output of R engine  \tabularnewline
Computing time & 5 seconds \tabularnewline
R Server & 'Gertrude Mary Cox' @ cox.wessa.net \tabularnewline
R Framework error message & 
The field 'Names of X columns' contains a hard return which cannot be interpreted.
Please, resubmit your request without hard returns in the 'Names of X columns'.
\tabularnewline \hline \end{tabular} %Source: https://freestatistics.org/blog/index.php?pk=267748&T=0

[TABLE]
[ROW][C]Summary of computational transaction[/C][/ROW]
[ROW][C]Raw Input[/C][C]view raw input (R code) [/C][/ROW]
[ROW][C]Raw Output[/C][C]view raw output of R engine [/C][/ROW]
[ROW][C]Computing time[/C][C]5 seconds[/C][/ROW]
[ROW][C]R Server[/C][C]'Gertrude Mary Cox' @ cox.wessa.net[/C][/ROW]
[ROW][C]R Framework error message[/C][C]
The field 'Names of X columns' contains a hard return which cannot be interpreted.
Please, resubmit your request without hard returns in the 'Names of X columns'.
[/C][/ROW] [/TABLE] Source: https://freestatistics.org/blog/index.php?pk=267748&T=0

Globally Unique Identifier (entire table): ba.freestatistics.org/blog/index.php?pk=267748&T=0

As an alternative you can also use a QR Code:  

The GUIDs for individual cells are displayed in the table below:

Summary of computational transaction
Raw Inputview raw input (R code)
Raw Outputview raw output of R engine
Computing time5 seconds
R Server'Gertrude Mary Cox' @ cox.wessa.net
R Framework error message
The field 'Names of X columns' contains a hard return which cannot be interpreted.
Please, resubmit your request without hard returns in the 'Names of X columns'.


Multiple Linear Regression - Estimated Regression Equation
TOT.S[t] = + 11.8611 -0.0364322AMS.I.S[t] + 0.0160954`AMS.E.S\r`[t] + e[t]

\begin{tabular}{lllllllll}
\hline
Multiple Linear Regression - Estimated Regression Equation \tabularnewline
TOT.S[t] =  +  11.8611 -0.0364322AMS.I.S[t] +  0.0160954`AMS.E.S\r`[t]  + e[t] \tabularnewline
\hline
\end{tabular}
%Source: https://freestatistics.org/blog/index.php?pk=267748&T=1

[TABLE]
[ROW][C]Multiple Linear Regression - Estimated Regression Equation[/C][/ROW]
[ROW][C]TOT.S[t] =  +  11.8611 -0.0364322AMS.I.S[t] +  0.0160954`AMS.E.S\r`[t]  + e[t][/C][/ROW]
[/TABLE]
Source: https://freestatistics.org/blog/index.php?pk=267748&T=1

Globally Unique Identifier (entire table): ba.freestatistics.org/blog/index.php?pk=267748&T=1

As an alternative you can also use a QR Code:  

The GUIDs for individual cells are displayed in the table below:

Multiple Linear Regression - Estimated Regression Equation
TOT.S[t] = + 11.8611 -0.0364322AMS.I.S[t] + 0.0160954`AMS.E.S\r`[t] + e[t]


Multiple Linear Regression - Ordinary Least Squares
VariableParameterS.D.T-STATH0: parameter = 02-tail p-value1-tail p-value
(Intercept)11.86112.618824.5293.07212e-051.53606e-05
AMS.I.S-0.03643220.0284593-1.280.2056770.102839
`AMS.E.S\r`0.01609540.03948140.40770.6850440.342522

\begin{tabular}{lllllllll}
\hline
Multiple Linear Regression - Ordinary Least Squares \tabularnewline
Variable & Parameter & S.D. & T-STATH0: parameter = 0 & 2-tail p-value & 1-tail p-value \tabularnewline
(Intercept) & 11.8611 & 2.61882 & 4.529 & 3.07212e-05 & 1.53606e-05 \tabularnewline
AMS.I.S & -0.0364322 & 0.0284593 & -1.28 & 0.205677 & 0.102839 \tabularnewline
`AMS.E.S\r` & 0.0160954 & 0.0394814 & 0.4077 & 0.685044 & 0.342522 \tabularnewline
\hline
\end{tabular}
%Source: https://freestatistics.org/blog/index.php?pk=267748&T=2

[TABLE]
[ROW][C]Multiple Linear Regression - Ordinary Least Squares[/C][/ROW]
[ROW][C]Variable[/C][C]Parameter[/C][C]S.D.[/C][C]T-STATH0: parameter = 0[/C][C]2-tail p-value[/C][C]1-tail p-value[/C][/ROW]
[ROW][C](Intercept)[/C][C]11.8611[/C][C]2.61882[/C][C]4.529[/C][C]3.07212e-05[/C][C]1.53606e-05[/C][/ROW]
[ROW][C]AMS.I.S[/C][C]-0.0364322[/C][C]0.0284593[/C][C]-1.28[/C][C]0.205677[/C][C]0.102839[/C][/ROW]
[ROW][C]`AMS.E.S\r`[/C][C]0.0160954[/C][C]0.0394814[/C][C]0.4077[/C][C]0.685044[/C][C]0.342522[/C][/ROW]
[/TABLE]
Source: https://freestatistics.org/blog/index.php?pk=267748&T=2

Globally Unique Identifier (entire table): ba.freestatistics.org/blog/index.php?pk=267748&T=2

As an alternative you can also use a QR Code:  

The GUIDs for individual cells are displayed in the table below:

Multiple Linear Regression - Ordinary Least Squares
VariableParameterS.D.T-STATH0: parameter = 02-tail p-value1-tail p-value
(Intercept)11.86112.618824.5293.07212e-051.53606e-05
AMS.I.S-0.03643220.0284593-1.280.2056770.102839
`AMS.E.S\r`0.01609540.03948140.40770.6850440.342522


Multiple Linear Regression - Regression Statistics
Multiple R0.167179
R-squared0.0279487
Adjusted R-squared-0.00615831
F-TEST (value)0.819442
F-TEST (DF numerator)2
F-TEST (DF denominator)57
p-value0.445801
Multiple Linear Regression - Residual Statistics
Residual Standard Deviation2.3031
Sum Squared Residuals302.343

\begin{tabular}{lllllllll}
\hline
Multiple Linear Regression - Regression Statistics \tabularnewline
Multiple R & 0.167179 \tabularnewline
R-squared & 0.0279487 \tabularnewline
Adjusted R-squared & -0.00615831 \tabularnewline
F-TEST (value) & 0.819442 \tabularnewline
F-TEST (DF numerator) & 2 \tabularnewline
F-TEST (DF denominator) & 57 \tabularnewline
p-value & 0.445801 \tabularnewline
Multiple Linear Regression - Residual Statistics \tabularnewline
Residual Standard Deviation & 2.3031 \tabularnewline
Sum Squared Residuals & 302.343 \tabularnewline
\hline
\end{tabular}
%Source: https://freestatistics.org/blog/index.php?pk=267748&T=3

[TABLE]
[ROW][C]Multiple Linear Regression - Regression Statistics[/C][/ROW]
[ROW][C]Multiple R[/C][C]0.167179[/C][/ROW]
[ROW][C]R-squared[/C][C]0.0279487[/C][/ROW]
[ROW][C]Adjusted R-squared[/C][C]-0.00615831[/C][/ROW]
[ROW][C]F-TEST (value)[/C][C]0.819442[/C][/ROW]
[ROW][C]F-TEST (DF numerator)[/C][C]2[/C][/ROW]
[ROW][C]F-TEST (DF denominator)[/C][C]57[/C][/ROW]
[ROW][C]p-value[/C][C]0.445801[/C][/ROW]
[ROW][C]Multiple Linear Regression - Residual Statistics[/C][/ROW]
[ROW][C]Residual Standard Deviation[/C][C]2.3031[/C][/ROW]
[ROW][C]Sum Squared Residuals[/C][C]302.343[/C][/ROW]
[/TABLE]
Source: https://freestatistics.org/blog/index.php?pk=267748&T=3

Globally Unique Identifier (entire table): ba.freestatistics.org/blog/index.php?pk=267748&T=3

As an alternative you can also use a QR Code:  

The GUIDs for individual cells are displayed in the table below:

Multiple Linear Regression - Regression Statistics
Multiple R0.167179
R-squared0.0279487
Adjusted R-squared-0.00615831
F-TEST (value)0.819442
F-TEST (DF numerator)2
F-TEST (DF denominator)57
p-value0.445801
Multiple Linear Regression - Residual Statistics
Residual Standard Deviation2.3031
Sum Squared Residuals302.343


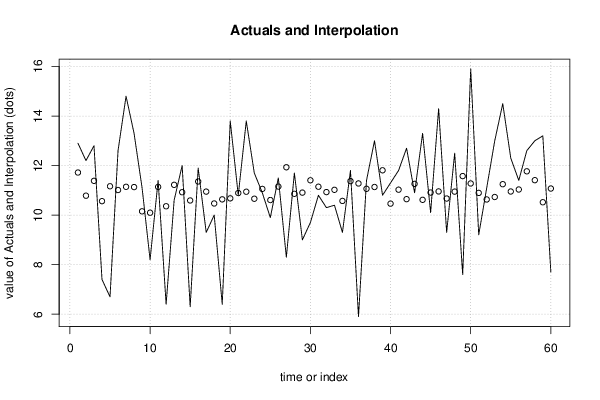
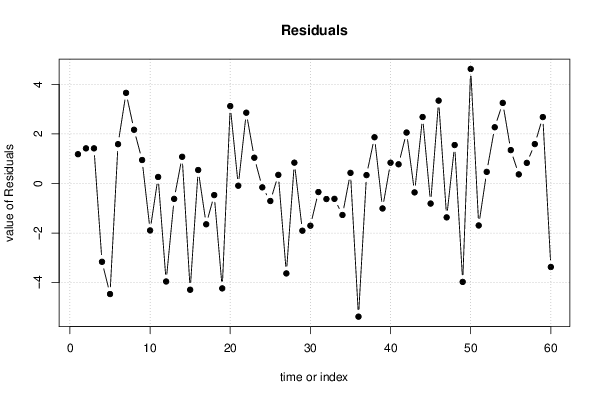
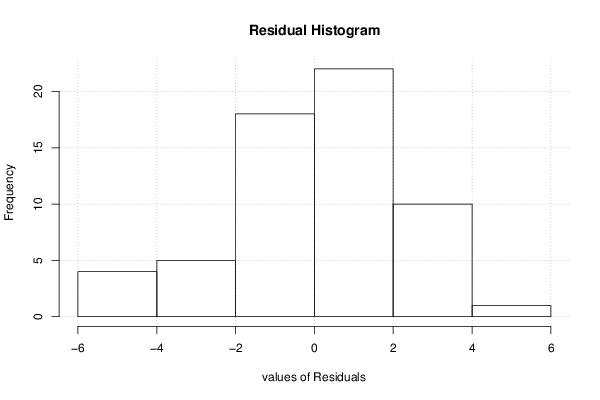
Multiple Linear Regression - Actuals, Interpolation, and Residuals
Time or IndexActualsInterpolationForecastResidualsPrediction Error
112.911.71861.18137
212.210.78241.41763
312.811.38231.41774
47.410.5629-3.16291
56.711.1637-4.46366
612.611.01281.58718
714.811.14163.65842
813.311.13152.16853
911.110.15280.947196
108.210.0961-1.89615
1111.411.13820.261786
126.410.357-3.95704
1310.611.2221-0.622061
141210.9231.07701
156.310.5909-4.29086
1611.911.35680.543194
179.310.9476-1.64757
181010.4688-0.46884
196.410.6358-4.23578
2013.810.67643.12355
2110.810.8908-0.0908008
2213.810.94332.85667
2311.710.66041.03965
2410.911.0569-0.156866
259.910.6078-0.707826
2611.511.15340.346562
278.311.9312-3.63124
2811.710.85950.840519
29910.9069-1.9069
309.711.4051-1.70509
3110.811.1458-0.345826
3210.310.9281-0.628103
3310.411.0204-0.620434
349.310.5723-1.27226
3511.811.3720.427969
365.911.2772-5.3772
3711.411.0620.338022
381311.1341.86603
3910.811.8092-1.00922
4011.310.46210.837902
4111.811.02550.774454
4212.710.64342.05661
4310.911.2602-0.360234
4413.310.61632.68369
4510.110.9111-0.811138
4614.310.95613.34395
479.310.6688-1.36884
4812.510.94761.55243
497.611.5745-3.97453
5015.911.27634.62367
519.210.8959-1.69591
5211.110.63150.468466
531310.72982.27015
5414.511.24753.25249
5512.310.95271.34732
5611.411.03320.366842
5712.611.76850.831456
581311.40931.59067
5913.210.51892.68113
607.711.073-3.37296

\begin{tabular}{lllllllll}
\hline
Multiple Linear Regression - Actuals, Interpolation, and Residuals \tabularnewline
Time or Index & Actuals & InterpolationForecast & ResidualsPrediction Error \tabularnewline
1 & 12.9 & 11.7186 & 1.18137 \tabularnewline
2 & 12.2 & 10.7824 & 1.41763 \tabularnewline
3 & 12.8 & 11.3823 & 1.41774 \tabularnewline
4 & 7.4 & 10.5629 & -3.16291 \tabularnewline
5 & 6.7 & 11.1637 & -4.46366 \tabularnewline
6 & 12.6 & 11.0128 & 1.58718 \tabularnewline
7 & 14.8 & 11.1416 & 3.65842 \tabularnewline
8 & 13.3 & 11.1315 & 2.16853 \tabularnewline
9 & 11.1 & 10.1528 & 0.947196 \tabularnewline
10 & 8.2 & 10.0961 & -1.89615 \tabularnewline
11 & 11.4 & 11.1382 & 0.261786 \tabularnewline
12 & 6.4 & 10.357 & -3.95704 \tabularnewline
13 & 10.6 & 11.2221 & -0.622061 \tabularnewline
14 & 12 & 10.923 & 1.07701 \tabularnewline
15 & 6.3 & 10.5909 & -4.29086 \tabularnewline
16 & 11.9 & 11.3568 & 0.543194 \tabularnewline
17 & 9.3 & 10.9476 & -1.64757 \tabularnewline
18 & 10 & 10.4688 & -0.46884 \tabularnewline
19 & 6.4 & 10.6358 & -4.23578 \tabularnewline
20 & 13.8 & 10.6764 & 3.12355 \tabularnewline
21 & 10.8 & 10.8908 & -0.0908008 \tabularnewline
22 & 13.8 & 10.9433 & 2.85667 \tabularnewline
23 & 11.7 & 10.6604 & 1.03965 \tabularnewline
24 & 10.9 & 11.0569 & -0.156866 \tabularnewline
25 & 9.9 & 10.6078 & -0.707826 \tabularnewline
26 & 11.5 & 11.1534 & 0.346562 \tabularnewline
27 & 8.3 & 11.9312 & -3.63124 \tabularnewline
28 & 11.7 & 10.8595 & 0.840519 \tabularnewline
29 & 9 & 10.9069 & -1.9069 \tabularnewline
30 & 9.7 & 11.4051 & -1.70509 \tabularnewline
31 & 10.8 & 11.1458 & -0.345826 \tabularnewline
32 & 10.3 & 10.9281 & -0.628103 \tabularnewline
33 & 10.4 & 11.0204 & -0.620434 \tabularnewline
34 & 9.3 & 10.5723 & -1.27226 \tabularnewline
35 & 11.8 & 11.372 & 0.427969 \tabularnewline
36 & 5.9 & 11.2772 & -5.3772 \tabularnewline
37 & 11.4 & 11.062 & 0.338022 \tabularnewline
38 & 13 & 11.134 & 1.86603 \tabularnewline
39 & 10.8 & 11.8092 & -1.00922 \tabularnewline
40 & 11.3 & 10.4621 & 0.837902 \tabularnewline
41 & 11.8 & 11.0255 & 0.774454 \tabularnewline
42 & 12.7 & 10.6434 & 2.05661 \tabularnewline
43 & 10.9 & 11.2602 & -0.360234 \tabularnewline
44 & 13.3 & 10.6163 & 2.68369 \tabularnewline
45 & 10.1 & 10.9111 & -0.811138 \tabularnewline
46 & 14.3 & 10.9561 & 3.34395 \tabularnewline
47 & 9.3 & 10.6688 & -1.36884 \tabularnewline
48 & 12.5 & 10.9476 & 1.55243 \tabularnewline
49 & 7.6 & 11.5745 & -3.97453 \tabularnewline
50 & 15.9 & 11.2763 & 4.62367 \tabularnewline
51 & 9.2 & 10.8959 & -1.69591 \tabularnewline
52 & 11.1 & 10.6315 & 0.468466 \tabularnewline
53 & 13 & 10.7298 & 2.27015 \tabularnewline
54 & 14.5 & 11.2475 & 3.25249 \tabularnewline
55 & 12.3 & 10.9527 & 1.34732 \tabularnewline
56 & 11.4 & 11.0332 & 0.366842 \tabularnewline
57 & 12.6 & 11.7685 & 0.831456 \tabularnewline
58 & 13 & 11.4093 & 1.59067 \tabularnewline
59 & 13.2 & 10.5189 & 2.68113 \tabularnewline
60 & 7.7 & 11.073 & -3.37296 \tabularnewline
\hline
\end{tabular}
%Source: https://freestatistics.org/blog/index.php?pk=267748&T=4

[TABLE]
[ROW][C]Multiple Linear Regression - Actuals, Interpolation, and Residuals[/C][/ROW]
[ROW][C]Time or Index[/C][C]Actuals[/C][C]InterpolationForecast[/C][C]ResidualsPrediction Error[/C][/ROW]
[ROW][C]1[/C][C]12.9[/C][C]11.7186[/C][C]1.18137[/C][/ROW]
[ROW][C]2[/C][C]12.2[/C][C]10.7824[/C][C]1.41763[/C][/ROW]
[ROW][C]3[/C][C]12.8[/C][C]11.3823[/C][C]1.41774[/C][/ROW]
[ROW][C]4[/C][C]7.4[/C][C]10.5629[/C][C]-3.16291[/C][/ROW]
[ROW][C]5[/C][C]6.7[/C][C]11.1637[/C][C]-4.46366[/C][/ROW]
[ROW][C]6[/C][C]12.6[/C][C]11.0128[/C][C]1.58718[/C][/ROW]
[ROW][C]7[/C][C]14.8[/C][C]11.1416[/C][C]3.65842[/C][/ROW]
[ROW][C]8[/C][C]13.3[/C][C]11.1315[/C][C]2.16853[/C][/ROW]
[ROW][C]9[/C][C]11.1[/C][C]10.1528[/C][C]0.947196[/C][/ROW]
[ROW][C]10[/C][C]8.2[/C][C]10.0961[/C][C]-1.89615[/C][/ROW]
[ROW][C]11[/C][C]11.4[/C][C]11.1382[/C][C]0.261786[/C][/ROW]
[ROW][C]12[/C][C]6.4[/C][C]10.357[/C][C]-3.95704[/C][/ROW]
[ROW][C]13[/C][C]10.6[/C][C]11.2221[/C][C]-0.622061[/C][/ROW]
[ROW][C]14[/C][C]12[/C][C]10.923[/C][C]1.07701[/C][/ROW]
[ROW][C]15[/C][C]6.3[/C][C]10.5909[/C][C]-4.29086[/C][/ROW]
[ROW][C]16[/C][C]11.9[/C][C]11.3568[/C][C]0.543194[/C][/ROW]
[ROW][C]17[/C][C]9.3[/C][C]10.9476[/C][C]-1.64757[/C][/ROW]
[ROW][C]18[/C][C]10[/C][C]10.4688[/C][C]-0.46884[/C][/ROW]
[ROW][C]19[/C][C]6.4[/C][C]10.6358[/C][C]-4.23578[/C][/ROW]
[ROW][C]20[/C][C]13.8[/C][C]10.6764[/C][C]3.12355[/C][/ROW]
[ROW][C]21[/C][C]10.8[/C][C]10.8908[/C][C]-0.0908008[/C][/ROW]
[ROW][C]22[/C][C]13.8[/C][C]10.9433[/C][C]2.85667[/C][/ROW]
[ROW][C]23[/C][C]11.7[/C][C]10.6604[/C][C]1.03965[/C][/ROW]
[ROW][C]24[/C][C]10.9[/C][C]11.0569[/C][C]-0.156866[/C][/ROW]
[ROW][C]25[/C][C]9.9[/C][C]10.6078[/C][C]-0.707826[/C][/ROW]
[ROW][C]26[/C][C]11.5[/C][C]11.1534[/C][C]0.346562[/C][/ROW]
[ROW][C]27[/C][C]8.3[/C][C]11.9312[/C][C]-3.63124[/C][/ROW]
[ROW][C]28[/C][C]11.7[/C][C]10.8595[/C][C]0.840519[/C][/ROW]
[ROW][C]29[/C][C]9[/C][C]10.9069[/C][C]-1.9069[/C][/ROW]
[ROW][C]30[/C][C]9.7[/C][C]11.4051[/C][C]-1.70509[/C][/ROW]
[ROW][C]31[/C][C]10.8[/C][C]11.1458[/C][C]-0.345826[/C][/ROW]
[ROW][C]32[/C][C]10.3[/C][C]10.9281[/C][C]-0.628103[/C][/ROW]
[ROW][C]33[/C][C]10.4[/C][C]11.0204[/C][C]-0.620434[/C][/ROW]
[ROW][C]34[/C][C]9.3[/C][C]10.5723[/C][C]-1.27226[/C][/ROW]
[ROW][C]35[/C][C]11.8[/C][C]11.372[/C][C]0.427969[/C][/ROW]
[ROW][C]36[/C][C]5.9[/C][C]11.2772[/C][C]-5.3772[/C][/ROW]
[ROW][C]37[/C][C]11.4[/C][C]11.062[/C][C]0.338022[/C][/ROW]
[ROW][C]38[/C][C]13[/C][C]11.134[/C][C]1.86603[/C][/ROW]
[ROW][C]39[/C][C]10.8[/C][C]11.8092[/C][C]-1.00922[/C][/ROW]
[ROW][C]40[/C][C]11.3[/C][C]10.4621[/C][C]0.837902[/C][/ROW]
[ROW][C]41[/C][C]11.8[/C][C]11.0255[/C][C]0.774454[/C][/ROW]
[ROW][C]42[/C][C]12.7[/C][C]10.6434[/C][C]2.05661[/C][/ROW]
[ROW][C]43[/C][C]10.9[/C][C]11.2602[/C][C]-0.360234[/C][/ROW]
[ROW][C]44[/C][C]13.3[/C][C]10.6163[/C][C]2.68369[/C][/ROW]
[ROW][C]45[/C][C]10.1[/C][C]10.9111[/C][C]-0.811138[/C][/ROW]
[ROW][C]46[/C][C]14.3[/C][C]10.9561[/C][C]3.34395[/C][/ROW]
[ROW][C]47[/C][C]9.3[/C][C]10.6688[/C][C]-1.36884[/C][/ROW]
[ROW][C]48[/C][C]12.5[/C][C]10.9476[/C][C]1.55243[/C][/ROW]
[ROW][C]49[/C][C]7.6[/C][C]11.5745[/C][C]-3.97453[/C][/ROW]
[ROW][C]50[/C][C]15.9[/C][C]11.2763[/C][C]4.62367[/C][/ROW]
[ROW][C]51[/C][C]9.2[/C][C]10.8959[/C][C]-1.69591[/C][/ROW]
[ROW][C]52[/C][C]11.1[/C][C]10.6315[/C][C]0.468466[/C][/ROW]
[ROW][C]53[/C][C]13[/C][C]10.7298[/C][C]2.27015[/C][/ROW]
[ROW][C]54[/C][C]14.5[/C][C]11.2475[/C][C]3.25249[/C][/ROW]
[ROW][C]55[/C][C]12.3[/C][C]10.9527[/C][C]1.34732[/C][/ROW]
[ROW][C]56[/C][C]11.4[/C][C]11.0332[/C][C]0.366842[/C][/ROW]
[ROW][C]57[/C][C]12.6[/C][C]11.7685[/C][C]0.831456[/C][/ROW]
[ROW][C]58[/C][C]13[/C][C]11.4093[/C][C]1.59067[/C][/ROW]
[ROW][C]59[/C][C]13.2[/C][C]10.5189[/C][C]2.68113[/C][/ROW]
[ROW][C]60[/C][C]7.7[/C][C]11.073[/C][C]-3.37296[/C][/ROW]
[/TABLE]
Source: https://freestatistics.org/blog/index.php?pk=267748&T=4

Globally Unique Identifier (entire table): ba.freestatistics.org/blog/index.php?pk=267748&T=4

As an alternative you can also use a QR Code:  

The GUIDs for individual cells are displayed in the table below:

Multiple Linear Regression - Actuals, Interpolation, and Residuals
Time or IndexActualsInterpolationForecastResidualsPrediction Error
112.911.71861.18137
212.210.78241.41763
312.811.38231.41774
47.410.5629-3.16291
56.711.1637-4.46366
612.611.01281.58718
714.811.14163.65842
813.311.13152.16853
911.110.15280.947196
108.210.0961-1.89615
1111.411.13820.261786
126.410.357-3.95704
1310.611.2221-0.622061
141210.9231.07701
156.310.5909-4.29086
1611.911.35680.543194
179.310.9476-1.64757
181010.4688-0.46884
196.410.6358-4.23578
2013.810.67643.12355
2110.810.8908-0.0908008
2213.810.94332.85667
2311.710.66041.03965
2410.911.0569-0.156866
259.910.6078-0.707826
2611.511.15340.346562
278.311.9312-3.63124
2811.710.85950.840519
29910.9069-1.9069
309.711.4051-1.70509
3110.811.1458-0.345826
3210.310.9281-0.628103
3310.411.0204-0.620434
349.310.5723-1.27226
3511.811.3720.427969
365.911.2772-5.3772
3711.411.0620.338022
381311.1341.86603
3910.811.8092-1.00922
4011.310.46210.837902
4111.811.02550.774454
4212.710.64342.05661
4310.911.2602-0.360234
4413.310.61632.68369
4510.110.9111-0.811138
4614.310.95613.34395
479.310.6688-1.36884
4812.510.94761.55243
497.611.5745-3.97453
5015.911.27634.62367
519.210.8959-1.69591
5211.110.63150.468466
531310.72982.27015
5414.511.24753.25249
5512.310.95271.34732
5611.411.03320.366842
5712.611.76850.831456
581311.40931.59067
5913.210.51892.68113
607.711.073-3.37296


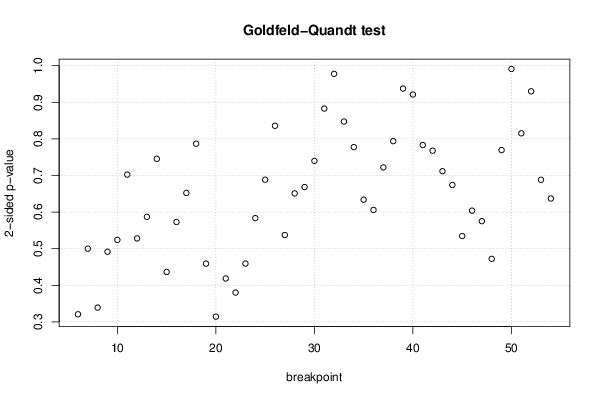
Goldfeld-Quandt test for Heteroskedasticity
p-valuesAlternative Hypothesis
breakpoint indexgreater2-sidedless
60.8395870.3208260.160413
70.7499940.5000110.250006
80.8304750.3390490.169525
90.7541570.4916860.245843
100.737980.5240410.26202
110.6487850.7024310.351215
120.7359770.5280450.264023
130.7064890.5870210.293511
140.6272420.7455160.372758
150.781820.4363590.21818
160.7135140.5729730.286486
170.6739040.6521930.326096
180.6066250.7867510.393375
190.7704440.4591120.229556
200.8428430.3143150.157157
210.7907190.4185610.209281
220.8099540.3800920.190046
230.7703030.4593940.229697
240.7082310.5835380.291769
250.6558050.688390.344195
260.5821270.8357460.417873
270.7313280.5373450.268672
280.6744780.6510440.325522
290.6658510.6682990.334149
300.6300690.7398620.369931
310.5585670.8828660.441433
320.4888260.9776520.511174
330.4237340.8474690.576266
340.3887630.7775260.611237
350.3169090.6338180.683091
360.6970620.6058770.302938
370.6389710.7220570.361029
380.6031490.7937020.396851
390.5312660.9374690.468734
400.4606170.9212330.539383
410.391570.7831390.60843
420.3838380.7676750.616162
430.3557940.7115870.644206
440.3370480.6740960.662952
450.267270.5345410.73273
460.3019520.6039030.698048
470.2875670.5751330.712433
480.2361310.4722620.763869
490.3846960.7693920.615304
500.4955160.9910320.504484
510.5923930.8152130.407607
520.4649660.9299330.535034
530.3441220.6882450.655878
540.318540.6370810.68146

\begin{tabular}{lllllllll}
\hline
Goldfeld-Quandt test for Heteroskedasticity \tabularnewline
p-values & Alternative Hypothesis \tabularnewline
breakpoint index & greater & 2-sided & less \tabularnewline
6 & 0.839587 & 0.320826 & 0.160413 \tabularnewline
7 & 0.749994 & 0.500011 & 0.250006 \tabularnewline
8 & 0.830475 & 0.339049 & 0.169525 \tabularnewline
9 & 0.754157 & 0.491686 & 0.245843 \tabularnewline
10 & 0.73798 & 0.524041 & 0.26202 \tabularnewline
11 & 0.648785 & 0.702431 & 0.351215 \tabularnewline
12 & 0.735977 & 0.528045 & 0.264023 \tabularnewline
13 & 0.706489 & 0.587021 & 0.293511 \tabularnewline
14 & 0.627242 & 0.745516 & 0.372758 \tabularnewline
15 & 0.78182 & 0.436359 & 0.21818 \tabularnewline
16 & 0.713514 & 0.572973 & 0.286486 \tabularnewline
17 & 0.673904 & 0.652193 & 0.326096 \tabularnewline
18 & 0.606625 & 0.786751 & 0.393375 \tabularnewline
19 & 0.770444 & 0.459112 & 0.229556 \tabularnewline
20 & 0.842843 & 0.314315 & 0.157157 \tabularnewline
21 & 0.790719 & 0.418561 & 0.209281 \tabularnewline
22 & 0.809954 & 0.380092 & 0.190046 \tabularnewline
23 & 0.770303 & 0.459394 & 0.229697 \tabularnewline
24 & 0.708231 & 0.583538 & 0.291769 \tabularnewline
25 & 0.655805 & 0.68839 & 0.344195 \tabularnewline
26 & 0.582127 & 0.835746 & 0.417873 \tabularnewline
27 & 0.731328 & 0.537345 & 0.268672 \tabularnewline
28 & 0.674478 & 0.651044 & 0.325522 \tabularnewline
29 & 0.665851 & 0.668299 & 0.334149 \tabularnewline
30 & 0.630069 & 0.739862 & 0.369931 \tabularnewline
31 & 0.558567 & 0.882866 & 0.441433 \tabularnewline
32 & 0.488826 & 0.977652 & 0.511174 \tabularnewline
33 & 0.423734 & 0.847469 & 0.576266 \tabularnewline
34 & 0.388763 & 0.777526 & 0.611237 \tabularnewline
35 & 0.316909 & 0.633818 & 0.683091 \tabularnewline
36 & 0.697062 & 0.605877 & 0.302938 \tabularnewline
37 & 0.638971 & 0.722057 & 0.361029 \tabularnewline
38 & 0.603149 & 0.793702 & 0.396851 \tabularnewline
39 & 0.531266 & 0.937469 & 0.468734 \tabularnewline
40 & 0.460617 & 0.921233 & 0.539383 \tabularnewline
41 & 0.39157 & 0.783139 & 0.60843 \tabularnewline
42 & 0.383838 & 0.767675 & 0.616162 \tabularnewline
43 & 0.355794 & 0.711587 & 0.644206 \tabularnewline
44 & 0.337048 & 0.674096 & 0.662952 \tabularnewline
45 & 0.26727 & 0.534541 & 0.73273 \tabularnewline
46 & 0.301952 & 0.603903 & 0.698048 \tabularnewline
47 & 0.287567 & 0.575133 & 0.712433 \tabularnewline
48 & 0.236131 & 0.472262 & 0.763869 \tabularnewline
49 & 0.384696 & 0.769392 & 0.615304 \tabularnewline
50 & 0.495516 & 0.991032 & 0.504484 \tabularnewline
51 & 0.592393 & 0.815213 & 0.407607 \tabularnewline
52 & 0.464966 & 0.929933 & 0.535034 \tabularnewline
53 & 0.344122 & 0.688245 & 0.655878 \tabularnewline
54 & 0.31854 & 0.637081 & 0.68146 \tabularnewline
\hline
\end{tabular}
%Source: https://freestatistics.org/blog/index.php?pk=267748&T=5

[TABLE]
[ROW][C]Goldfeld-Quandt test for Heteroskedasticity[/C][/ROW]
[ROW][C]p-values[/C][C]Alternative Hypothesis[/C][/ROW]
[ROW][C]breakpoint index[/C][C]greater[/C][C]2-sided[/C][C]less[/C][/ROW]
[ROW][C]6[/C][C]0.839587[/C][C]0.320826[/C][C]0.160413[/C][/ROW]
[ROW][C]7[/C][C]0.749994[/C][C]0.500011[/C][C]0.250006[/C][/ROW]
[ROW][C]8[/C][C]0.830475[/C][C]0.339049[/C][C]0.169525[/C][/ROW]
[ROW][C]9[/C][C]0.754157[/C][C]0.491686[/C][C]0.245843[/C][/ROW]
[ROW][C]10[/C][C]0.73798[/C][C]0.524041[/C][C]0.26202[/C][/ROW]
[ROW][C]11[/C][C]0.648785[/C][C]0.702431[/C][C]0.351215[/C][/ROW]
[ROW][C]12[/C][C]0.735977[/C][C]0.528045[/C][C]0.264023[/C][/ROW]
[ROW][C]13[/C][C]0.706489[/C][C]0.587021[/C][C]0.293511[/C][/ROW]
[ROW][C]14[/C][C]0.627242[/C][C]0.745516[/C][C]0.372758[/C][/ROW]
[ROW][C]15[/C][C]0.78182[/C][C]0.436359[/C][C]0.21818[/C][/ROW]
[ROW][C]16[/C][C]0.713514[/C][C]0.572973[/C][C]0.286486[/C][/ROW]
[ROW][C]17[/C][C]0.673904[/C][C]0.652193[/C][C]0.326096[/C][/ROW]
[ROW][C]18[/C][C]0.606625[/C][C]0.786751[/C][C]0.393375[/C][/ROW]
[ROW][C]19[/C][C]0.770444[/C][C]0.459112[/C][C]0.229556[/C][/ROW]
[ROW][C]20[/C][C]0.842843[/C][C]0.314315[/C][C]0.157157[/C][/ROW]
[ROW][C]21[/C][C]0.790719[/C][C]0.418561[/C][C]0.209281[/C][/ROW]
[ROW][C]22[/C][C]0.809954[/C][C]0.380092[/C][C]0.190046[/C][/ROW]
[ROW][C]23[/C][C]0.770303[/C][C]0.459394[/C][C]0.229697[/C][/ROW]
[ROW][C]24[/C][C]0.708231[/C][C]0.583538[/C][C]0.291769[/C][/ROW]
[ROW][C]25[/C][C]0.655805[/C][C]0.68839[/C][C]0.344195[/C][/ROW]
[ROW][C]26[/C][C]0.582127[/C][C]0.835746[/C][C]0.417873[/C][/ROW]
[ROW][C]27[/C][C]0.731328[/C][C]0.537345[/C][C]0.268672[/C][/ROW]
[ROW][C]28[/C][C]0.674478[/C][C]0.651044[/C][C]0.325522[/C][/ROW]
[ROW][C]29[/C][C]0.665851[/C][C]0.668299[/C][C]0.334149[/C][/ROW]
[ROW][C]30[/C][C]0.630069[/C][C]0.739862[/C][C]0.369931[/C][/ROW]
[ROW][C]31[/C][C]0.558567[/C][C]0.882866[/C][C]0.441433[/C][/ROW]
[ROW][C]32[/C][C]0.488826[/C][C]0.977652[/C][C]0.511174[/C][/ROW]
[ROW][C]33[/C][C]0.423734[/C][C]0.847469[/C][C]0.576266[/C][/ROW]
[ROW][C]34[/C][C]0.388763[/C][C]0.777526[/C][C]0.611237[/C][/ROW]
[ROW][C]35[/C][C]0.316909[/C][C]0.633818[/C][C]0.683091[/C][/ROW]
[ROW][C]36[/C][C]0.697062[/C][C]0.605877[/C][C]0.302938[/C][/ROW]
[ROW][C]37[/C][C]0.638971[/C][C]0.722057[/C][C]0.361029[/C][/ROW]
[ROW][C]38[/C][C]0.603149[/C][C]0.793702[/C][C]0.396851[/C][/ROW]
[ROW][C]39[/C][C]0.531266[/C][C]0.937469[/C][C]0.468734[/C][/ROW]
[ROW][C]40[/C][C]0.460617[/C][C]0.921233[/C][C]0.539383[/C][/ROW]
[ROW][C]41[/C][C]0.39157[/C][C]0.783139[/C][C]0.60843[/C][/ROW]
[ROW][C]42[/C][C]0.383838[/C][C]0.767675[/C][C]0.616162[/C][/ROW]
[ROW][C]43[/C][C]0.355794[/C][C]0.711587[/C][C]0.644206[/C][/ROW]
[ROW][C]44[/C][C]0.337048[/C][C]0.674096[/C][C]0.662952[/C][/ROW]
[ROW][C]45[/C][C]0.26727[/C][C]0.534541[/C][C]0.73273[/C][/ROW]
[ROW][C]46[/C][C]0.301952[/C][C]0.603903[/C][C]0.698048[/C][/ROW]
[ROW][C]47[/C][C]0.287567[/C][C]0.575133[/C][C]0.712433[/C][/ROW]
[ROW][C]48[/C][C]0.236131[/C][C]0.472262[/C][C]0.763869[/C][/ROW]
[ROW][C]49[/C][C]0.384696[/C][C]0.769392[/C][C]0.615304[/C][/ROW]
[ROW][C]50[/C][C]0.495516[/C][C]0.991032[/C][C]0.504484[/C][/ROW]
[ROW][C]51[/C][C]0.592393[/C][C]0.815213[/C][C]0.407607[/C][/ROW]
[ROW][C]52[/C][C]0.464966[/C][C]0.929933[/C][C]0.535034[/C][/ROW]
[ROW][C]53[/C][C]0.344122[/C][C]0.688245[/C][C]0.655878[/C][/ROW]
[ROW][C]54[/C][C]0.31854[/C][C]0.637081[/C][C]0.68146[/C][/ROW]
[/TABLE]
Source: https://freestatistics.org/blog/index.php?pk=267748&T=5

Globally Unique Identifier (entire table): ba.freestatistics.org/blog/index.php?pk=267748&T=5

As an alternative you can also use a QR Code:  

The GUIDs for individual cells are displayed in the table below:

Goldfeld-Quandt test for Heteroskedasticity
p-valuesAlternative Hypothesis
breakpoint indexgreater2-sidedless
60.8395870.3208260.160413
70.7499940.5000110.250006
80.8304750.3390490.169525
90.7541570.4916860.245843
100.737980.5240410.26202
110.6487850.7024310.351215
120.7359770.5280450.264023
130.7064890.5870210.293511
140.6272420.7455160.372758
150.781820.4363590.21818
160.7135140.5729730.286486
170.6739040.6521930.326096
180.6066250.7867510.393375
190.7704440.4591120.229556
200.8428430.3143150.157157
210.7907190.4185610.209281
220.8099540.3800920.190046
230.7703030.4593940.229697
240.7082310.5835380.291769
250.6558050.688390.344195
260.5821270.8357460.417873
270.7313280.5373450.268672
280.6744780.6510440.325522
290.6658510.6682990.334149
300.6300690.7398620.369931
310.5585670.8828660.441433
320.4888260.9776520.511174
330.4237340.8474690.576266
340.3887630.7775260.611237
350.3169090.6338180.683091
360.6970620.6058770.302938
370.6389710.7220570.361029
380.6031490.7937020.396851
390.5312660.9374690.468734
400.4606170.9212330.539383
410.391570.7831390.60843
420.3838380.7676750.616162
430.3557940.7115870.644206
440.3370480.6740960.662952
450.267270.5345410.73273
460.3019520.6039030.698048
470.2875670.5751330.712433
480.2361310.4722620.763869
490.3846960.7693920.615304
500.4955160.9910320.504484
510.5923930.8152130.407607
520.4649660.9299330.535034
530.3441220.6882450.655878
540.318540.6370810.68146


Meta Analysis of Goldfeld-Quandt test for Heteroskedasticity
Description# significant tests% significant testsOK/NOK
1% type I error level00OK
5% type I error level00OK
10% type I error level00OK

\begin{tabular}{lllllllll}
\hline
Meta Analysis of Goldfeld-Quandt test for Heteroskedasticity \tabularnewline
Description & # significant tests & % significant tests & OK/NOK \tabularnewline
1% type I error level & 0 & 0 & OK \tabularnewline
5% type I error level & 0 & 0 & OK \tabularnewline
10% type I error level & 0 & 0 & OK \tabularnewline
\hline
\end{tabular}
%Source: https://freestatistics.org/blog/index.php?pk=267748&T=6

[TABLE]
[ROW][C]Meta Analysis of Goldfeld-Quandt test for Heteroskedasticity[/C][/ROW]
[ROW][C]Description[/C][C]# significant tests[/C][C]% significant tests[/C][C]OK/NOK[/C][/ROW]
[ROW][C]1% type I error level[/C][C]0[/C][C]0[/C][C]OK[/C][/ROW]
[ROW][C]5% type I error level[/C][C]0[/C][C]0[/C][C]OK[/C][/ROW]
[ROW][C]10% type I error level[/C][C]0[/C][C]0[/C][C]OK[/C][/ROW]
[/TABLE]
Source: https://freestatistics.org/blog/index.php?pk=267748&T=6

Globally Unique Identifier (entire table): ba.freestatistics.org/blog/index.php?pk=267748&T=6

As an alternative you can also use a QR Code:  

The GUIDs for individual cells are displayed in the table below:

Meta Analysis of Goldfeld-Quandt test for Heteroskedasticity
Description# significant tests% significant testsOK/NOK
1% type I error level00OK
5% type I error level00OK
10% type I error level00OK


Parameters (Session):
par1 = two.sided ; par2 = 0.95 ; par3 = 20 ;
Parameters (R input):
par1 = 1 ; par2 = Do not include Seasonal Dummies ; par3 = No Linear Trend ;
R code (references can be found in the software module):
par3 <- 'No Linear Trend'
par2 <- 'Do not include Seasonal Dummies'
par1 <- '1'
library(lattice)
library(lmtest)
n25 <- 25 #minimum number of obs. for Goldfeld-Quandt test
par1 <- as.numeric(par1)
x <- t(y)
k <- length(x[1,])
n <- length(x[,1])
x1 <- cbind(x[,par1], x[,1:k!=par1])
mycolnames <- c(colnames(x)[par1], colnames(x)[1:k!=par1])
colnames(x1) <- mycolnames #colnames(x)[par1]
x <- x1
if (par3 == 'First Differences'){
x2 <- array(0, dim=c(n-1,k), dimnames=list(1:(n-1), paste('(1-B)',colnames(x),sep='')))
for (i in 1:n-1) {
for (j in 1:k) {
x2[i,j] <- x[i+1,j] - x[i,j]
}
}
x <- x2
}
if (par2 == 'Include Monthly Dummies'){
x2 <- array(0, dim=c(n,11), dimnames=list(1:n, paste('M', seq(1:11), sep ='')))
for (i in 1:11){
x2[seq(i,n,12),i] <- 1
}
x <- cbind(x, x2)
}
if (par2 == 'Include Quarterly Dummies'){
x2 <- array(0, dim=c(n,3), dimnames=list(1:n, paste('Q', seq(1:3), sep ='')))
for (i in 1:3){
x2[seq(i,n,4),i] <- 1
}
x <- cbind(x, x2)
}
k <- length(x[1,])
if (par3 == 'Linear Trend'){
x <- cbind(x, c(1:n))
colnames(x)[k+1] <- 't'
}
x
k <- length(x[1,])
df <- as.data.frame(x)
(mylm <- lm(df))
(mysum <- summary(mylm))
if (n > n25) {
kp3 <- k + 3
nmkm3 <- n - k - 3
gqarr <- array(NA, dim=c(nmkm3-kp3+1,3))
numgqtests <- 0
numsignificant1 <- 0
numsignificant5 <- 0
numsignificant10 <- 0
for (mypoint in kp3:nmkm3) {
j <- 0
numgqtests <- numgqtests + 1
for (myalt in c('greater', 'two.sided', 'less')) {
j <- j + 1
gqarr[mypoint-kp3+1,j] <- gqtest(mylm, point=mypoint, alternative=myalt)$p.value
}
if (gqarr[mypoint-kp3+1,2] < 0.01) numsignificant1 <- numsignificant1 + 1
if (gqarr[mypoint-kp3+1,2] < 0.05) numsignificant5 <- numsignificant5 + 1
if (gqarr[mypoint-kp3+1,2] < 0.10) numsignificant10 <- numsignificant10 + 1
}
gqarr
}
bitmap(file='test0.png')
plot(x[,1], type='l', main='Actuals and Interpolation', ylab='value of Actuals and Interpolation (dots)', xlab='time or index')
points(x[,1]-mysum$resid)
grid()
dev.off()
bitmap(file='test1.png')
plot(mysum$resid, type='b', pch=19, main='Residuals', ylab='value of Residuals', xlab='time or index')
grid()
dev.off()
bitmap(file='test2.png')
hist(mysum$resid, main='Residual Histogram', xlab='values of Residuals')
grid()
dev.off()
bitmap(file='test3.png')
densityplot(~mysum$resid,col='black',main='Residual Density Plot', xlab='values of Residuals')
dev.off()
bitmap(file='test4.png')
qqnorm(mysum$resid, main='Residual Normal Q-Q Plot')
qqline(mysum$resid)
grid()
dev.off()
(myerror <- as.ts(mysum$resid))
bitmap(file='test5.png')
dum <- cbind(lag(myerror,k=1),myerror)
dum
dum1 <- dum[2:length(myerror),]
dum1
z <- as.data.frame(dum1)
z
plot(z,main=paste('Residual Lag plot, lowess, and regression line'), ylab='values of Residuals', xlab='lagged values of Residuals')
lines(lowess(z))
abline(lm(z))
grid()
dev.off()
bitmap(file='test6.png')
acf(mysum$resid, lag.max=length(mysum$resid)/2, main='Residual Autocorrelation Function')
grid()
dev.off()
bitmap(file='test7.png')
pacf(mysum$resid, lag.max=length(mysum$resid)/2, main='Residual Partial Autocorrelation Function')
grid()
dev.off()
bitmap(file='test8.png')
opar <- par(mfrow = c(2,2), oma = c(0, 0, 1.1, 0))
plot(mylm, las = 1, sub='Residual Diagnostics')
par(opar)
dev.off()
if (n > n25) {
bitmap(file='test9.png')
plot(kp3:nmkm3,gqarr[,2], main='Goldfeld-Quandt test',ylab='2-sided p-value',xlab='breakpoint')
grid()
dev.off()
}
load(file='createtable')
a<-table.start()
a<-table.row.start(a)
a<-table.element(a, 'Multiple Linear Regression - Estimated Regression Equation', 1, TRUE)
a<-table.row.end(a)
myeq <- colnames(x)[1]
myeq <- paste(myeq, '[t] = ', sep='')
for (i in 1:k){
if (mysum$coefficients[i,1] > 0) myeq <- paste(myeq, '+', '')
myeq <- paste(myeq, signif(mysum$coefficients[i,1],6), sep=' ')
if (rownames(mysum$coefficients)[i] != '(Intercept)') {
myeq <- paste(myeq, rownames(mysum$coefficients)[i], sep='')
if (rownames(mysum$coefficients)[i] != 't') myeq <- paste(myeq, '[t]', sep='')
}
}
myeq <- paste(myeq, ' + e[t]')
a<-table.row.start(a)
a<-table.element(a, myeq)
a<-table.row.end(a)
a<-table.end(a)
table.save(a,file='mytable1.tab')
a<-table.start()
a<-table.row.start(a)
a<-table.element(a,hyperlink('ols1.htm','Multiple Linear Regression - Ordinary Least Squares',''), 6, TRUE)
a<-table.row.end(a)
a<-table.row.start(a)
a<-table.element(a,'Variable',header=TRUE)
a<-table.element(a,'Parameter',header=TRUE)
a<-table.element(a,'S.D.',header=TRUE)
a<-table.element(a,'T-STAT
H0: parameter = 0',header=TRUE)
a<-table.element(a,'2-tail p-value',header=TRUE)
a<-table.element(a,'1-tail p-value',header=TRUE)
a<-table.row.end(a)
for (i in 1:k){
a<-table.row.start(a)
a<-table.element(a,rownames(mysum$coefficients)[i],header=TRUE)
a<-table.element(a,signif(mysum$coefficients[i,1],6))
a<-table.element(a, signif(mysum$coefficients[i,2],6))
a<-table.element(a, signif(mysum$coefficients[i,3],4))
a<-table.element(a, signif(mysum$coefficients[i,4],6))
a<-table.element(a, signif(mysum$coefficients[i,4]/2,6))
a<-table.row.end(a)
}
a<-table.end(a)
table.save(a,file='mytable2.tab')
a<-table.start()
a<-table.row.start(a)
a<-table.element(a, 'Multiple Linear Regression - Regression Statistics', 2, TRUE)
a<-table.row.end(a)
a<-table.row.start(a)
a<-table.element(a, 'Multiple R',1,TRUE)
a<-table.element(a, signif(sqrt(mysum$r.squared),6))
a<-table.row.end(a)
a<-table.row.start(a)
a<-table.element(a, 'R-squared',1,TRUE)
a<-table.element(a, signif(mysum$r.squared,6))
a<-table.row.end(a)
a<-table.row.start(a)
a<-table.element(a, 'Adjusted R-squared',1,TRUE)
a<-table.element(a, signif(mysum$adj.r.squared,6))
a<-table.row.end(a)
a<-table.row.start(a)
a<-table.element(a, 'F-TEST (value)',1,TRUE)
a<-table.element(a, signif(mysum$fstatistic[1],6))
a<-table.row.end(a)
a<-table.row.start(a)
a<-table.element(a, 'F-TEST (DF numerator)',1,TRUE)
a<-table.element(a, signif(mysum$fstatistic[2],6))
a<-table.row.end(a)
a<-table.row.start(a)
a<-table.element(a, 'F-TEST (DF denominator)',1,TRUE)
a<-table.element(a, signif(mysum$fstatistic[3],6))
a<-table.row.end(a)
a<-table.row.start(a)
a<-table.element(a, 'p-value',1,TRUE)
a<-table.element(a, signif(1-pf(mysum$fstatistic[1],mysum$fstatistic[2],mysum$fstatistic[3]),6))
a<-table.row.end(a)
a<-table.row.start(a)
a<-table.element(a, 'Multiple Linear Regression - Residual Statistics', 2, TRUE)
a<-table.row.end(a)
a<-table.row.start(a)
a<-table.element(a, 'Residual Standard Deviation',1,TRUE)
a<-table.element(a, signif(mysum$sigma,6))
a<-table.row.end(a)
a<-table.row.start(a)
a<-table.element(a, 'Sum Squared Residuals',1,TRUE)
a<-table.element(a, signif(sum(myerror*myerror),6))
a<-table.row.end(a)
a<-table.end(a)
table.save(a,file='mytable3.tab')
a<-table.start()
a<-table.row.start(a)
a<-table.element(a, 'Multiple Linear Regression - Actuals, Interpolation, and Residuals', 4, TRUE)
a<-table.row.end(a)
a<-table.row.start(a)
a<-table.element(a, 'Time or Index', 1, TRUE)
a<-table.element(a, 'Actuals', 1, TRUE)
a<-table.element(a, 'Interpolation
Forecast', 1, TRUE)
a<-table.element(a, 'Residuals
Prediction Error', 1, TRUE)
a<-table.row.end(a)
for (i in 1:n) {
a<-table.row.start(a)
a<-table.element(a,i, 1, TRUE)
a<-table.element(a,signif(x[i],6))
a<-table.element(a,signif(x[i]-mysum$resid[i],6))
a<-table.element(a,signif(mysum$resid[i],6))
a<-table.row.end(a)
}
a<-table.end(a)
table.save(a,file='mytable4.tab')
if (n > n25) {
a<-table.start()
a<-table.row.start(a)
a<-table.element(a,'Goldfeld-Quandt test for Heteroskedasticity',4,TRUE)
a<-table.row.end(a)
a<-table.row.start(a)
a<-table.element(a,'p-values',header=TRUE)
a<-table.element(a,'Alternative Hypothesis',3,header=TRUE)
a<-table.row.end(a)
a<-table.row.start(a)
a<-table.element(a,'breakpoint index',header=TRUE)
a<-table.element(a,'greater',header=TRUE)
a<-table.element(a,'2-sided',header=TRUE)
a<-table.element(a,'less',header=TRUE)
a<-table.row.end(a)
for (mypoint in kp3:nmkm3) {
a<-table.row.start(a)
a<-table.element(a,mypoint,header=TRUE)
a<-table.element(a,signif(gqarr[mypoint-kp3+1,1],6))
a<-table.element(a,signif(gqarr[mypoint-kp3+1,2],6))
a<-table.element(a,signif(gqarr[mypoint-kp3+1,3],6))
a<-table.row.end(a)
}
a<-table.end(a)
table.save(a,file='mytable5.tab')
a<-table.start()
a<-table.row.start(a)
a<-table.element(a,'Meta Analysis of Goldfeld-Quandt test for Heteroskedasticity',4,TRUE)
a<-table.row.end(a)
a<-table.row.start(a)
a<-table.element(a,'Description',header=TRUE)
a<-table.element(a,'# significant tests',header=TRUE)
a<-table.element(a,'% significant tests',header=TRUE)
a<-table.element(a,'OK/NOK',header=TRUE)
a<-table.row.end(a)
a<-table.row.start(a)
a<-table.element(a,'1% type I error level',header=TRUE)
a<-table.element(a,signif(numsignificant1,6))
a<-table.element(a,signif(numsignificant1/numgqtests,6))
if (numsignificant1/numgqtests < 0.01) dum <- 'OK' else dum <- 'NOK'
a<-table.element(a,dum)
a<-table.row.end(a)
a<-table.row.start(a)
a<-table.element(a,'5% type I error level',header=TRUE)
a<-table.element(a,signif(numsignificant5,6))
a<-table.element(a,signif(numsignificant5/numgqtests,6))
if (numsignificant5/numgqtests < 0.05) dum <- 'OK' else dum <- 'NOK'
a<-table.element(a,dum)
a<-table.row.end(a)
a<-table.row.start(a)
a<-table.element(a,'10% type I error level',header=TRUE)
a<-table.element(a,signif(numsignificant10,6))
a<-table.element(a,signif(numsignificant10/numgqtests,6))
if (numsignificant10/numgqtests < 0.1) dum <- 'OK' else dum <- 'NOK'
a<-table.element(a,dum)
a<-table.row.end(a)
a<-table.end(a)
table.save(a,file='mytable6.tab')
}