Free Statistics

of Irreproducible Research!

Author's title

Author*Unverified author*
R Software Modulerwasp_exponentialsmoothing.wasp
Title produced by softwareExponential Smoothing
Date of computationSun, 14 Dec 2014 19:35:40 +0000
Cite this page as followsStatistical Computations at FreeStatistics.org, Office for Research Development and Education, URL https://freestatistics.org/blog/index.php?v=date/2014/Dec/14/t1418585770x2bfa6m4mcmap9l.htm/, Retrieved Thu, 16 May 2024 13:44:31 +0000
Statistical Computations at FreeStatistics.org, Office for Research Development and Education, URL https://freestatistics.org/blog/index.php?pk=267832, Retrieved Thu, 16 May 2024 13:44:31 +0000
QR Codes:

Original text written by user:
IsPrivate?No (this computation is public)
User-defined keywords
Estimated Impact62
Family? (F = Feedback message, R = changed R code, M = changed R Module, P = changed Parameters, D = changed Data)
-       [Exponential Smoothing] [] [2014-12-14 19:35:40] [2f27692a17e58baa8638275162e45e6c] [Current]
Feedback Forum

Post a new message
Dataseries X:
105
101
95
93
84
87
116
120
117
109
105
107
109
109
108
107
99
103
131
137
135
124
118
121
121
118
113
107
100
102
130
136
133
120
112
109
110
106
102
98
92
92
120
127
124
114
108
106
111
110
104
100
96
98
122
134
133
125
118
116
118
116
111
108
102
102
129
136
137
126
119
117


Summary of computational transaction
Raw Inputview raw input (R code)
Raw Outputview raw output of R engine
Computing time1 seconds
R Server'Herman Ole Andreas Wold' @ wold.wessa.net

\begin{tabular}{lllllllll}
\hline
Summary of computational transaction \tabularnewline
Raw Input & view raw input (R code)  \tabularnewline
Raw Output & view raw output of R engine  \tabularnewline
Computing time & 1 seconds \tabularnewline
R Server & 'Herman Ole Andreas Wold' @ wold.wessa.net \tabularnewline
\hline
\end{tabular}
%Source: https://freestatistics.org/blog/index.php?pk=267832&T=0

[TABLE]
[ROW][C]Summary of computational transaction[/C][/ROW]
[ROW][C]Raw Input[/C][C]view raw input (R code) [/C][/ROW]
[ROW][C]Raw Output[/C][C]view raw output of R engine [/C][/ROW]
[ROW][C]Computing time[/C][C]1 seconds[/C][/ROW]
[ROW][C]R Server[/C][C]'Herman Ole Andreas Wold' @ wold.wessa.net[/C][/ROW]
[/TABLE]
Source: https://freestatistics.org/blog/index.php?pk=267832&T=0

Globally Unique Identifier (entire table): ba.freestatistics.org/blog/index.php?pk=267832&T=0

As an alternative you can also use a QR Code:  

The GUIDs for individual cells are displayed in the table below:

Summary of computational transaction
Raw Inputview raw input (R code)
Raw Outputview raw output of R engine
Computing time1 seconds
R Server'Herman Ole Andreas Wold' @ wold.wessa.net


Estimated Parameters of Exponential Smoothing
ParameterValue
alpha0.85619839511646
beta0.0438550053733445
gamma1

\begin{tabular}{lllllllll}
\hline
Estimated Parameters of Exponential Smoothing \tabularnewline
Parameter & Value \tabularnewline
alpha & 0.85619839511646 \tabularnewline
beta & 0.0438550053733445 \tabularnewline
gamma & 1 \tabularnewline
\hline
\end{tabular}
%Source: https://freestatistics.org/blog/index.php?pk=267832&T=1

[TABLE]
[ROW][C]Estimated Parameters of Exponential Smoothing[/C][/ROW]
[ROW][C]Parameter[/C][C]Value[/C][/ROW]
[ROW][C]alpha[/C][C]0.85619839511646[/C][/ROW]
[ROW][C]beta[/C][C]0.0438550053733445[/C][/ROW]
[ROW][C]gamma[/C][C]1[/C][/ROW]
[/TABLE]
Source: https://freestatistics.org/blog/index.php?pk=267832&T=1

Globally Unique Identifier (entire table): ba.freestatistics.org/blog/index.php?pk=267832&T=1

As an alternative you can also use a QR Code:  

The GUIDs for individual cells are displayed in the table below:

Estimated Parameters of Exponential Smoothing
ParameterValue
alpha0.85619839511646
beta0.0438550053733445
gamma1


Interpolation Forecasts of Exponential Smoothing
tObservedFittedResiduals
13109101.8401364774487.15986352255152
14109108.1394335768260.86056642317385
15108107.9437964187010.0562035812991013
16107107.13590395958-0.135903959579935
179999.3242206340973-0.324220634097344
18103103.388050491132-0.388050491132276
19131132.045553392469-1.04555339246872
20137136.7025347122890.297465287711077
21135134.0558937518560.944106248144124
22124125.850316849834-1.85031684983423
23118119.758184603352-1.75818460335199
24121120.4153595955310.584640404468615
25121124.276606159143-3.27660615914257
26118120.255479303948-2.25547930394836
27113116.726315836993-3.72631583699271
28107112.066603446598-5.06660344659849
2910099.34772403779740.652275962202594
30102103.68857392654-1.68857392654047
31130130.145483048849-0.14548304884903
32136134.9546580078781.04534199212233
33133132.349269342990.650730657009774
34120122.977587909597-2.97758790959652
35112115.412442768721-3.41244276872121
36109114.178664353617-5.17866435361688
37110111.422997811919-1.42299781191917
38106108.438285125522-2.43828512552159
39102103.934265292008-1.93426529200774
4098100.04147679263-2.04147679262957
419290.77580322658321.22419677341681
429294.4199752081202-2.41997520812023
43120117.0652330986262.93476690137409
44127123.6085321072433.39146789275691
45124122.6392353558671.36076464413327
46114113.5775095450470.42249045495322
47108108.739300125435-0.739300125434511
48106109.177489907765-3.17748990776504
49111108.3963706243772.6036293756235
50110108.6120651501441.38793484985564
51104107.41957615571-3.41957615570959
52100102.179582525359-2.17958252535946
539693.09388655775692.90611344224311
549897.78490816213520.215091837864819
55122125.30392823619-3.30392823619026
56134126.6121219488017.38787805119885
57133128.6790686719114.32093132808862
58125121.5038230674713.49617693252911
59118118.914418450801-0.914418450801094
60116119.182506167646-3.18250616764554
61118119.785775571063-1.78577557106323
62116116.046514522413-0.0465145224131618
63111112.819495479071-1.81949547907078
64108109.100756393432-1.10075639343228
65102101.2907094152380.709290584761689
66102103.90024342987-1.90024342987033
67129130.258679793195-1.258679793195
68136135.2173554023570.782644597642957
69137130.9438650113466.05613498865432
70126124.7701873817671.2298126182325
71119119.401435542093-0.401435542092642
72117119.63336353154-2.63336353154004

\begin{tabular}{lllllllll}
\hline
Interpolation Forecasts of Exponential Smoothing \tabularnewline
t & Observed & Fitted & Residuals \tabularnewline
13 & 109 & 101.840136477448 & 7.15986352255152 \tabularnewline
14 & 109 & 108.139433576826 & 0.86056642317385 \tabularnewline
15 & 108 & 107.943796418701 & 0.0562035812991013 \tabularnewline
16 & 107 & 107.13590395958 & -0.135903959579935 \tabularnewline
17 & 99 & 99.3242206340973 & -0.324220634097344 \tabularnewline
18 & 103 & 103.388050491132 & -0.388050491132276 \tabularnewline
19 & 131 & 132.045553392469 & -1.04555339246872 \tabularnewline
20 & 137 & 136.702534712289 & 0.297465287711077 \tabularnewline
21 & 135 & 134.055893751856 & 0.944106248144124 \tabularnewline
22 & 124 & 125.850316849834 & -1.85031684983423 \tabularnewline
23 & 118 & 119.758184603352 & -1.75818460335199 \tabularnewline
24 & 121 & 120.415359595531 & 0.584640404468615 \tabularnewline
25 & 121 & 124.276606159143 & -3.27660615914257 \tabularnewline
26 & 118 & 120.255479303948 & -2.25547930394836 \tabularnewline
27 & 113 & 116.726315836993 & -3.72631583699271 \tabularnewline
28 & 107 & 112.066603446598 & -5.06660344659849 \tabularnewline
29 & 100 & 99.3477240377974 & 0.652275962202594 \tabularnewline
30 & 102 & 103.68857392654 & -1.68857392654047 \tabularnewline
31 & 130 & 130.145483048849 & -0.14548304884903 \tabularnewline
32 & 136 & 134.954658007878 & 1.04534199212233 \tabularnewline
33 & 133 & 132.34926934299 & 0.650730657009774 \tabularnewline
34 & 120 & 122.977587909597 & -2.97758790959652 \tabularnewline
35 & 112 & 115.412442768721 & -3.41244276872121 \tabularnewline
36 & 109 & 114.178664353617 & -5.17866435361688 \tabularnewline
37 & 110 & 111.422997811919 & -1.42299781191917 \tabularnewline
38 & 106 & 108.438285125522 & -2.43828512552159 \tabularnewline
39 & 102 & 103.934265292008 & -1.93426529200774 \tabularnewline
40 & 98 & 100.04147679263 & -2.04147679262957 \tabularnewline
41 & 92 & 90.7758032265832 & 1.22419677341681 \tabularnewline
42 & 92 & 94.4199752081202 & -2.41997520812023 \tabularnewline
43 & 120 & 117.065233098626 & 2.93476690137409 \tabularnewline
44 & 127 & 123.608532107243 & 3.39146789275691 \tabularnewline
45 & 124 & 122.639235355867 & 1.36076464413327 \tabularnewline
46 & 114 & 113.577509545047 & 0.42249045495322 \tabularnewline
47 & 108 & 108.739300125435 & -0.739300125434511 \tabularnewline
48 & 106 & 109.177489907765 & -3.17748990776504 \tabularnewline
49 & 111 & 108.396370624377 & 2.6036293756235 \tabularnewline
50 & 110 & 108.612065150144 & 1.38793484985564 \tabularnewline
51 & 104 & 107.41957615571 & -3.41957615570959 \tabularnewline
52 & 100 & 102.179582525359 & -2.17958252535946 \tabularnewline
53 & 96 & 93.0938865577569 & 2.90611344224311 \tabularnewline
54 & 98 & 97.7849081621352 & 0.215091837864819 \tabularnewline
55 & 122 & 125.30392823619 & -3.30392823619026 \tabularnewline
56 & 134 & 126.612121948801 & 7.38787805119885 \tabularnewline
57 & 133 & 128.679068671911 & 4.32093132808862 \tabularnewline
58 & 125 & 121.503823067471 & 3.49617693252911 \tabularnewline
59 & 118 & 118.914418450801 & -0.914418450801094 \tabularnewline
60 & 116 & 119.182506167646 & -3.18250616764554 \tabularnewline
61 & 118 & 119.785775571063 & -1.78577557106323 \tabularnewline
62 & 116 & 116.046514522413 & -0.0465145224131618 \tabularnewline
63 & 111 & 112.819495479071 & -1.81949547907078 \tabularnewline
64 & 108 & 109.100756393432 & -1.10075639343228 \tabularnewline
65 & 102 & 101.290709415238 & 0.709290584761689 \tabularnewline
66 & 102 & 103.90024342987 & -1.90024342987033 \tabularnewline
67 & 129 & 130.258679793195 & -1.258679793195 \tabularnewline
68 & 136 & 135.217355402357 & 0.782644597642957 \tabularnewline
69 & 137 & 130.943865011346 & 6.05613498865432 \tabularnewline
70 & 126 & 124.770187381767 & 1.2298126182325 \tabularnewline
71 & 119 & 119.401435542093 & -0.401435542092642 \tabularnewline
72 & 117 & 119.63336353154 & -2.63336353154004 \tabularnewline
\hline
\end{tabular}
%Source: https://freestatistics.org/blog/index.php?pk=267832&T=2

[TABLE]
[ROW][C]Interpolation Forecasts of Exponential Smoothing[/C][/ROW]
[ROW][C]t[/C][C]Observed[/C][C]Fitted[/C][C]Residuals[/C][/ROW]
[ROW][C]13[/C][C]109[/C][C]101.840136477448[/C][C]7.15986352255152[/C][/ROW]
[ROW][C]14[/C][C]109[/C][C]108.139433576826[/C][C]0.86056642317385[/C][/ROW]
[ROW][C]15[/C][C]108[/C][C]107.943796418701[/C][C]0.0562035812991013[/C][/ROW]
[ROW][C]16[/C][C]107[/C][C]107.13590395958[/C][C]-0.135903959579935[/C][/ROW]
[ROW][C]17[/C][C]99[/C][C]99.3242206340973[/C][C]-0.324220634097344[/C][/ROW]
[ROW][C]18[/C][C]103[/C][C]103.388050491132[/C][C]-0.388050491132276[/C][/ROW]
[ROW][C]19[/C][C]131[/C][C]132.045553392469[/C][C]-1.04555339246872[/C][/ROW]
[ROW][C]20[/C][C]137[/C][C]136.702534712289[/C][C]0.297465287711077[/C][/ROW]
[ROW][C]21[/C][C]135[/C][C]134.055893751856[/C][C]0.944106248144124[/C][/ROW]
[ROW][C]22[/C][C]124[/C][C]125.850316849834[/C][C]-1.85031684983423[/C][/ROW]
[ROW][C]23[/C][C]118[/C][C]119.758184603352[/C][C]-1.75818460335199[/C][/ROW]
[ROW][C]24[/C][C]121[/C][C]120.415359595531[/C][C]0.584640404468615[/C][/ROW]
[ROW][C]25[/C][C]121[/C][C]124.276606159143[/C][C]-3.27660615914257[/C][/ROW]
[ROW][C]26[/C][C]118[/C][C]120.255479303948[/C][C]-2.25547930394836[/C][/ROW]
[ROW][C]27[/C][C]113[/C][C]116.726315836993[/C][C]-3.72631583699271[/C][/ROW]
[ROW][C]28[/C][C]107[/C][C]112.066603446598[/C][C]-5.06660344659849[/C][/ROW]
[ROW][C]29[/C][C]100[/C][C]99.3477240377974[/C][C]0.652275962202594[/C][/ROW]
[ROW][C]30[/C][C]102[/C][C]103.68857392654[/C][C]-1.68857392654047[/C][/ROW]
[ROW][C]31[/C][C]130[/C][C]130.145483048849[/C][C]-0.14548304884903[/C][/ROW]
[ROW][C]32[/C][C]136[/C][C]134.954658007878[/C][C]1.04534199212233[/C][/ROW]
[ROW][C]33[/C][C]133[/C][C]132.34926934299[/C][C]0.650730657009774[/C][/ROW]
[ROW][C]34[/C][C]120[/C][C]122.977587909597[/C][C]-2.97758790959652[/C][/ROW]
[ROW][C]35[/C][C]112[/C][C]115.412442768721[/C][C]-3.41244276872121[/C][/ROW]
[ROW][C]36[/C][C]109[/C][C]114.178664353617[/C][C]-5.17866435361688[/C][/ROW]
[ROW][C]37[/C][C]110[/C][C]111.422997811919[/C][C]-1.42299781191917[/C][/ROW]
[ROW][C]38[/C][C]106[/C][C]108.438285125522[/C][C]-2.43828512552159[/C][/ROW]
[ROW][C]39[/C][C]102[/C][C]103.934265292008[/C][C]-1.93426529200774[/C][/ROW]
[ROW][C]40[/C][C]98[/C][C]100.04147679263[/C][C]-2.04147679262957[/C][/ROW]
[ROW][C]41[/C][C]92[/C][C]90.7758032265832[/C][C]1.22419677341681[/C][/ROW]
[ROW][C]42[/C][C]92[/C][C]94.4199752081202[/C][C]-2.41997520812023[/C][/ROW]
[ROW][C]43[/C][C]120[/C][C]117.065233098626[/C][C]2.93476690137409[/C][/ROW]
[ROW][C]44[/C][C]127[/C][C]123.608532107243[/C][C]3.39146789275691[/C][/ROW]
[ROW][C]45[/C][C]124[/C][C]122.639235355867[/C][C]1.36076464413327[/C][/ROW]
[ROW][C]46[/C][C]114[/C][C]113.577509545047[/C][C]0.42249045495322[/C][/ROW]
[ROW][C]47[/C][C]108[/C][C]108.739300125435[/C][C]-0.739300125434511[/C][/ROW]
[ROW][C]48[/C][C]106[/C][C]109.177489907765[/C][C]-3.17748990776504[/C][/ROW]
[ROW][C]49[/C][C]111[/C][C]108.396370624377[/C][C]2.6036293756235[/C][/ROW]
[ROW][C]50[/C][C]110[/C][C]108.612065150144[/C][C]1.38793484985564[/C][/ROW]
[ROW][C]51[/C][C]104[/C][C]107.41957615571[/C][C]-3.41957615570959[/C][/ROW]
[ROW][C]52[/C][C]100[/C][C]102.179582525359[/C][C]-2.17958252535946[/C][/ROW]
[ROW][C]53[/C][C]96[/C][C]93.0938865577569[/C][C]2.90611344224311[/C][/ROW]
[ROW][C]54[/C][C]98[/C][C]97.7849081621352[/C][C]0.215091837864819[/C][/ROW]
[ROW][C]55[/C][C]122[/C][C]125.30392823619[/C][C]-3.30392823619026[/C][/ROW]
[ROW][C]56[/C][C]134[/C][C]126.612121948801[/C][C]7.38787805119885[/C][/ROW]
[ROW][C]57[/C][C]133[/C][C]128.679068671911[/C][C]4.32093132808862[/C][/ROW]
[ROW][C]58[/C][C]125[/C][C]121.503823067471[/C][C]3.49617693252911[/C][/ROW]
[ROW][C]59[/C][C]118[/C][C]118.914418450801[/C][C]-0.914418450801094[/C][/ROW]
[ROW][C]60[/C][C]116[/C][C]119.182506167646[/C][C]-3.18250616764554[/C][/ROW]
[ROW][C]61[/C][C]118[/C][C]119.785775571063[/C][C]-1.78577557106323[/C][/ROW]
[ROW][C]62[/C][C]116[/C][C]116.046514522413[/C][C]-0.0465145224131618[/C][/ROW]
[ROW][C]63[/C][C]111[/C][C]112.819495479071[/C][C]-1.81949547907078[/C][/ROW]
[ROW][C]64[/C][C]108[/C][C]109.100756393432[/C][C]-1.10075639343228[/C][/ROW]
[ROW][C]65[/C][C]102[/C][C]101.290709415238[/C][C]0.709290584761689[/C][/ROW]
[ROW][C]66[/C][C]102[/C][C]103.90024342987[/C][C]-1.90024342987033[/C][/ROW]
[ROW][C]67[/C][C]129[/C][C]130.258679793195[/C][C]-1.258679793195[/C][/ROW]
[ROW][C]68[/C][C]136[/C][C]135.217355402357[/C][C]0.782644597642957[/C][/ROW]
[ROW][C]69[/C][C]137[/C][C]130.943865011346[/C][C]6.05613498865432[/C][/ROW]
[ROW][C]70[/C][C]126[/C][C]124.770187381767[/C][C]1.2298126182325[/C][/ROW]
[ROW][C]71[/C][C]119[/C][C]119.401435542093[/C][C]-0.401435542092642[/C][/ROW]
[ROW][C]72[/C][C]117[/C][C]119.63336353154[/C][C]-2.63336353154004[/C][/ROW]
[/TABLE]
Source: https://freestatistics.org/blog/index.php?pk=267832&T=2

Globally Unique Identifier (entire table): ba.freestatistics.org/blog/index.php?pk=267832&T=2

As an alternative you can also use a QR Code:  

The GUIDs for individual cells are displayed in the table below:

Interpolation Forecasts of Exponential Smoothing
tObservedFittedResiduals
13109101.8401364774487.15986352255152
14109108.1394335768260.86056642317385
15108107.9437964187010.0562035812991013
16107107.13590395958-0.135903959579935
179999.3242206340973-0.324220634097344
18103103.388050491132-0.388050491132276
19131132.045553392469-1.04555339246872
20137136.7025347122890.297465287711077
21135134.0558937518560.944106248144124
22124125.850316849834-1.85031684983423
23118119.758184603352-1.75818460335199
24121120.4153595955310.584640404468615
25121124.276606159143-3.27660615914257
26118120.255479303948-2.25547930394836
27113116.726315836993-3.72631583699271
28107112.066603446598-5.06660344659849
2910099.34772403779740.652275962202594
30102103.68857392654-1.68857392654047
31130130.145483048849-0.14548304884903
32136134.9546580078781.04534199212233
33133132.349269342990.650730657009774
34120122.977587909597-2.97758790959652
35112115.412442768721-3.41244276872121
36109114.178664353617-5.17866435361688
37110111.422997811919-1.42299781191917
38106108.438285125522-2.43828512552159
39102103.934265292008-1.93426529200774
4098100.04147679263-2.04147679262957
419290.77580322658321.22419677341681
429294.4199752081202-2.41997520812023
43120117.0652330986262.93476690137409
44127123.6085321072433.39146789275691
45124122.6392353558671.36076464413327
46114113.5775095450470.42249045495322
47108108.739300125435-0.739300125434511
48106109.177489907765-3.17748990776504
49111108.3963706243772.6036293756235
50110108.6120651501441.38793484985564
51104107.41957615571-3.41957615570959
52100102.179582525359-2.17958252535946
539693.09388655775692.90611344224311
549897.78490816213520.215091837864819
55122125.30392823619-3.30392823619026
56134126.6121219488017.38787805119885
57133128.6790686719114.32093132808862
58125121.5038230674713.49617693252911
59118118.914418450801-0.914418450801094
60116119.182506167646-3.18250616764554
61118119.785775571063-1.78577557106323
62116116.046514522413-0.0465145224131618
63111112.819495479071-1.81949547907078
64108109.100756393432-1.10075639343228
65102101.2907094152380.709290584761689
66102103.90024342987-1.90024342987033
67129130.258679793195-1.258679793195
68136135.2173554023570.782644597642957
69137130.9438650113466.05613498865432
70126124.7701873817671.2298126182325
71119119.401435542093-0.401435542092642
72117119.63336353154-2.63336353154004


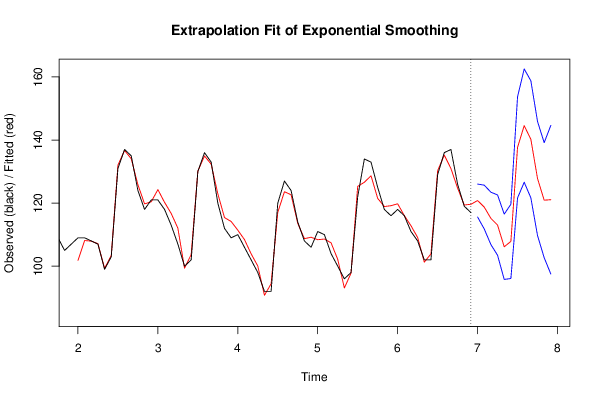
Extrapolation Forecasts of Exponential Smoothing
tForecast95% Lower Bound95% Upper Bound
73120.817909828413115.593229623769126.042590033058
74118.74673472777111.801287020649125.692182434891
75115.159064458216106.855530293337123.462598623095
76113.028065606617103.466334600538122.589796612697
77106.15509419056295.7968435741559116.513344806969
78107.86032326666696.0951640711867119.625482462144
79137.660380272208121.634018301977153.686742242438
80144.580730180396126.62136823562162.540092125172
81140.227432134359121.660005786904158.794858481814
82127.804414108979109.725269675016145.883558542942
83120.932341849318102.69443679971139.170246898925
84121.07808807176197.5027886313403144.653387512182

\begin{tabular}{lllllllll}
\hline
Extrapolation Forecasts of Exponential Smoothing \tabularnewline
t & Forecast & 95% Lower Bound & 95% Upper Bound \tabularnewline
73 & 120.817909828413 & 115.593229623769 & 126.042590033058 \tabularnewline
74 & 118.74673472777 & 111.801287020649 & 125.692182434891 \tabularnewline
75 & 115.159064458216 & 106.855530293337 & 123.462598623095 \tabularnewline
76 & 113.028065606617 & 103.466334600538 & 122.589796612697 \tabularnewline
77 & 106.155094190562 & 95.7968435741559 & 116.513344806969 \tabularnewline
78 & 107.860323266666 & 96.0951640711867 & 119.625482462144 \tabularnewline
79 & 137.660380272208 & 121.634018301977 & 153.686742242438 \tabularnewline
80 & 144.580730180396 & 126.62136823562 & 162.540092125172 \tabularnewline
81 & 140.227432134359 & 121.660005786904 & 158.794858481814 \tabularnewline
82 & 127.804414108979 & 109.725269675016 & 145.883558542942 \tabularnewline
83 & 120.932341849318 & 102.69443679971 & 139.170246898925 \tabularnewline
84 & 121.078088071761 & 97.5027886313403 & 144.653387512182 \tabularnewline
\hline
\end{tabular}
%Source: https://freestatistics.org/blog/index.php?pk=267832&T=3

[TABLE]
[ROW][C]Extrapolation Forecasts of Exponential Smoothing[/C][/ROW]
[ROW][C]t[/C][C]Forecast[/C][C]95% Lower Bound[/C][C]95% Upper Bound[/C][/ROW]
[ROW][C]73[/C][C]120.817909828413[/C][C]115.593229623769[/C][C]126.042590033058[/C][/ROW]
[ROW][C]74[/C][C]118.74673472777[/C][C]111.801287020649[/C][C]125.692182434891[/C][/ROW]
[ROW][C]75[/C][C]115.159064458216[/C][C]106.855530293337[/C][C]123.462598623095[/C][/ROW]
[ROW][C]76[/C][C]113.028065606617[/C][C]103.466334600538[/C][C]122.589796612697[/C][/ROW]
[ROW][C]77[/C][C]106.155094190562[/C][C]95.7968435741559[/C][C]116.513344806969[/C][/ROW]
[ROW][C]78[/C][C]107.860323266666[/C][C]96.0951640711867[/C][C]119.625482462144[/C][/ROW]
[ROW][C]79[/C][C]137.660380272208[/C][C]121.634018301977[/C][C]153.686742242438[/C][/ROW]
[ROW][C]80[/C][C]144.580730180396[/C][C]126.62136823562[/C][C]162.540092125172[/C][/ROW]
[ROW][C]81[/C][C]140.227432134359[/C][C]121.660005786904[/C][C]158.794858481814[/C][/ROW]
[ROW][C]82[/C][C]127.804414108979[/C][C]109.725269675016[/C][C]145.883558542942[/C][/ROW]
[ROW][C]83[/C][C]120.932341849318[/C][C]102.69443679971[/C][C]139.170246898925[/C][/ROW]
[ROW][C]84[/C][C]121.078088071761[/C][C]97.5027886313403[/C][C]144.653387512182[/C][/ROW]
[/TABLE]
Source: https://freestatistics.org/blog/index.php?pk=267832&T=3

Globally Unique Identifier (entire table): ba.freestatistics.org/blog/index.php?pk=267832&T=3

As an alternative you can also use a QR Code:  

The GUIDs for individual cells are displayed in the table below:

Extrapolation Forecasts of Exponential Smoothing
tForecast95% Lower Bound95% Upper Bound
73120.817909828413115.593229623769126.042590033058
74118.74673472777111.801287020649125.692182434891
75115.159064458216106.855530293337123.462598623095
76113.028065606617103.466334600538122.589796612697
77106.15509419056295.7968435741559116.513344806969
78107.86032326666696.0951640711867119.625482462144
79137.660380272208121.634018301977153.686742242438
80144.580730180396126.62136823562162.540092125172
81140.227432134359121.660005786904158.794858481814
82127.804414108979109.725269675016145.883558542942
83120.932341849318102.69443679971139.170246898925
84121.07808807176197.5027886313403144.653387512182


Parameters (Session):
par1 = 12 ; par2 = Triple ; par3 = multiplicative ;
Parameters (R input):
par1 = 12 ; par2 = Triple ; par3 = multiplicative ;
R code (references can be found in the software module):
par1 <- as.numeric(par1)
if (par2 == 'Single') K <- 1
if (par2 == 'Double') K <- 2
if (par2 == 'Triple') K <- par1
nx <- length(x)
nxmK <- nx - K
x <- ts(x, frequency = par1)
if (par2 == 'Single') fit <- HoltWinters(x, gamma=F, beta=F)
if (par2 == 'Double') fit <- HoltWinters(x, gamma=F)
if (par2 == 'Triple') fit <- HoltWinters(x, seasonal=par3)
fit
myresid <- x - fit$fitted[,'xhat']
bitmap(file='test1.png')
op <- par(mfrow=c(2,1))
plot(fit,ylab='Observed (black) / Fitted (red)',main='Interpolation Fit of Exponential Smoothing')
plot(myresid,ylab='Residuals',main='Interpolation Prediction Errors')
par(op)
dev.off()
bitmap(file='test2.png')
p <- predict(fit, par1, prediction.interval=TRUE)
np <- length(p[,1])
plot(fit,p,ylab='Observed (black) / Fitted (red)',main='Extrapolation Fit of Exponential Smoothing')
dev.off()
bitmap(file='test3.png')
op <- par(mfrow = c(2,2))
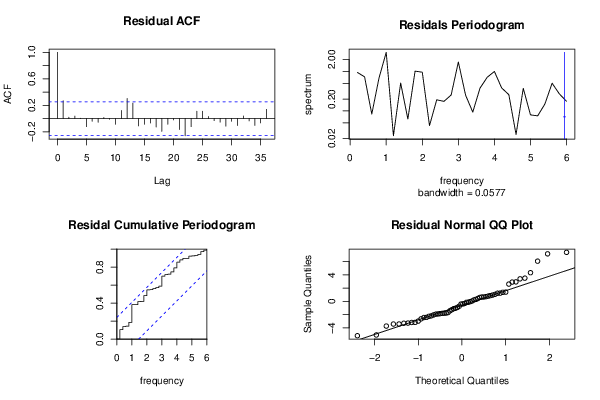
acf(as.numeric(myresid),lag.max = nx/2,main='Residual ACF')
spectrum(myresid,main='Residals Periodogram')
cpgram(myresid,main='Residal Cumulative Periodogram')
qqnorm(myresid,main='Residual Normal QQ Plot')
qqline(myresid)
par(op)
dev.off()
load(file='createtable')
a<-table.start()
a<-table.row.start(a)
a<-table.element(a,'Estimated Parameters of Exponential Smoothing',2,TRUE)
a<-table.row.end(a)
a<-table.row.start(a)
a<-table.element(a,'Parameter',header=TRUE)
a<-table.element(a,'Value',header=TRUE)
a<-table.row.end(a)
a<-table.row.start(a)
a<-table.element(a,'alpha',header=TRUE)
a<-table.element(a,fit$alpha)
a<-table.row.end(a)
a<-table.row.start(a)
a<-table.element(a,'beta',header=TRUE)
a<-table.element(a,fit$beta)
a<-table.row.end(a)
a<-table.row.start(a)
a<-table.element(a,'gamma',header=TRUE)
a<-table.element(a,fit$gamma)
a<-table.row.end(a)
a<-table.end(a)
table.save(a,file='mytable.tab')
a<-table.start()
a<-table.row.start(a)
a<-table.element(a,'Interpolation Forecasts of Exponential Smoothing',4,TRUE)
a<-table.row.end(a)
a<-table.row.start(a)
a<-table.element(a,'t',header=TRUE)
a<-table.element(a,'Observed',header=TRUE)
a<-table.element(a,'Fitted',header=TRUE)
a<-table.element(a,'Residuals',header=TRUE)
a<-table.row.end(a)
for (i in 1:nxmK) {
a<-table.row.start(a)
a<-table.element(a,i+K,header=TRUE)
a<-table.element(a,x[i+K])
a<-table.element(a,fit$fitted[i,'xhat'])
a<-table.element(a,myresid[i])
a<-table.row.end(a)
}
a<-table.end(a)
table.save(a,file='mytable1.tab')
a<-table.start()
a<-table.row.start(a)
a<-table.element(a,'Extrapolation Forecasts of Exponential Smoothing',4,TRUE)
a<-table.row.end(a)
a<-table.row.start(a)
a<-table.element(a,'t',header=TRUE)
a<-table.element(a,'Forecast',header=TRUE)
a<-table.element(a,'95% Lower Bound',header=TRUE)
a<-table.element(a,'95% Upper Bound',header=TRUE)
a<-table.row.end(a)
for (i in 1:np) {
a<-table.row.start(a)
a<-table.element(a,nx+i,header=TRUE)
a<-table.element(a,p[i,'fit'])
a<-table.element(a,p[i,'lwr'])
a<-table.element(a,p[i,'upr'])
a<-table.row.end(a)
}
a<-table.end(a)
table.save(a,file='mytable2.tab')