Free Statistics
of Irreproducible Research!
Description of Statistical Computation | |||||||||||||||||||||||||||||||||
|---|---|---|---|---|---|---|---|---|---|---|---|---|---|---|---|---|---|---|---|---|---|---|---|---|---|---|---|---|---|---|---|---|---|
| Author's title | |||||||||||||||||||||||||||||||||
| Author | *The author of this computation has been verified* | ||||||||||||||||||||||||||||||||
| R Software Module | rwasp_density.wasp | ||||||||||||||||||||||||||||||||
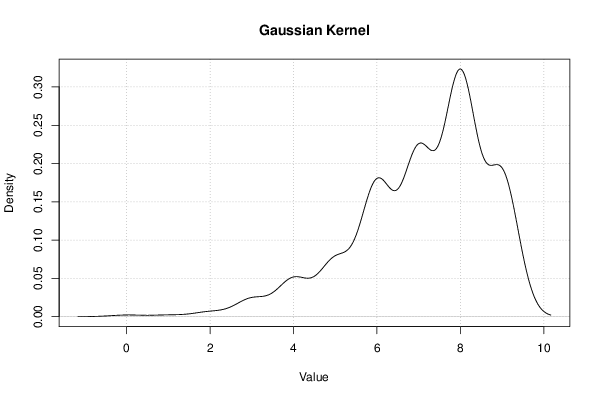
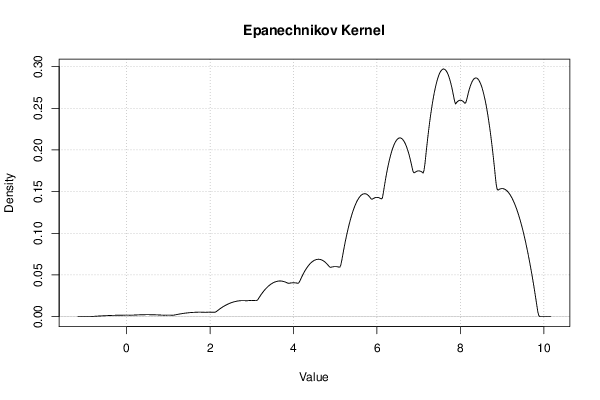
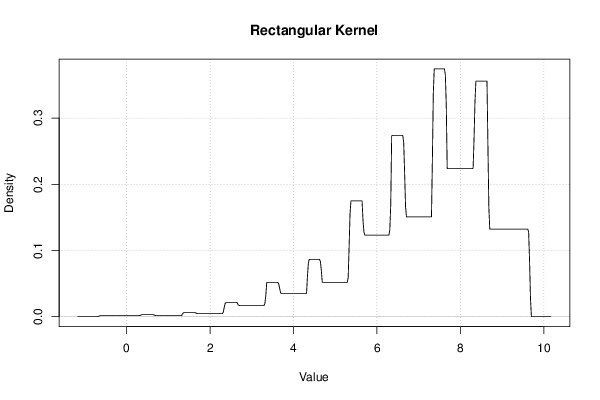
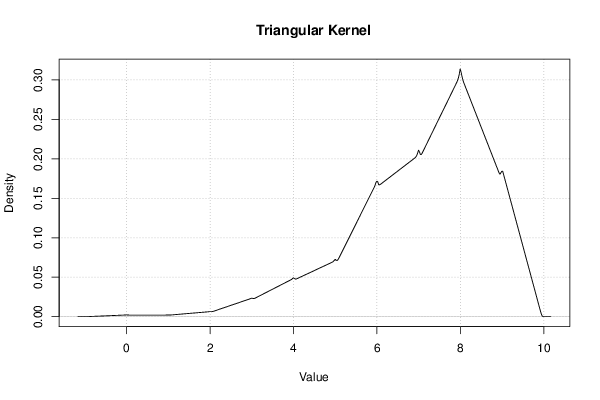
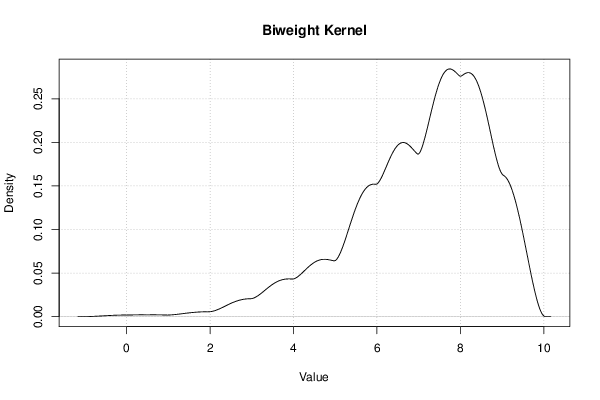
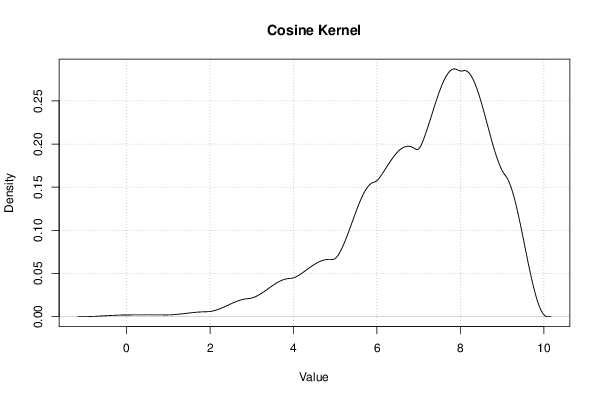
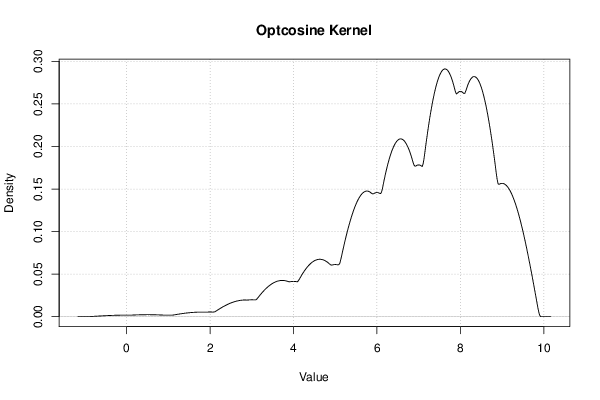
| Title produced by software | Kernel Density Estimation | ||||||||||||||||||||||||||||||||
| Date of computation | Mon, 15 Dec 2014 11:31:53 +0000 | ||||||||||||||||||||||||||||||||
| Cite this page as follows | Statistical Computations at FreeStatistics.org, Office for Research Development and Education, URL https://freestatistics.org/blog/index.php?v=date/2014/Dec/15/t1418643149sd5mm7yh45i1u9b.htm/, Retrieved Thu, 16 May 2024 06:30:51 +0000 | ||||||||||||||||||||||||||||||||
| Statistical Computations at FreeStatistics.org, Office for Research Development and Education, URL https://freestatistics.org/blog/index.php?pk=268131, Retrieved Thu, 16 May 2024 06:30:51 +0000 | |||||||||||||||||||||||||||||||||
| QR Codes: | |||||||||||||||||||||||||||||||||
|
| |||||||||||||||||||||||||||||||||
| Original text written by user: | |||||||||||||||||||||||||||||||||
| IsPrivate? | No (this computation is public) | ||||||||||||||||||||||||||||||||
| User-defined keywords | |||||||||||||||||||||||||||||||||
| Estimated Impact | 89 | ||||||||||||||||||||||||||||||||
Tree of Dependent Computations | |||||||||||||||||||||||||||||||||
| Family? (F = Feedback message, R = changed R code, M = changed R Module, P = changed Parameters, D = changed Data) | |||||||||||||||||||||||||||||||||
| - [Maximum-likelihood Fitting - Normal Distribution] [Intrinsic Motivat...] [2010-10-12 11:57:21] [b98453cac15ba1066b407e146608df68] - RMPD [Kernel Density Estimation] [] [2011-10-18 22:33:50] [b98453cac15ba1066b407e146608df68] - RMPD [Kernel Density Estimation] [] [2014-12-10 15:11:00] [2add28fdfb91c9297fa0715b27e01e1f] - D [Kernel Density Estimation] [] [2014-12-15 11:31:53] [921bde233b8ec180d9061abb09deed53] [Current] - D [Kernel Density Estimation] [] [2014-12-15 11:37:11] [ccd66b5a2d6b0dd8c147f526ae5cbd1f] - PD [Kernel Density Estimation] [] [2014-12-15 11:41:35] [ccd66b5a2d6b0dd8c147f526ae5cbd1f] - MP [Kernel Density Estimation] [] [2014-12-15 11:42:06] [ccd66b5a2d6b0dd8c147f526ae5cbd1f] - PD [Kernel Density Estimation] [] [2014-12-15 11:56:00] [ccd66b5a2d6b0dd8c147f526ae5cbd1f] - PD [Kernel Density Estimation] [] [2014-12-15 13:59:35] [ccd66b5a2d6b0dd8c147f526ae5cbd1f] - PD [Kernel Density Estimation] [] [2014-12-15 11:59:36] [ccd66b5a2d6b0dd8c147f526ae5cbd1f] - PD [Kernel Density Estimation] [] [2014-12-15 12:02:12] [ccd66b5a2d6b0dd8c147f526ae5cbd1f] - PD [Kernel Density Estimation] [] [2014-12-15 13:48:05] [ccd66b5a2d6b0dd8c147f526ae5cbd1f] | |||||||||||||||||||||||||||||||||
| Feedback Forum | |||||||||||||||||||||||||||||||||
Post a new message | |||||||||||||||||||||||||||||||||
Dataset | |||||||||||||||||||||||||||||||||
| Dataseries X: | |||||||||||||||||||||||||||||||||
9 8 8 8 8 7 8 9 8 7 9 7 8 8 8 8 8 6 9 7 7 8 7 8 8 3 9 8 8 6 5 8 8 9 7 7 3 7 8 8 7 8 8 9 6 9 8 8 8 7 8 7 7 9 7 9 7 6 3 9 9 7 6 9 8 8 7 9 5 6 8 8 8 8 7 8 9 9 8 4 7 8 6 7 7 3 8 8 8 8 5 6 6 7 7 7 8 9 8 8 7 9 7 6 7 8 6 2 4 8 6 8 6 7 7 7 9 7 6 8 8 9 7 6 8 6 6 9 6 9 8 8 9 6 4 8 5 7 9 9 8 6 8 3 8 7 9 4 6 3 8 8 9 8 8 9 8 9 7 7 6 8 6 7 8 8 7 9 9 9 6 8 9 9 8 8 8 8 8 9 6 9 8 8 8 8 9 9 9 8 8 8 3 6 5 4 9 8 3 6 6 9 7 6 9 7 8 8 8 0 6 9 9 6 8 8 5 6 9 9 9 6 4 8 4 5 8 6 8 9 7 4 8 8 8 4 9 8 6 3 7 8 7 7 8 7 7 6 8 8 7 9 9 7 7 8 8 6 9 6 5 7 9 6 7 5 9 8 4 9 8 7 8 1 8 8 9 8 9 6 7 8 8 9 9 7 8 2 4 5 8 6 9 8 4 7 7 8 5 5 7 7 8 6 7 8 8 7 9 8 6 8 5 3 6 4 5 9 5 6 7 6 9 6 7 8 5 4 4 4 5 4 6 5 5 6 5 7 6 6 8 7 9 4 7 7 8 8 7 7 9 6 7 8 5 5 5 8 5 7 6 5 7 6 8 9 7 7 9 7 7 6 8 8 7 5 6 8 7 6 4 6 7 8 7 8 9 8 7 4 6 7 8 6 7 8 7 8 9 7 8 8 9 6 8 8 9 7 6 5 8 8 6 4 9 6 5 8 9 4 7 5 8 7 8 6 9 5 6 7 9 6 6 9 9 6 6 9 8 6 6 7 7 2 6 9 6 5 6 8 3 6 8 9 9 8 9 7 5 7 9 9 8 8 6 9 8 9 8 7 8 7 5 7 7 6 7 6 9 6 7 4 8 6 5 7 8 | |||||||||||||||||||||||||||||||||
Tables (Output of Computation) | |||||||||||||||||||||||||||||||||
| |||||||||||||||||||||||||||||||||
Figures (Output of Computation) | |||||||||||||||||||||||||||||||||
Input Parameters & R Code | |||||||||||||||||||||||||||||||||
| Parameters (Session): | |||||||||||||||||||||||||||||||||
| par1 = 0 ; par2 = no ; | |||||||||||||||||||||||||||||||||
| Parameters (R input): | |||||||||||||||||||||||||||||||||
| par1 = 0 ; par2 = no ; par3 = ; | |||||||||||||||||||||||||||||||||
| R code (references can be found in the software module): | |||||||||||||||||||||||||||||||||
if (par1 == '0') bw <- 'nrd0' | |||||||||||||||||||||||||||||||||