Free Statistics

of Irreproducible Research!

Author's title

Author*The author of this computation has been verified*
R Software Modulerwasp_multipleregression.wasp
Title produced by softwareMultiple Regression
Date of computationMon, 15 Dec 2014 12:34:12 +0000
Cite this page as followsStatistical Computations at FreeStatistics.org, Office for Research Development and Education, URL https://freestatistics.org/blog/index.php?v=date/2014/Dec/15/t1418647020uma7jnze5s0dxtd.htm/, Retrieved Thu, 16 May 2024 23:35:06 +0000
Statistical Computations at FreeStatistics.org, Office for Research Development and Education, URL https://freestatistics.org/blog/index.php?pk=268255, Retrieved Thu, 16 May 2024 23:35:06 +0000
QR Codes:

Original text written by user:
IsPrivate?No (this computation is public)
User-defined keywords
Estimated Impact73
Family? (F = Feedback message, R = changed R code, M = changed R Module, P = changed Parameters, D = changed Data)
-     [Chi-Squared Test, McNemar Test, and Fisher Exact Test] [P chi AMSIBconfstat] [2014-12-15 09:53:08] [46c7ebd23dbdec306a09830d8b7528e7]
- RM D    [Multiple Regression] [P MR MOTstress1] [2014-12-15 12:34:12] [9772ee27deeac3d50cc1fb84835cd7d6] [Current]
Feedback Forum

Post a new message
Dataseries X:
62 72 11 11
56 61 6 13
57 68 7 12
51 61 10 15
56 64 9 13
30 65 7 16
61 69 4 12
47 63 4 12
56 75 4 15
50 63 8 12
67 73 4 12
41 75 7 11
45 63 4 12
48 63 4 11
44 62 9 14
37 64 4 12
56 60 10 15
66 56 4 14
38 59 5 12
34 68 4 14
49 66 4 11
55 73 4 13
49 72 4 14
59 71 6 16
40 59 10 13
58 64 7 14
60 66 4 16
63 78 4 11
56 68 7 13
54 73 4 13
52 62 8 15
34 65 11 12
69 68 6 13
32 65 14 12
48 60 5 14
67 71 4 14
58 65 8 16
57 68 9 15
42 64 4 14
64 74 4 13
58 69 5 14
66 76 4 15
26 68 5 14
61 72 4 12
52 67 4 7
51 63 7 12
55 59 10 15
50 73 4 12
60 66 5 13
56 62 4 11
63 69 4 14
61 66 4 13


Summary of computational transaction
Raw Inputview raw input (R code)
Raw Outputview raw output of R engine
Computing time5 seconds
R Server'Herman Ole Andreas Wold' @ wold.wessa.net

\begin{tabular}{lllllllll}
\hline
Summary of computational transaction \tabularnewline
Raw Input & view raw input (R code)  \tabularnewline
Raw Output & view raw output of R engine  \tabularnewline
Computing time & 5 seconds \tabularnewline
R Server & 'Herman Ole Andreas Wold' @ wold.wessa.net \tabularnewline
\hline
\end{tabular}
%Source: https://freestatistics.org/blog/index.php?pk=268255&T=0

[TABLE]
[ROW][C]Summary of computational transaction[/C][/ROW]
[ROW][C]Raw Input[/C][C]view raw input (R code) [/C][/ROW]
[ROW][C]Raw Output[/C][C]view raw output of R engine [/C][/ROW]
[ROW][C]Computing time[/C][C]5 seconds[/C][/ROW]
[ROW][C]R Server[/C][C]'Herman Ole Andreas Wold' @ wold.wessa.net[/C][/ROW]
[/TABLE]
Source: https://freestatistics.org/blog/index.php?pk=268255&T=0

Globally Unique Identifier (entire table): ba.freestatistics.org/blog/index.php?pk=268255&T=0

As an alternative you can also use a QR Code:  

The GUIDs for individual cells are displayed in the table below:

Summary of computational transaction
Raw Inputview raw input (R code)
Raw Outputview raw output of R engine
Computing time5 seconds
R Server'Herman Ole Andreas Wold' @ wold.wessa.net


Multiple Linear Regression - Estimated Regression Equation
STRESSTOTB[t] = + 13.5299 + 0.0236852AMS.IB[t] -0.033784AMS.EB[t] + 0.0992064AMS.AB[t] + e[t]

\begin{tabular}{lllllllll}
\hline
Multiple Linear Regression - Estimated Regression Equation \tabularnewline
STRESSTOTB[t] =  +  13.5299 +  0.0236852AMS.IB[t] -0.033784AMS.EB[t] +  0.0992064AMS.AB[t]  + e[t] \tabularnewline
\hline
\end{tabular}
%Source: https://freestatistics.org/blog/index.php?pk=268255&T=1

[TABLE]
[ROW][C]Multiple Linear Regression - Estimated Regression Equation[/C][/ROW]
[ROW][C]STRESSTOTB[t] =  +  13.5299 +  0.0236852AMS.IB[t] -0.033784AMS.EB[t] +  0.0992064AMS.AB[t]  + e[t][/C][/ROW]
[/TABLE]
Source: https://freestatistics.org/blog/index.php?pk=268255&T=1

Globally Unique Identifier (entire table): ba.freestatistics.org/blog/index.php?pk=268255&T=1

As an alternative you can also use a QR Code:  

The GUIDs for individual cells are displayed in the table below:

Multiple Linear Regression - Estimated Regression Equation
STRESSTOTB[t] = + 13.5299 + 0.0236852AMS.IB[t] -0.033784AMS.EB[t] + 0.0992064AMS.AB[t] + e[t]


Multiple Linear Regression - Ordinary Least Squares
VariableParameterS.D.T-STATH0: parameter = 02-tail p-value1-tail p-value
(Intercept)13.52993.634513.7230.0005176010.000258801
AMS.IB0.02368520.02466740.96020.3417760.170888
AMS.EB-0.0337840.0514701-0.65640.5147140.257357
AMS.AB0.09920640.1022840.96990.3369530.168476

\begin{tabular}{lllllllll}
\hline
Multiple Linear Regression - Ordinary Least Squares \tabularnewline
Variable & Parameter & S.D. & T-STATH0: parameter = 0 & 2-tail p-value & 1-tail p-value \tabularnewline
(Intercept) & 13.5299 & 3.63451 & 3.723 & 0.000517601 & 0.000258801 \tabularnewline
AMS.IB & 0.0236852 & 0.0246674 & 0.9602 & 0.341776 & 0.170888 \tabularnewline
AMS.EB & -0.033784 & 0.0514701 & -0.6564 & 0.514714 & 0.257357 \tabularnewline
AMS.AB & 0.0992064 & 0.102284 & 0.9699 & 0.336953 & 0.168476 \tabularnewline
\hline
\end{tabular}
%Source: https://freestatistics.org/blog/index.php?pk=268255&T=2

[TABLE]
[ROW][C]Multiple Linear Regression - Ordinary Least Squares[/C][/ROW]
[ROW][C]Variable[/C][C]Parameter[/C][C]S.D.[/C][C]T-STATH0: parameter = 0[/C][C]2-tail p-value[/C][C]1-tail p-value[/C][/ROW]
[ROW][C](Intercept)[/C][C]13.5299[/C][C]3.63451[/C][C]3.723[/C][C]0.000517601[/C][C]0.000258801[/C][/ROW]
[ROW][C]AMS.IB[/C][C]0.0236852[/C][C]0.0246674[/C][C]0.9602[/C][C]0.341776[/C][C]0.170888[/C][/ROW]
[ROW][C]AMS.EB[/C][C]-0.033784[/C][C]0.0514701[/C][C]-0.6564[/C][C]0.514714[/C][C]0.257357[/C][/ROW]
[ROW][C]AMS.AB[/C][C]0.0992064[/C][C]0.102284[/C][C]0.9699[/C][C]0.336953[/C][C]0.168476[/C][/ROW]
[/TABLE]
Source: https://freestatistics.org/blog/index.php?pk=268255&T=2

Globally Unique Identifier (entire table): ba.freestatistics.org/blog/index.php?pk=268255&T=2

As an alternative you can also use a QR Code:  

The GUIDs for individual cells are displayed in the table below:

Multiple Linear Regression - Ordinary Least Squares
VariableParameterS.D.T-STATH0: parameter = 02-tail p-value1-tail p-value
(Intercept)13.52993.634513.7230.0005176010.000258801
AMS.IB0.02368520.02466740.96020.3417760.170888
AMS.EB-0.0337840.0514701-0.65640.5147140.257357
AMS.AB0.09920640.1022840.96990.3369530.168476


Multiple Linear Regression - Regression Statistics
Multiple R0.208255
R-squared0.04337
Adjusted R-squared-0.0164193
F-TEST (value)0.72538
F-TEST (DF numerator)3
F-TEST (DF denominator)48
p-value0.541834
Multiple Linear Regression - Residual Statistics
Residual Standard Deviation1.71342
Sum Squared Residuals140.919

\begin{tabular}{lllllllll}
\hline
Multiple Linear Regression - Regression Statistics \tabularnewline
Multiple R & 0.208255 \tabularnewline
R-squared & 0.04337 \tabularnewline
Adjusted R-squared & -0.0164193 \tabularnewline
F-TEST (value) & 0.72538 \tabularnewline
F-TEST (DF numerator) & 3 \tabularnewline
F-TEST (DF denominator) & 48 \tabularnewline
p-value & 0.541834 \tabularnewline
Multiple Linear Regression - Residual Statistics \tabularnewline
Residual Standard Deviation & 1.71342 \tabularnewline
Sum Squared Residuals & 140.919 \tabularnewline
\hline
\end{tabular}
%Source: https://freestatistics.org/blog/index.php?pk=268255&T=3

[TABLE]
[ROW][C]Multiple Linear Regression - Regression Statistics[/C][/ROW]
[ROW][C]Multiple R[/C][C]0.208255[/C][/ROW]
[ROW][C]R-squared[/C][C]0.04337[/C][/ROW]
[ROW][C]Adjusted R-squared[/C][C]-0.0164193[/C][/ROW]
[ROW][C]F-TEST (value)[/C][C]0.72538[/C][/ROW]
[ROW][C]F-TEST (DF numerator)[/C][C]3[/C][/ROW]
[ROW][C]F-TEST (DF denominator)[/C][C]48[/C][/ROW]
[ROW][C]p-value[/C][C]0.541834[/C][/ROW]
[ROW][C]Multiple Linear Regression - Residual Statistics[/C][/ROW]
[ROW][C]Residual Standard Deviation[/C][C]1.71342[/C][/ROW]
[ROW][C]Sum Squared Residuals[/C][C]140.919[/C][/ROW]
[/TABLE]
Source: https://freestatistics.org/blog/index.php?pk=268255&T=3

Globally Unique Identifier (entire table): ba.freestatistics.org/blog/index.php?pk=268255&T=3

As an alternative you can also use a QR Code:  

The GUIDs for individual cells are displayed in the table below:

Multiple Linear Regression - Regression Statistics
Multiple R0.208255
R-squared0.04337
Adjusted R-squared-0.0164193
F-TEST (value)0.72538
F-TEST (DF numerator)3
F-TEST (DF denominator)48
p-value0.541834
Multiple Linear Regression - Residual Statistics
Residual Standard Deviation1.71342
Sum Squared Residuals140.919


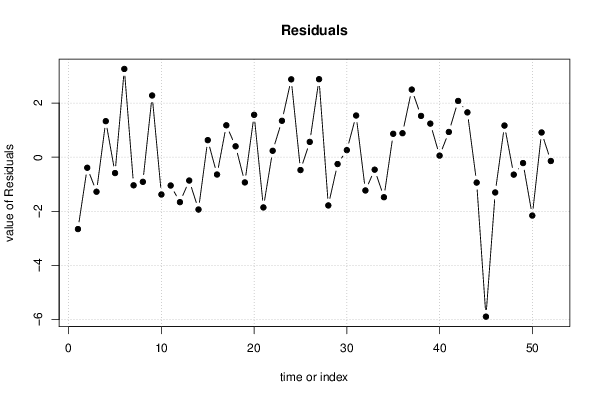
Multiple Linear Regression - Actuals, Interpolation, and Residuals
Time or IndexActualsInterpolationForecastResidualsPrediction Error
11113.6572-2.65718
21313.3907-0.390659
31213.2771-1.27706
41513.66911.33094
51313.5869-0.586926
61612.73893.26109
71213.0404-1.0404
81212.9115-0.911511
91512.71932.28073
101213.3794-1.37939
111213.0474-1.04737
121112.6616-1.66161
131212.8641-0.864141
141112.9352-1.9352
151413.37030.629728
161212.6409-0.640876
171513.82131.17873
181413.5980.401983
191212.9327-0.932687
201412.43471.56532
211112.8575-1.85753
221312.76320.236847
231412.65481.34517
241613.12392.87613
251313.4761-0.476089
261413.43590.564117
271613.11812.88193
281112.7837-1.78371
291313.2534-0.253377
301312.73950.260532
311513.46051.53945
321213.2305-1.23048
331313.4621-0.462078
341213.4807-1.48073
351413.13580.864245
361413.11490.885057
371613.50132.49869
381513.47551.52453
391412.75931.2407
401312.94250.0574646
411413.06860.931449
421512.92232.07766
431412.34441.65559
441212.939-0.939048
45712.8948-5.8948
461213.3039-1.30387
471513.83141.16863
481212.6447-0.644727
491313.2173-0.217273
501113.1585-2.15846
511413.08780.91223
521313.1418-0.141752

\begin{tabular}{lllllllll}
\hline
Multiple Linear Regression - Actuals, Interpolation, and Residuals \tabularnewline
Time or Index & Actuals & InterpolationForecast & ResidualsPrediction Error \tabularnewline
1 & 11 & 13.6572 & -2.65718 \tabularnewline
2 & 13 & 13.3907 & -0.390659 \tabularnewline
3 & 12 & 13.2771 & -1.27706 \tabularnewline
4 & 15 & 13.6691 & 1.33094 \tabularnewline
5 & 13 & 13.5869 & -0.586926 \tabularnewline
6 & 16 & 12.7389 & 3.26109 \tabularnewline
7 & 12 & 13.0404 & -1.0404 \tabularnewline
8 & 12 & 12.9115 & -0.911511 \tabularnewline
9 & 15 & 12.7193 & 2.28073 \tabularnewline
10 & 12 & 13.3794 & -1.37939 \tabularnewline
11 & 12 & 13.0474 & -1.04737 \tabularnewline
12 & 11 & 12.6616 & -1.66161 \tabularnewline
13 & 12 & 12.8641 & -0.864141 \tabularnewline
14 & 11 & 12.9352 & -1.9352 \tabularnewline
15 & 14 & 13.3703 & 0.629728 \tabularnewline
16 & 12 & 12.6409 & -0.640876 \tabularnewline
17 & 15 & 13.8213 & 1.17873 \tabularnewline
18 & 14 & 13.598 & 0.401983 \tabularnewline
19 & 12 & 12.9327 & -0.932687 \tabularnewline
20 & 14 & 12.4347 & 1.56532 \tabularnewline
21 & 11 & 12.8575 & -1.85753 \tabularnewline
22 & 13 & 12.7632 & 0.236847 \tabularnewline
23 & 14 & 12.6548 & 1.34517 \tabularnewline
24 & 16 & 13.1239 & 2.87613 \tabularnewline
25 & 13 & 13.4761 & -0.476089 \tabularnewline
26 & 14 & 13.4359 & 0.564117 \tabularnewline
27 & 16 & 13.1181 & 2.88193 \tabularnewline
28 & 11 & 12.7837 & -1.78371 \tabularnewline
29 & 13 & 13.2534 & -0.253377 \tabularnewline
30 & 13 & 12.7395 & 0.260532 \tabularnewline
31 & 15 & 13.4605 & 1.53945 \tabularnewline
32 & 12 & 13.2305 & -1.23048 \tabularnewline
33 & 13 & 13.4621 & -0.462078 \tabularnewline
34 & 12 & 13.4807 & -1.48073 \tabularnewline
35 & 14 & 13.1358 & 0.864245 \tabularnewline
36 & 14 & 13.1149 & 0.885057 \tabularnewline
37 & 16 & 13.5013 & 2.49869 \tabularnewline
38 & 15 & 13.4755 & 1.52453 \tabularnewline
39 & 14 & 12.7593 & 1.2407 \tabularnewline
40 & 13 & 12.9425 & 0.0574646 \tabularnewline
41 & 14 & 13.0686 & 0.931449 \tabularnewline
42 & 15 & 12.9223 & 2.07766 \tabularnewline
43 & 14 & 12.3444 & 1.65559 \tabularnewline
44 & 12 & 12.939 & -0.939048 \tabularnewline
45 & 7 & 12.8948 & -5.8948 \tabularnewline
46 & 12 & 13.3039 & -1.30387 \tabularnewline
47 & 15 & 13.8314 & 1.16863 \tabularnewline
48 & 12 & 12.6447 & -0.644727 \tabularnewline
49 & 13 & 13.2173 & -0.217273 \tabularnewline
50 & 11 & 13.1585 & -2.15846 \tabularnewline
51 & 14 & 13.0878 & 0.91223 \tabularnewline
52 & 13 & 13.1418 & -0.141752 \tabularnewline
\hline
\end{tabular}
%Source: https://freestatistics.org/blog/index.php?pk=268255&T=4

[TABLE]
[ROW][C]Multiple Linear Regression - Actuals, Interpolation, and Residuals[/C][/ROW]
[ROW][C]Time or Index[/C][C]Actuals[/C][C]InterpolationForecast[/C][C]ResidualsPrediction Error[/C][/ROW]
[ROW][C]1[/C][C]11[/C][C]13.6572[/C][C]-2.65718[/C][/ROW]
[ROW][C]2[/C][C]13[/C][C]13.3907[/C][C]-0.390659[/C][/ROW]
[ROW][C]3[/C][C]12[/C][C]13.2771[/C][C]-1.27706[/C][/ROW]
[ROW][C]4[/C][C]15[/C][C]13.6691[/C][C]1.33094[/C][/ROW]
[ROW][C]5[/C][C]13[/C][C]13.5869[/C][C]-0.586926[/C][/ROW]
[ROW][C]6[/C][C]16[/C][C]12.7389[/C][C]3.26109[/C][/ROW]
[ROW][C]7[/C][C]12[/C][C]13.0404[/C][C]-1.0404[/C][/ROW]
[ROW][C]8[/C][C]12[/C][C]12.9115[/C][C]-0.911511[/C][/ROW]
[ROW][C]9[/C][C]15[/C][C]12.7193[/C][C]2.28073[/C][/ROW]
[ROW][C]10[/C][C]12[/C][C]13.3794[/C][C]-1.37939[/C][/ROW]
[ROW][C]11[/C][C]12[/C][C]13.0474[/C][C]-1.04737[/C][/ROW]
[ROW][C]12[/C][C]11[/C][C]12.6616[/C][C]-1.66161[/C][/ROW]
[ROW][C]13[/C][C]12[/C][C]12.8641[/C][C]-0.864141[/C][/ROW]
[ROW][C]14[/C][C]11[/C][C]12.9352[/C][C]-1.9352[/C][/ROW]
[ROW][C]15[/C][C]14[/C][C]13.3703[/C][C]0.629728[/C][/ROW]
[ROW][C]16[/C][C]12[/C][C]12.6409[/C][C]-0.640876[/C][/ROW]
[ROW][C]17[/C][C]15[/C][C]13.8213[/C][C]1.17873[/C][/ROW]
[ROW][C]18[/C][C]14[/C][C]13.598[/C][C]0.401983[/C][/ROW]
[ROW][C]19[/C][C]12[/C][C]12.9327[/C][C]-0.932687[/C][/ROW]
[ROW][C]20[/C][C]14[/C][C]12.4347[/C][C]1.56532[/C][/ROW]
[ROW][C]21[/C][C]11[/C][C]12.8575[/C][C]-1.85753[/C][/ROW]
[ROW][C]22[/C][C]13[/C][C]12.7632[/C][C]0.236847[/C][/ROW]
[ROW][C]23[/C][C]14[/C][C]12.6548[/C][C]1.34517[/C][/ROW]
[ROW][C]24[/C][C]16[/C][C]13.1239[/C][C]2.87613[/C][/ROW]
[ROW][C]25[/C][C]13[/C][C]13.4761[/C][C]-0.476089[/C][/ROW]
[ROW][C]26[/C][C]14[/C][C]13.4359[/C][C]0.564117[/C][/ROW]
[ROW][C]27[/C][C]16[/C][C]13.1181[/C][C]2.88193[/C][/ROW]
[ROW][C]28[/C][C]11[/C][C]12.7837[/C][C]-1.78371[/C][/ROW]
[ROW][C]29[/C][C]13[/C][C]13.2534[/C][C]-0.253377[/C][/ROW]
[ROW][C]30[/C][C]13[/C][C]12.7395[/C][C]0.260532[/C][/ROW]
[ROW][C]31[/C][C]15[/C][C]13.4605[/C][C]1.53945[/C][/ROW]
[ROW][C]32[/C][C]12[/C][C]13.2305[/C][C]-1.23048[/C][/ROW]
[ROW][C]33[/C][C]13[/C][C]13.4621[/C][C]-0.462078[/C][/ROW]
[ROW][C]34[/C][C]12[/C][C]13.4807[/C][C]-1.48073[/C][/ROW]
[ROW][C]35[/C][C]14[/C][C]13.1358[/C][C]0.864245[/C][/ROW]
[ROW][C]36[/C][C]14[/C][C]13.1149[/C][C]0.885057[/C][/ROW]
[ROW][C]37[/C][C]16[/C][C]13.5013[/C][C]2.49869[/C][/ROW]
[ROW][C]38[/C][C]15[/C][C]13.4755[/C][C]1.52453[/C][/ROW]
[ROW][C]39[/C][C]14[/C][C]12.7593[/C][C]1.2407[/C][/ROW]
[ROW][C]40[/C][C]13[/C][C]12.9425[/C][C]0.0574646[/C][/ROW]
[ROW][C]41[/C][C]14[/C][C]13.0686[/C][C]0.931449[/C][/ROW]
[ROW][C]42[/C][C]15[/C][C]12.9223[/C][C]2.07766[/C][/ROW]
[ROW][C]43[/C][C]14[/C][C]12.3444[/C][C]1.65559[/C][/ROW]
[ROW][C]44[/C][C]12[/C][C]12.939[/C][C]-0.939048[/C][/ROW]
[ROW][C]45[/C][C]7[/C][C]12.8948[/C][C]-5.8948[/C][/ROW]
[ROW][C]46[/C][C]12[/C][C]13.3039[/C][C]-1.30387[/C][/ROW]
[ROW][C]47[/C][C]15[/C][C]13.8314[/C][C]1.16863[/C][/ROW]
[ROW][C]48[/C][C]12[/C][C]12.6447[/C][C]-0.644727[/C][/ROW]
[ROW][C]49[/C][C]13[/C][C]13.2173[/C][C]-0.217273[/C][/ROW]
[ROW][C]50[/C][C]11[/C][C]13.1585[/C][C]-2.15846[/C][/ROW]
[ROW][C]51[/C][C]14[/C][C]13.0878[/C][C]0.91223[/C][/ROW]
[ROW][C]52[/C][C]13[/C][C]13.1418[/C][C]-0.141752[/C][/ROW]
[/TABLE]
Source: https://freestatistics.org/blog/index.php?pk=268255&T=4

Globally Unique Identifier (entire table): ba.freestatistics.org/blog/index.php?pk=268255&T=4

As an alternative you can also use a QR Code:  

The GUIDs for individual cells are displayed in the table below:

Multiple Linear Regression - Actuals, Interpolation, and Residuals
Time or IndexActualsInterpolationForecastResidualsPrediction Error
11113.6572-2.65718
21313.3907-0.390659
31213.2771-1.27706
41513.66911.33094
51313.5869-0.586926
61612.73893.26109
71213.0404-1.0404
81212.9115-0.911511
91512.71932.28073
101213.3794-1.37939
111213.0474-1.04737
121112.6616-1.66161
131212.8641-0.864141
141112.9352-1.9352
151413.37030.629728
161212.6409-0.640876
171513.82131.17873
181413.5980.401983
191212.9327-0.932687
201412.43471.56532
211112.8575-1.85753
221312.76320.236847
231412.65481.34517
241613.12392.87613
251313.4761-0.476089
261413.43590.564117
271613.11812.88193
281112.7837-1.78371
291313.2534-0.253377
301312.73950.260532
311513.46051.53945
321213.2305-1.23048
331313.4621-0.462078
341213.4807-1.48073
351413.13580.864245
361413.11490.885057
371613.50132.49869
381513.47551.52453
391412.75931.2407
401312.94250.0574646
411413.06860.931449
421512.92232.07766
431412.34441.65559
441212.939-0.939048
45712.8948-5.8948
461213.3039-1.30387
471513.83141.16863
481212.6447-0.644727
491313.2173-0.217273
501113.1585-2.15846
511413.08780.91223
521313.1418-0.141752


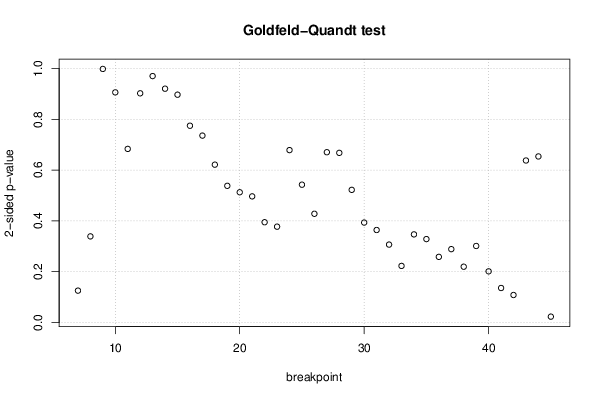
Goldfeld-Quandt test for Heteroskedasticity
p-valuesAlternative Hypothesis
breakpoint indexgreater2-sidedless
70.06282450.1256490.937175
80.1695830.3391660.830417
90.4989860.9979730.501014
100.4529130.9058260.547087
110.3417060.6834130.658294
120.548940.902120.45106
130.5150830.9698350.484917
140.5398730.9202540.460127
150.4483240.8966480.551676
160.3872560.7745120.612744
170.3678340.7356690.632166
180.3106670.6213340.689333
190.2690490.5380980.730951
200.2563640.5127280.743636
210.2483040.4966070.751696
220.1974240.3948480.802576
230.1886720.3773450.811328
240.3393350.678670.660665
250.2712310.5424620.728769
260.2140510.4281020.785949
270.3351410.6702820.664859
280.3338990.6677980.666101
290.261120.522240.73888
300.1967370.3934750.803263
310.1821160.3642320.817884
320.1534130.3068260.846587
330.111450.2229010.88855
340.1735090.3470170.826491
350.1642090.3284180.835791
360.1292650.2585290.870735
370.144470.288940.85553
380.1098680.2197370.890132
390.1506590.3013190.849341
400.1007740.2015490.899226
410.06799910.1359980.932001
420.05423130.1084630.945769
430.3188630.6377270.681137
440.3268320.6536640.673168
450.9883650.02326910.0116346

\begin{tabular}{lllllllll}
\hline
Goldfeld-Quandt test for Heteroskedasticity \tabularnewline
p-values & Alternative Hypothesis \tabularnewline
breakpoint index & greater & 2-sided & less \tabularnewline
7 & 0.0628245 & 0.125649 & 0.937175 \tabularnewline
8 & 0.169583 & 0.339166 & 0.830417 \tabularnewline
9 & 0.498986 & 0.997973 & 0.501014 \tabularnewline
10 & 0.452913 & 0.905826 & 0.547087 \tabularnewline
11 & 0.341706 & 0.683413 & 0.658294 \tabularnewline
12 & 0.54894 & 0.90212 & 0.45106 \tabularnewline
13 & 0.515083 & 0.969835 & 0.484917 \tabularnewline
14 & 0.539873 & 0.920254 & 0.460127 \tabularnewline
15 & 0.448324 & 0.896648 & 0.551676 \tabularnewline
16 & 0.387256 & 0.774512 & 0.612744 \tabularnewline
17 & 0.367834 & 0.735669 & 0.632166 \tabularnewline
18 & 0.310667 & 0.621334 & 0.689333 \tabularnewline
19 & 0.269049 & 0.538098 & 0.730951 \tabularnewline
20 & 0.256364 & 0.512728 & 0.743636 \tabularnewline
21 & 0.248304 & 0.496607 & 0.751696 \tabularnewline
22 & 0.197424 & 0.394848 & 0.802576 \tabularnewline
23 & 0.188672 & 0.377345 & 0.811328 \tabularnewline
24 & 0.339335 & 0.67867 & 0.660665 \tabularnewline
25 & 0.271231 & 0.542462 & 0.728769 \tabularnewline
26 & 0.214051 & 0.428102 & 0.785949 \tabularnewline
27 & 0.335141 & 0.670282 & 0.664859 \tabularnewline
28 & 0.333899 & 0.667798 & 0.666101 \tabularnewline
29 & 0.26112 & 0.52224 & 0.73888 \tabularnewline
30 & 0.196737 & 0.393475 & 0.803263 \tabularnewline
31 & 0.182116 & 0.364232 & 0.817884 \tabularnewline
32 & 0.153413 & 0.306826 & 0.846587 \tabularnewline
33 & 0.11145 & 0.222901 & 0.88855 \tabularnewline
34 & 0.173509 & 0.347017 & 0.826491 \tabularnewline
35 & 0.164209 & 0.328418 & 0.835791 \tabularnewline
36 & 0.129265 & 0.258529 & 0.870735 \tabularnewline
37 & 0.14447 & 0.28894 & 0.85553 \tabularnewline
38 & 0.109868 & 0.219737 & 0.890132 \tabularnewline
39 & 0.150659 & 0.301319 & 0.849341 \tabularnewline
40 & 0.100774 & 0.201549 & 0.899226 \tabularnewline
41 & 0.0679991 & 0.135998 & 0.932001 \tabularnewline
42 & 0.0542313 & 0.108463 & 0.945769 \tabularnewline
43 & 0.318863 & 0.637727 & 0.681137 \tabularnewline
44 & 0.326832 & 0.653664 & 0.673168 \tabularnewline
45 & 0.988365 & 0.0232691 & 0.0116346 \tabularnewline
\hline
\end{tabular}
%Source: https://freestatistics.org/blog/index.php?pk=268255&T=5

[TABLE]
[ROW][C]Goldfeld-Quandt test for Heteroskedasticity[/C][/ROW]
[ROW][C]p-values[/C][C]Alternative Hypothesis[/C][/ROW]
[ROW][C]breakpoint index[/C][C]greater[/C][C]2-sided[/C][C]less[/C][/ROW]
[ROW][C]7[/C][C]0.0628245[/C][C]0.125649[/C][C]0.937175[/C][/ROW]
[ROW][C]8[/C][C]0.169583[/C][C]0.339166[/C][C]0.830417[/C][/ROW]
[ROW][C]9[/C][C]0.498986[/C][C]0.997973[/C][C]0.501014[/C][/ROW]
[ROW][C]10[/C][C]0.452913[/C][C]0.905826[/C][C]0.547087[/C][/ROW]
[ROW][C]11[/C][C]0.341706[/C][C]0.683413[/C][C]0.658294[/C][/ROW]
[ROW][C]12[/C][C]0.54894[/C][C]0.90212[/C][C]0.45106[/C][/ROW]
[ROW][C]13[/C][C]0.515083[/C][C]0.969835[/C][C]0.484917[/C][/ROW]
[ROW][C]14[/C][C]0.539873[/C][C]0.920254[/C][C]0.460127[/C][/ROW]
[ROW][C]15[/C][C]0.448324[/C][C]0.896648[/C][C]0.551676[/C][/ROW]
[ROW][C]16[/C][C]0.387256[/C][C]0.774512[/C][C]0.612744[/C][/ROW]
[ROW][C]17[/C][C]0.367834[/C][C]0.735669[/C][C]0.632166[/C][/ROW]
[ROW][C]18[/C][C]0.310667[/C][C]0.621334[/C][C]0.689333[/C][/ROW]
[ROW][C]19[/C][C]0.269049[/C][C]0.538098[/C][C]0.730951[/C][/ROW]
[ROW][C]20[/C][C]0.256364[/C][C]0.512728[/C][C]0.743636[/C][/ROW]
[ROW][C]21[/C][C]0.248304[/C][C]0.496607[/C][C]0.751696[/C][/ROW]
[ROW][C]22[/C][C]0.197424[/C][C]0.394848[/C][C]0.802576[/C][/ROW]
[ROW][C]23[/C][C]0.188672[/C][C]0.377345[/C][C]0.811328[/C][/ROW]
[ROW][C]24[/C][C]0.339335[/C][C]0.67867[/C][C]0.660665[/C][/ROW]
[ROW][C]25[/C][C]0.271231[/C][C]0.542462[/C][C]0.728769[/C][/ROW]
[ROW][C]26[/C][C]0.214051[/C][C]0.428102[/C][C]0.785949[/C][/ROW]
[ROW][C]27[/C][C]0.335141[/C][C]0.670282[/C][C]0.664859[/C][/ROW]
[ROW][C]28[/C][C]0.333899[/C][C]0.667798[/C][C]0.666101[/C][/ROW]
[ROW][C]29[/C][C]0.26112[/C][C]0.52224[/C][C]0.73888[/C][/ROW]
[ROW][C]30[/C][C]0.196737[/C][C]0.393475[/C][C]0.803263[/C][/ROW]
[ROW][C]31[/C][C]0.182116[/C][C]0.364232[/C][C]0.817884[/C][/ROW]
[ROW][C]32[/C][C]0.153413[/C][C]0.306826[/C][C]0.846587[/C][/ROW]
[ROW][C]33[/C][C]0.11145[/C][C]0.222901[/C][C]0.88855[/C][/ROW]
[ROW][C]34[/C][C]0.173509[/C][C]0.347017[/C][C]0.826491[/C][/ROW]
[ROW][C]35[/C][C]0.164209[/C][C]0.328418[/C][C]0.835791[/C][/ROW]
[ROW][C]36[/C][C]0.129265[/C][C]0.258529[/C][C]0.870735[/C][/ROW]
[ROW][C]37[/C][C]0.14447[/C][C]0.28894[/C][C]0.85553[/C][/ROW]
[ROW][C]38[/C][C]0.109868[/C][C]0.219737[/C][C]0.890132[/C][/ROW]
[ROW][C]39[/C][C]0.150659[/C][C]0.301319[/C][C]0.849341[/C][/ROW]
[ROW][C]40[/C][C]0.100774[/C][C]0.201549[/C][C]0.899226[/C][/ROW]
[ROW][C]41[/C][C]0.0679991[/C][C]0.135998[/C][C]0.932001[/C][/ROW]
[ROW][C]42[/C][C]0.0542313[/C][C]0.108463[/C][C]0.945769[/C][/ROW]
[ROW][C]43[/C][C]0.318863[/C][C]0.637727[/C][C]0.681137[/C][/ROW]
[ROW][C]44[/C][C]0.326832[/C][C]0.653664[/C][C]0.673168[/C][/ROW]
[ROW][C]45[/C][C]0.988365[/C][C]0.0232691[/C][C]0.0116346[/C][/ROW]
[/TABLE]
Source: https://freestatistics.org/blog/index.php?pk=268255&T=5

Globally Unique Identifier (entire table): ba.freestatistics.org/blog/index.php?pk=268255&T=5

As an alternative you can also use a QR Code:  

The GUIDs for individual cells are displayed in the table below:

Goldfeld-Quandt test for Heteroskedasticity
p-valuesAlternative Hypothesis
breakpoint indexgreater2-sidedless
70.06282450.1256490.937175
80.1695830.3391660.830417
90.4989860.9979730.501014
100.4529130.9058260.547087
110.3417060.6834130.658294
120.548940.902120.45106
130.5150830.9698350.484917
140.5398730.9202540.460127
150.4483240.8966480.551676
160.3872560.7745120.612744
170.3678340.7356690.632166
180.3106670.6213340.689333
190.2690490.5380980.730951
200.2563640.5127280.743636
210.2483040.4966070.751696
220.1974240.3948480.802576
230.1886720.3773450.811328
240.3393350.678670.660665
250.2712310.5424620.728769
260.2140510.4281020.785949
270.3351410.6702820.664859
280.3338990.6677980.666101
290.261120.522240.73888
300.1967370.3934750.803263
310.1821160.3642320.817884
320.1534130.3068260.846587
330.111450.2229010.88855
340.1735090.3470170.826491
350.1642090.3284180.835791
360.1292650.2585290.870735
370.144470.288940.85553
380.1098680.2197370.890132
390.1506590.3013190.849341
400.1007740.2015490.899226
410.06799910.1359980.932001
420.05423130.1084630.945769
430.3188630.6377270.681137
440.3268320.6536640.673168
450.9883650.02326910.0116346


Meta Analysis of Goldfeld-Quandt test for Heteroskedasticity
Description# significant tests% significant testsOK/NOK
1% type I error level00OK
5% type I error level10.025641OK
10% type I error level10.025641OK

\begin{tabular}{lllllllll}
\hline
Meta Analysis of Goldfeld-Quandt test for Heteroskedasticity \tabularnewline
Description & # significant tests & % significant tests & OK/NOK \tabularnewline
1% type I error level & 0 & 0 & OK \tabularnewline
5% type I error level & 1 & 0.025641 & OK \tabularnewline
10% type I error level & 1 & 0.025641 & OK \tabularnewline
\hline
\end{tabular}
%Source: https://freestatistics.org/blog/index.php?pk=268255&T=6

[TABLE]
[ROW][C]Meta Analysis of Goldfeld-Quandt test for Heteroskedasticity[/C][/ROW]
[ROW][C]Description[/C][C]# significant tests[/C][C]% significant tests[/C][C]OK/NOK[/C][/ROW]
[ROW][C]1% type I error level[/C][C]0[/C][C]0[/C][C]OK[/C][/ROW]
[ROW][C]5% type I error level[/C][C]1[/C][C]0.025641[/C][C]OK[/C][/ROW]
[ROW][C]10% type I error level[/C][C]1[/C][C]0.025641[/C][C]OK[/C][/ROW]
[/TABLE]
Source: https://freestatistics.org/blog/index.php?pk=268255&T=6

Globally Unique Identifier (entire table): ba.freestatistics.org/blog/index.php?pk=268255&T=6

As an alternative you can also use a QR Code:  

The GUIDs for individual cells are displayed in the table below:

Meta Analysis of Goldfeld-Quandt test for Heteroskedasticity
Description# significant tests% significant testsOK/NOK
1% type I error level00OK
5% type I error level10.025641OK
10% type I error level10.025641OK


Parameters (Session):
par1 = 1 ; par2 = 2 ; par3 = Pearson Chi-Squared ;
Parameters (R input):
par1 = 4 ; par2 = Do not include Seasonal Dummies ; par3 = No Linear Trend ;
R code (references can be found in the software module):
library(lattice)
library(lmtest)
n25 <- 25 #minimum number of obs. for Goldfeld-Quandt test
par1 <- as.numeric(par1)
x <- t(y)
k <- length(x[1,])
n <- length(x[,1])
x1 <- cbind(x[,par1], x[,1:k!=par1])
mycolnames <- c(colnames(x)[par1], colnames(x)[1:k!=par1])
colnames(x1) <- mycolnames #colnames(x)[par1]
x <- x1
if (par3 == 'First Differences'){
x2 <- array(0, dim=c(n-1,k), dimnames=list(1:(n-1), paste('(1-B)',colnames(x),sep='')))
for (i in 1:n-1) {
for (j in 1:k) {
x2[i,j] <- x[i+1,j] - x[i,j]
}
}
x <- x2
}
if (par2 == 'Include Monthly Dummies'){
x2 <- array(0, dim=c(n,11), dimnames=list(1:n, paste('M', seq(1:11), sep ='')))
for (i in 1:11){
x2[seq(i,n,12),i] <- 1
}
x <- cbind(x, x2)
}
if (par2 == 'Include Quarterly Dummies'){
x2 <- array(0, dim=c(n,3), dimnames=list(1:n, paste('Q', seq(1:3), sep ='')))
for (i in 1:3){
x2[seq(i,n,4),i] <- 1
}
x <- cbind(x, x2)
}
k <- length(x[1,])
if (par3 == 'Linear Trend'){
x <- cbind(x, c(1:n))
colnames(x)[k+1] <- 't'
}
x
k <- length(x[1,])
df <- as.data.frame(x)
(mylm <- lm(df))
(mysum <- summary(mylm))
if (n > n25) {
kp3 <- k + 3
nmkm3 <- n - k - 3
gqarr <- array(NA, dim=c(nmkm3-kp3+1,3))
numgqtests <- 0
numsignificant1 <- 0
numsignificant5 <- 0
numsignificant10 <- 0
for (mypoint in kp3:nmkm3) {
j <- 0
numgqtests <- numgqtests + 1
for (myalt in c('greater', 'two.sided', 'less')) {
j <- j + 1
gqarr[mypoint-kp3+1,j] <- gqtest(mylm, point=mypoint, alternative=myalt)$p.value
}
if (gqarr[mypoint-kp3+1,2] < 0.01) numsignificant1 <- numsignificant1 + 1
if (gqarr[mypoint-kp3+1,2] < 0.05) numsignificant5 <- numsignificant5 + 1
if (gqarr[mypoint-kp3+1,2] < 0.10) numsignificant10 <- numsignificant10 + 1
}
gqarr
}
bitmap(file='test0.png')
plot(x[,1], type='l', main='Actuals and Interpolation', ylab='value of Actuals and Interpolation (dots)', xlab='time or index')
points(x[,1]-mysum$resid)
grid()
dev.off()
bitmap(file='test1.png')
plot(mysum$resid, type='b', pch=19, main='Residuals', ylab='value of Residuals', xlab='time or index')
grid()
dev.off()
bitmap(file='test2.png')
hist(mysum$resid, main='Residual Histogram', xlab='values of Residuals')
grid()
dev.off()
bitmap(file='test3.png')
densityplot(~mysum$resid,col='black',main='Residual Density Plot', xlab='values of Residuals')
dev.off()
bitmap(file='test4.png')
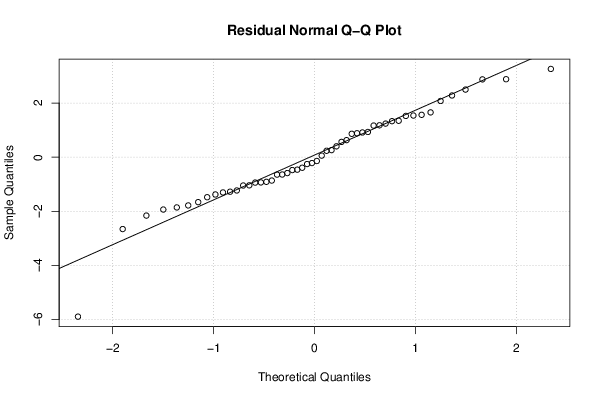
qqnorm(mysum$resid, main='Residual Normal Q-Q Plot')
qqline(mysum$resid)
grid()
dev.off()
(myerror <- as.ts(mysum$resid))
bitmap(file='test5.png')
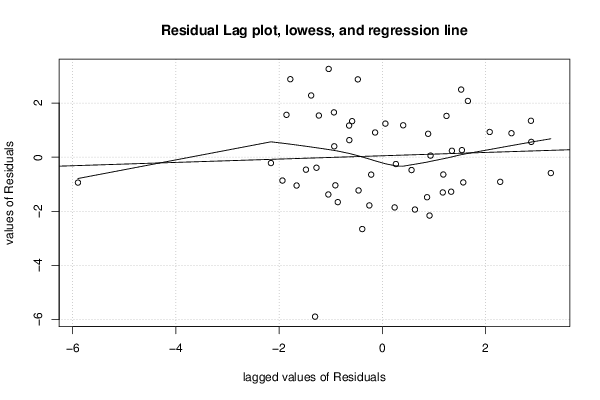
dum <- cbind(lag(myerror,k=1),myerror)
dum
dum1 <- dum[2:length(myerror),]
dum1
z <- as.data.frame(dum1)
z
plot(z,main=paste('Residual Lag plot, lowess, and regression line'), ylab='values of Residuals', xlab='lagged values of Residuals')
lines(lowess(z))
abline(lm(z))
grid()
dev.off()
bitmap(file='test6.png')
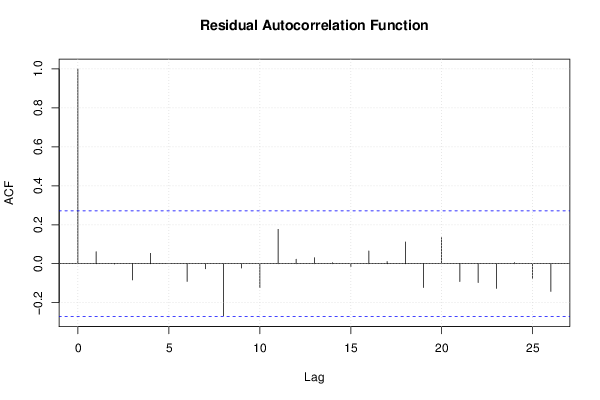
acf(mysum$resid, lag.max=length(mysum$resid)/2, main='Residual Autocorrelation Function')
grid()
dev.off()
bitmap(file='test7.png')
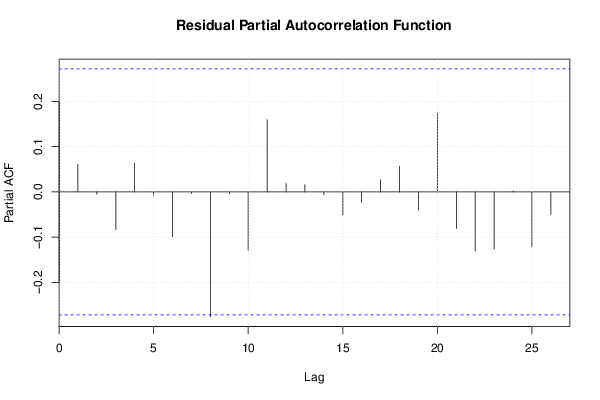
pacf(mysum$resid, lag.max=length(mysum$resid)/2, main='Residual Partial Autocorrelation Function')
grid()
dev.off()
bitmap(file='test8.png')
opar <- par(mfrow = c(2,2), oma = c(0, 0, 1.1, 0))
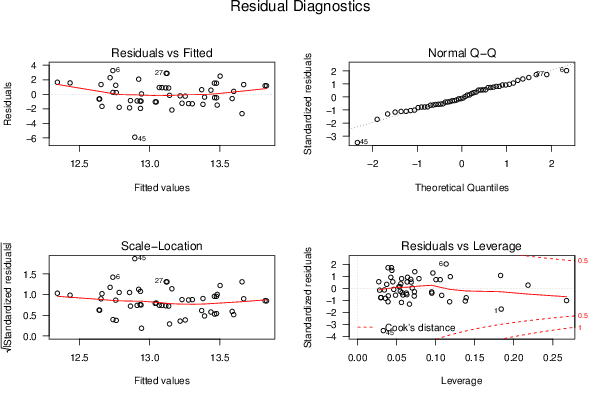
plot(mylm, las = 1, sub='Residual Diagnostics')
par(opar)
dev.off()
if (n > n25) {
bitmap(file='test9.png')
plot(kp3:nmkm3,gqarr[,2], main='Goldfeld-Quandt test',ylab='2-sided p-value',xlab='breakpoint')
grid()
dev.off()
}
load(file='createtable')
a<-table.start()
a<-table.row.start(a)
a<-table.element(a, 'Multiple Linear Regression - Estimated Regression Equation', 1, TRUE)
a<-table.row.end(a)
myeq <- colnames(x)[1]
myeq <- paste(myeq, '[t] = ', sep='')
for (i in 1:k){
if (mysum$coefficients[i,1] > 0) myeq <- paste(myeq, '+', '')
myeq <- paste(myeq, signif(mysum$coefficients[i,1],6), sep=' ')
if (rownames(mysum$coefficients)[i] != '(Intercept)') {
myeq <- paste(myeq, rownames(mysum$coefficients)[i], sep='')
if (rownames(mysum$coefficients)[i] != 't') myeq <- paste(myeq, '[t]', sep='')
}
}
myeq <- paste(myeq, ' + e[t]')
a<-table.row.start(a)
a<-table.element(a, myeq)
a<-table.row.end(a)
a<-table.end(a)
table.save(a,file='mytable1.tab')
a<-table.start()
a<-table.row.start(a)
a<-table.element(a,hyperlink('ols1.htm','Multiple Linear Regression - Ordinary Least Squares',''), 6, TRUE)
a<-table.row.end(a)
a<-table.row.start(a)
a<-table.element(a,'Variable',header=TRUE)
a<-table.element(a,'Parameter',header=TRUE)
a<-table.element(a,'S.D.',header=TRUE)
a<-table.element(a,'T-STAT
H0: parameter = 0',header=TRUE)
a<-table.element(a,'2-tail p-value',header=TRUE)
a<-table.element(a,'1-tail p-value',header=TRUE)
a<-table.row.end(a)
for (i in 1:k){
a<-table.row.start(a)
a<-table.element(a,rownames(mysum$coefficients)[i],header=TRUE)
a<-table.element(a,signif(mysum$coefficients[i,1],6))
a<-table.element(a, signif(mysum$coefficients[i,2],6))
a<-table.element(a, signif(mysum$coefficients[i,3],4))
a<-table.element(a, signif(mysum$coefficients[i,4],6))
a<-table.element(a, signif(mysum$coefficients[i,4]/2,6))
a<-table.row.end(a)
}
a<-table.end(a)
table.save(a,file='mytable2.tab')
a<-table.start()
a<-table.row.start(a)
a<-table.element(a, 'Multiple Linear Regression - Regression Statistics', 2, TRUE)
a<-table.row.end(a)
a<-table.row.start(a)
a<-table.element(a, 'Multiple R',1,TRUE)
a<-table.element(a, signif(sqrt(mysum$r.squared),6))
a<-table.row.end(a)
a<-table.row.start(a)
a<-table.element(a, 'R-squared',1,TRUE)
a<-table.element(a, signif(mysum$r.squared,6))
a<-table.row.end(a)
a<-table.row.start(a)
a<-table.element(a, 'Adjusted R-squared',1,TRUE)
a<-table.element(a, signif(mysum$adj.r.squared,6))
a<-table.row.end(a)
a<-table.row.start(a)
a<-table.element(a, 'F-TEST (value)',1,TRUE)
a<-table.element(a, signif(mysum$fstatistic[1],6))
a<-table.row.end(a)
a<-table.row.start(a)
a<-table.element(a, 'F-TEST (DF numerator)',1,TRUE)
a<-table.element(a, signif(mysum$fstatistic[2],6))
a<-table.row.end(a)
a<-table.row.start(a)
a<-table.element(a, 'F-TEST (DF denominator)',1,TRUE)
a<-table.element(a, signif(mysum$fstatistic[3],6))
a<-table.row.end(a)
a<-table.row.start(a)
a<-table.element(a, 'p-value',1,TRUE)
a<-table.element(a, signif(1-pf(mysum$fstatistic[1],mysum$fstatistic[2],mysum$fstatistic[3]),6))
a<-table.row.end(a)
a<-table.row.start(a)
a<-table.element(a, 'Multiple Linear Regression - Residual Statistics', 2, TRUE)
a<-table.row.end(a)
a<-table.row.start(a)
a<-table.element(a, 'Residual Standard Deviation',1,TRUE)
a<-table.element(a, signif(mysum$sigma,6))
a<-table.row.end(a)
a<-table.row.start(a)
a<-table.element(a, 'Sum Squared Residuals',1,TRUE)
a<-table.element(a, signif(sum(myerror*myerror),6))
a<-table.row.end(a)
a<-table.end(a)
table.save(a,file='mytable3.tab')
a<-table.start()
a<-table.row.start(a)
a<-table.element(a, 'Multiple Linear Regression - Actuals, Interpolation, and Residuals', 4, TRUE)
a<-table.row.end(a)
a<-table.row.start(a)
a<-table.element(a, 'Time or Index', 1, TRUE)
a<-table.element(a, 'Actuals', 1, TRUE)
a<-table.element(a, 'Interpolation
Forecast', 1, TRUE)
a<-table.element(a, 'Residuals
Prediction Error', 1, TRUE)
a<-table.row.end(a)
for (i in 1:n) {
a<-table.row.start(a)
a<-table.element(a,i, 1, TRUE)
a<-table.element(a,signif(x[i],6))
a<-table.element(a,signif(x[i]-mysum$resid[i],6))
a<-table.element(a,signif(mysum$resid[i],6))
a<-table.row.end(a)
}
a<-table.end(a)
table.save(a,file='mytable4.tab')
if (n > n25) {
a<-table.start()
a<-table.row.start(a)
a<-table.element(a,'Goldfeld-Quandt test for Heteroskedasticity',4,TRUE)
a<-table.row.end(a)
a<-table.row.start(a)
a<-table.element(a,'p-values',header=TRUE)
a<-table.element(a,'Alternative Hypothesis',3,header=TRUE)
a<-table.row.end(a)
a<-table.row.start(a)
a<-table.element(a,'breakpoint index',header=TRUE)
a<-table.element(a,'greater',header=TRUE)
a<-table.element(a,'2-sided',header=TRUE)
a<-table.element(a,'less',header=TRUE)
a<-table.row.end(a)
for (mypoint in kp3:nmkm3) {
a<-table.row.start(a)
a<-table.element(a,mypoint,header=TRUE)
a<-table.element(a,signif(gqarr[mypoint-kp3+1,1],6))
a<-table.element(a,signif(gqarr[mypoint-kp3+1,2],6))
a<-table.element(a,signif(gqarr[mypoint-kp3+1,3],6))
a<-table.row.end(a)
}
a<-table.end(a)
table.save(a,file='mytable5.tab')
a<-table.start()
a<-table.row.start(a)
a<-table.element(a,'Meta Analysis of Goldfeld-Quandt test for Heteroskedasticity',4,TRUE)
a<-table.row.end(a)
a<-table.row.start(a)
a<-table.element(a,'Description',header=TRUE)
a<-table.element(a,'# significant tests',header=TRUE)
a<-table.element(a,'% significant tests',header=TRUE)
a<-table.element(a,'OK/NOK',header=TRUE)
a<-table.row.end(a)
a<-table.row.start(a)
a<-table.element(a,'1% type I error level',header=TRUE)
a<-table.element(a,signif(numsignificant1,6))
a<-table.element(a,signif(numsignificant1/numgqtests,6))
if (numsignificant1/numgqtests < 0.01) dum <- 'OK' else dum <- 'NOK'
a<-table.element(a,dum)
a<-table.row.end(a)
a<-table.row.start(a)
a<-table.element(a,'5% type I error level',header=TRUE)
a<-table.element(a,signif(numsignificant5,6))
a<-table.element(a,signif(numsignificant5/numgqtests,6))
if (numsignificant5/numgqtests < 0.05) dum <- 'OK' else dum <- 'NOK'
a<-table.element(a,dum)
a<-table.row.end(a)
a<-table.row.start(a)
a<-table.element(a,'10% type I error level',header=TRUE)
a<-table.element(a,signif(numsignificant10,6))
a<-table.element(a,signif(numsignificant10/numgqtests,6))
if (numsignificant10/numgqtests < 0.1) dum <- 'OK' else dum <- 'NOK'
a<-table.element(a,dum)
a<-table.row.end(a)
a<-table.end(a)
table.save(a,file='mytable6.tab')
}