Free Statistics

of Irreproducible Research!

Author's title

Author*The author of this computation has been verified*
R Software Modulerwasp_multipleregression.wasp
Title produced by softwareMultiple Regression
Date of computationMon, 15 Dec 2014 12:40:40 +0000
Cite this page as followsStatistical Computations at FreeStatistics.org, Office for Research Development and Education, URL https://freestatistics.org/blog/index.php?v=date/2014/Dec/15/t14186473220azi8kiy11cui2m.htm/, Retrieved Thu, 16 May 2024 17:33:35 +0000
Statistical Computations at FreeStatistics.org, Office for Research Development and Education, URL https://freestatistics.org/blog/index.php?pk=268263, Retrieved Thu, 16 May 2024 17:33:35 +0000
QR Codes:

Original text written by user:
IsPrivate?No (this computation is public)
User-defined keywords
Estimated Impact64
Family? (F = Feedback message, R = changed R code, M = changed R Module, P = changed Parameters, D = changed Data)
-       [Multiple Regression] [] [2014-12-15 12:40:40] [624214a256768d6065ce8a528542dcc5] [Current]
Feedback Forum

Post a new message
Dataseries X:
12,2	57	62	8	8	13
7,4	67	71	16	13	14
6,7	43	54	14	11	15
12,6	52	65	13	10	14
13,3	43	52	13	10	13
11,1	84	84	20	15	16
8,2	67	42	17	12	14
11,4	49	66	15	12	14
6,4	70	65	16	10	15
10,6	52	78	12	10	15
11,9	43	66	16	14	12
9,6	56	61	13	8	13
6,4	65	71	19	15	15
13,8	63	69	16	13	15
13,8	57	72	10	12	14
11,7	63	68	15	7	12
10,9	53	70	14	11	12
16,1	57	68	14	7	12
9,9	64	67	15	12	14
9	58	72	15	12	14
9,7	43	69	16	15	16
10,8	51	71	16	12	15
10,3	53	62	10	6	12
12,7	56	64	17	13	13
9,3	61	58	14	11	14
5,9	39	52	14	12	12
11,4	48	59	12	10	14
13	50	68	16	6	15
10,8	35	76	16	12	13
12,3	30	65	16	11	16
11,8	49	59	16	12	12
7,9	61	69	15	12	12
12,3	47	63	13	10	12
11,6	56	75	14	11	15
6,7	50	63	13	7	12
10,9	43	60	16	12	13
12,1	67	73	19	13	12
13,3	62	63	19	14	14
10,1	57	70	14	12	14
14,3	54	66	13	14	10
13,3	48	63	16	12	11
9,3	61	64	15	11	16
15,9	43	61	16	12	15
9,1	44	62	12	12	14
13	58	61	14	10	11
14,5	46	66	13	10	16
14,6	66	56	9	10	14
12,6	38	59	12	12	12
7,7	53	71	16	12	15
4,3	59	71	13	10	16
11,8	58	64	16	11	14
11,2	60	66	16	12	16
12,6	52	62	12	6	15
5,6	34	65	12	9	12
9,9	69	68	19	15	13
7,7	48	60	13	11	14
7,3	58	65	15	12	16
11,4	57	68	12	12	15
13,6	42	64	8	11	14
7,9	64	74	10	9	13
10,7	58	69	16	11	14
8,3	26	68	10	12	14
9,6	61	72	18	14	12
14,2	52	67	12	8	7
11,1	61	66	7	11	13


Summary of computational transaction
Raw Inputview raw input (R code)
Raw Outputview raw output of R engine
Computing time5 seconds
R Server'George Udny Yule' @ yule.wessa.net

\begin{tabular}{lllllllll}
\hline
Summary of computational transaction \tabularnewline
Raw Input & view raw input (R code)  \tabularnewline
Raw Output & view raw output of R engine  \tabularnewline
Computing time & 5 seconds \tabularnewline
R Server & 'George Udny Yule' @ yule.wessa.net \tabularnewline
\hline
\end{tabular}
%Source: https://freestatistics.org/blog/index.php?pk=268263&T=0

[TABLE]
[ROW][C]Summary of computational transaction[/C][/ROW]
[ROW][C]Raw Input[/C][C]view raw input (R code) [/C][/ROW]
[ROW][C]Raw Output[/C][C]view raw output of R engine [/C][/ROW]
[ROW][C]Computing time[/C][C]5 seconds[/C][/ROW]
[ROW][C]R Server[/C][C]'George Udny Yule' @ yule.wessa.net[/C][/ROW]
[/TABLE]
Source: https://freestatistics.org/blog/index.php?pk=268263&T=0

Globally Unique Identifier (entire table): ba.freestatistics.org/blog/index.php?pk=268263&T=0

As an alternative you can also use a QR Code:  

The GUIDs for individual cells are displayed in the table below:

Summary of computational transaction
Raw Inputview raw input (R code)
Raw Outputview raw output of R engine
Computing time5 seconds
R Server'George Udny Yule' @ yule.wessa.net


Multiple Linear Regression - Estimated Regression Equation
TOT.M[t] = + 15.3054 -0.007782AMS.I.M[t] + 0.0179805AMS.E.M[t] -0.0352272CONFSTAT.M[t] -0.0551173CONFSOFT.M[t] -0.310644STRESS.M[t] + e[t]

\begin{tabular}{lllllllll}
\hline
Multiple Linear Regression - Estimated Regression Equation \tabularnewline
TOT.M[t] =  +  15.3054 -0.007782AMS.I.M[t] +  0.0179805AMS.E.M[t] -0.0352272CONFSTAT.M[t] -0.0551173CONFSOFT.M[t] -0.310644STRESS.M[t]  + e[t] \tabularnewline
\hline
\end{tabular}
%Source: https://freestatistics.org/blog/index.php?pk=268263&T=1

[TABLE]
[ROW][C]Multiple Linear Regression - Estimated Regression Equation[/C][/ROW]
[ROW][C]TOT.M[t] =  +  15.3054 -0.007782AMS.I.M[t] +  0.0179805AMS.E.M[t] -0.0352272CONFSTAT.M[t] -0.0551173CONFSOFT.M[t] -0.310644STRESS.M[t]  + e[t][/C][/ROW]
[/TABLE]
Source: https://freestatistics.org/blog/index.php?pk=268263&T=1

Globally Unique Identifier (entire table): ba.freestatistics.org/blog/index.php?pk=268263&T=1

As an alternative you can also use a QR Code:  

The GUIDs for individual cells are displayed in the table below:

Multiple Linear Regression - Estimated Regression Equation
TOT.M[t] = + 15.3054 -0.007782AMS.I.M[t] + 0.0179805AMS.E.M[t] -0.0352272CONFSTAT.M[t] -0.0551173CONFSOFT.M[t] -0.310644STRESS.M[t] + e[t]


Multiple Linear Regression - Ordinary Least Squares
VariableParameterS.D.T-STATH0: parameter = 02-tail p-value1-tail p-value
(Intercept)15.30544.133643.7030.0004715180.000235759
AMS.I.M-0.0077820.0346891-0.22430.8232710.411636
AMS.E.M0.01798050.05380450.33420.7394270.369714
CONFSTAT.M-0.03522720.147939-0.23810.8126130.406307
CONFSOFT.M-0.05511730.18311-0.3010.7644680.382234
STRESS.M-0.3106440.20372-1.5250.1326370.0663187

\begin{tabular}{lllllllll}
\hline
Multiple Linear Regression - Ordinary Least Squares \tabularnewline
Variable & Parameter & S.D. & T-STATH0: parameter = 0 & 2-tail p-value & 1-tail p-value \tabularnewline
(Intercept) & 15.3054 & 4.13364 & 3.703 & 0.000471518 & 0.000235759 \tabularnewline
AMS.I.M & -0.007782 & 0.0346891 & -0.2243 & 0.823271 & 0.411636 \tabularnewline
AMS.E.M & 0.0179805 & 0.0538045 & 0.3342 & 0.739427 & 0.369714 \tabularnewline
CONFSTAT.M & -0.0352272 & 0.147939 & -0.2381 & 0.812613 & 0.406307 \tabularnewline
CONFSOFT.M & -0.0551173 & 0.18311 & -0.301 & 0.764468 & 0.382234 \tabularnewline
STRESS.M & -0.310644 & 0.20372 & -1.525 & 0.132637 & 0.0663187 \tabularnewline
\hline
\end{tabular}
%Source: https://freestatistics.org/blog/index.php?pk=268263&T=2

[TABLE]
[ROW][C]Multiple Linear Regression - Ordinary Least Squares[/C][/ROW]
[ROW][C]Variable[/C][C]Parameter[/C][C]S.D.[/C][C]T-STATH0: parameter = 0[/C][C]2-tail p-value[/C][C]1-tail p-value[/C][/ROW]
[ROW][C](Intercept)[/C][C]15.3054[/C][C]4.13364[/C][C]3.703[/C][C]0.000471518[/C][C]0.000235759[/C][/ROW]
[ROW][C]AMS.I.M[/C][C]-0.007782[/C][C]0.0346891[/C][C]-0.2243[/C][C]0.823271[/C][C]0.411636[/C][/ROW]
[ROW][C]AMS.E.M[/C][C]0.0179805[/C][C]0.0538045[/C][C]0.3342[/C][C]0.739427[/C][C]0.369714[/C][/ROW]
[ROW][C]CONFSTAT.M[/C][C]-0.0352272[/C][C]0.147939[/C][C]-0.2381[/C][C]0.812613[/C][C]0.406307[/C][/ROW]
[ROW][C]CONFSOFT.M[/C][C]-0.0551173[/C][C]0.18311[/C][C]-0.301[/C][C]0.764468[/C][C]0.382234[/C][/ROW]
[ROW][C]STRESS.M[/C][C]-0.310644[/C][C]0.20372[/C][C]-1.525[/C][C]0.132637[/C][C]0.0663187[/C][/ROW]
[/TABLE]
Source: https://freestatistics.org/blog/index.php?pk=268263&T=2

Globally Unique Identifier (entire table): ba.freestatistics.org/blog/index.php?pk=268263&T=2

As an alternative you can also use a QR Code:  

The GUIDs for individual cells are displayed in the table below:

Multiple Linear Regression - Ordinary Least Squares
VariableParameterS.D.T-STATH0: parameter = 02-tail p-value1-tail p-value
(Intercept)15.30544.133643.7030.0004715180.000235759
AMS.I.M-0.0077820.0346891-0.22430.8232710.411636
AMS.E.M0.01798050.05380450.33420.7394270.369714
CONFSTAT.M-0.03522720.147939-0.23810.8126130.406307
CONFSOFT.M-0.05511730.18311-0.3010.7644680.382234
STRESS.M-0.3106440.20372-1.5250.1326370.0663187


Multiple Linear Regression - Regression Statistics
Multiple R0.225638
R-squared0.0509125
Adjusted R-squared-0.0295187
F-TEST (value)0.632995
F-TEST (DF numerator)5
F-TEST (DF denominator)59
p-value0.67529
Multiple Linear Regression - Residual Statistics
Residual Standard Deviation2.67008
Sum Squared Residuals420.63

\begin{tabular}{lllllllll}
\hline
Multiple Linear Regression - Regression Statistics \tabularnewline
Multiple R & 0.225638 \tabularnewline
R-squared & 0.0509125 \tabularnewline
Adjusted R-squared & -0.0295187 \tabularnewline
F-TEST (value) & 0.632995 \tabularnewline
F-TEST (DF numerator) & 5 \tabularnewline
F-TEST (DF denominator) & 59 \tabularnewline
p-value & 0.67529 \tabularnewline
Multiple Linear Regression - Residual Statistics \tabularnewline
Residual Standard Deviation & 2.67008 \tabularnewline
Sum Squared Residuals & 420.63 \tabularnewline
\hline
\end{tabular}
%Source: https://freestatistics.org/blog/index.php?pk=268263&T=3

[TABLE]
[ROW][C]Multiple Linear Regression - Regression Statistics[/C][/ROW]
[ROW][C]Multiple R[/C][C]0.225638[/C][/ROW]
[ROW][C]R-squared[/C][C]0.0509125[/C][/ROW]
[ROW][C]Adjusted R-squared[/C][C]-0.0295187[/C][/ROW]
[ROW][C]F-TEST (value)[/C][C]0.632995[/C][/ROW]
[ROW][C]F-TEST (DF numerator)[/C][C]5[/C][/ROW]
[ROW][C]F-TEST (DF denominator)[/C][C]59[/C][/ROW]
[ROW][C]p-value[/C][C]0.67529[/C][/ROW]
[ROW][C]Multiple Linear Regression - Residual Statistics[/C][/ROW]
[ROW][C]Residual Standard Deviation[/C][C]2.67008[/C][/ROW]
[ROW][C]Sum Squared Residuals[/C][C]420.63[/C][/ROW]
[/TABLE]
Source: https://freestatistics.org/blog/index.php?pk=268263&T=3

Globally Unique Identifier (entire table): ba.freestatistics.org/blog/index.php?pk=268263&T=3

As an alternative you can also use a QR Code:  

The GUIDs for individual cells are displayed in the table below:

Multiple Linear Regression - Regression Statistics
Multiple R0.225638
R-squared0.0509125
Adjusted R-squared-0.0295187
F-TEST (value)0.632995
F-TEST (DF numerator)5
F-TEST (DF denominator)59
p-value0.67529
Multiple Linear Regression - Residual Statistics
Residual Standard Deviation2.67008
Sum Squared Residuals420.63


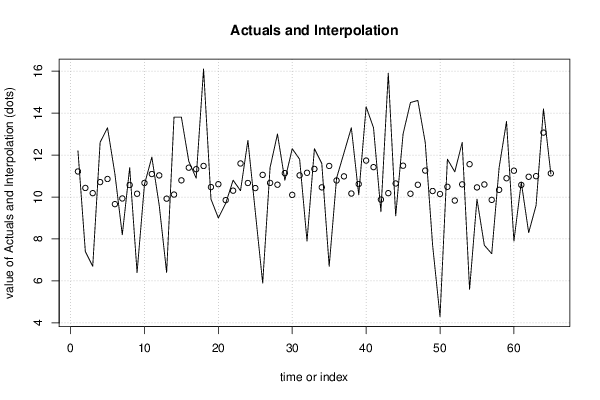
Multiple Linear Regression - Actuals, Interpolation, and Residuals
Time or IndexActualsInterpolationForecastResidualsPrediction Error
112.211.21550.984473
27.410.4315-3.03148
36.710.1826-3.48263
412.610.71141.88864
513.310.85832.4417
611.19.66051.4395
78.29.92994-1.72994
811.410.5720.827998
96.410.155-3.75496
1010.610.6697-0.069694
1111.911.09450.80548
129.611.0292-1.42919
136.49.92049-3.52049
1413.810.1163.68399
1513.810.79383.00624
1611.711.39590.30411
1710.911.3244-0.424429
1816.111.47784.62219
199.910.4733-0.573252
20910.6098-1.60985
219.79.85077-0.150768
2210.810.30050.499531
2310.311.5971-1.29708
2412.710.66662.03336
259.310.4251-1.12512
265.911.0546-5.15461
2711.410.66980.730164
281310.5852.41499
2910.811.1362-0.336172
3012.310.10052.19952
3111.811.03220.767801
327.911.1538-3.25385
3312.311.33560.964398
3411.610.45911.14095
356.711.4776-4.77761
3610.910.78620.113772
3712.110.98311.11695
3813.310.16583.13425
3910.110.6169-0.516895
4014.311.73592.56411
4113.311.42251.87745
429.39.87649-0.576485
4315.910.18295.71708
449.110.6447-1.54467
451311.48951.51054
4614.510.15474.34525
4714.610.58154.0185
4812.611.25871.34129
497.710.2849-2.5849
504.310.1435-5.84348
5111.810.48591.31411
5211.29.829881.37012
5312.610.60251.99753
545.611.5631-5.96307
559.910.4567-0.556706
567.710.5975-2.89747
577.39.86269-2.56269
5811.410.34071.05926
5913.610.89222.70778
607.911.2512-3.35125
6110.710.57580.124205
628.310.9631-2.66308
639.610.9919-1.39187
6414.213.06731.1327
6511.111.1262-0.0261967

\begin{tabular}{lllllllll}
\hline
Multiple Linear Regression - Actuals, Interpolation, and Residuals \tabularnewline
Time or Index & Actuals & InterpolationForecast & ResidualsPrediction Error \tabularnewline
1 & 12.2 & 11.2155 & 0.984473 \tabularnewline
2 & 7.4 & 10.4315 & -3.03148 \tabularnewline
3 & 6.7 & 10.1826 & -3.48263 \tabularnewline
4 & 12.6 & 10.7114 & 1.88864 \tabularnewline
5 & 13.3 & 10.8583 & 2.4417 \tabularnewline
6 & 11.1 & 9.6605 & 1.4395 \tabularnewline
7 & 8.2 & 9.92994 & -1.72994 \tabularnewline
8 & 11.4 & 10.572 & 0.827998 \tabularnewline
9 & 6.4 & 10.155 & -3.75496 \tabularnewline
10 & 10.6 & 10.6697 & -0.069694 \tabularnewline
11 & 11.9 & 11.0945 & 0.80548 \tabularnewline
12 & 9.6 & 11.0292 & -1.42919 \tabularnewline
13 & 6.4 & 9.92049 & -3.52049 \tabularnewline
14 & 13.8 & 10.116 & 3.68399 \tabularnewline
15 & 13.8 & 10.7938 & 3.00624 \tabularnewline
16 & 11.7 & 11.3959 & 0.30411 \tabularnewline
17 & 10.9 & 11.3244 & -0.424429 \tabularnewline
18 & 16.1 & 11.4778 & 4.62219 \tabularnewline
19 & 9.9 & 10.4733 & -0.573252 \tabularnewline
20 & 9 & 10.6098 & -1.60985 \tabularnewline
21 & 9.7 & 9.85077 & -0.150768 \tabularnewline
22 & 10.8 & 10.3005 & 0.499531 \tabularnewline
23 & 10.3 & 11.5971 & -1.29708 \tabularnewline
24 & 12.7 & 10.6666 & 2.03336 \tabularnewline
25 & 9.3 & 10.4251 & -1.12512 \tabularnewline
26 & 5.9 & 11.0546 & -5.15461 \tabularnewline
27 & 11.4 & 10.6698 & 0.730164 \tabularnewline
28 & 13 & 10.585 & 2.41499 \tabularnewline
29 & 10.8 & 11.1362 & -0.336172 \tabularnewline
30 & 12.3 & 10.1005 & 2.19952 \tabularnewline
31 & 11.8 & 11.0322 & 0.767801 \tabularnewline
32 & 7.9 & 11.1538 & -3.25385 \tabularnewline
33 & 12.3 & 11.3356 & 0.964398 \tabularnewline
34 & 11.6 & 10.4591 & 1.14095 \tabularnewline
35 & 6.7 & 11.4776 & -4.77761 \tabularnewline
36 & 10.9 & 10.7862 & 0.113772 \tabularnewline
37 & 12.1 & 10.9831 & 1.11695 \tabularnewline
38 & 13.3 & 10.1658 & 3.13425 \tabularnewline
39 & 10.1 & 10.6169 & -0.516895 \tabularnewline
40 & 14.3 & 11.7359 & 2.56411 \tabularnewline
41 & 13.3 & 11.4225 & 1.87745 \tabularnewline
42 & 9.3 & 9.87649 & -0.576485 \tabularnewline
43 & 15.9 & 10.1829 & 5.71708 \tabularnewline
44 & 9.1 & 10.6447 & -1.54467 \tabularnewline
45 & 13 & 11.4895 & 1.51054 \tabularnewline
46 & 14.5 & 10.1547 & 4.34525 \tabularnewline
47 & 14.6 & 10.5815 & 4.0185 \tabularnewline
48 & 12.6 & 11.2587 & 1.34129 \tabularnewline
49 & 7.7 & 10.2849 & -2.5849 \tabularnewline
50 & 4.3 & 10.1435 & -5.84348 \tabularnewline
51 & 11.8 & 10.4859 & 1.31411 \tabularnewline
52 & 11.2 & 9.82988 & 1.37012 \tabularnewline
53 & 12.6 & 10.6025 & 1.99753 \tabularnewline
54 & 5.6 & 11.5631 & -5.96307 \tabularnewline
55 & 9.9 & 10.4567 & -0.556706 \tabularnewline
56 & 7.7 & 10.5975 & -2.89747 \tabularnewline
57 & 7.3 & 9.86269 & -2.56269 \tabularnewline
58 & 11.4 & 10.3407 & 1.05926 \tabularnewline
59 & 13.6 & 10.8922 & 2.70778 \tabularnewline
60 & 7.9 & 11.2512 & -3.35125 \tabularnewline
61 & 10.7 & 10.5758 & 0.124205 \tabularnewline
62 & 8.3 & 10.9631 & -2.66308 \tabularnewline
63 & 9.6 & 10.9919 & -1.39187 \tabularnewline
64 & 14.2 & 13.0673 & 1.1327 \tabularnewline
65 & 11.1 & 11.1262 & -0.0261967 \tabularnewline
\hline
\end{tabular}
%Source: https://freestatistics.org/blog/index.php?pk=268263&T=4

[TABLE]
[ROW][C]Multiple Linear Regression - Actuals, Interpolation, and Residuals[/C][/ROW]
[ROW][C]Time or Index[/C][C]Actuals[/C][C]InterpolationForecast[/C][C]ResidualsPrediction Error[/C][/ROW]
[ROW][C]1[/C][C]12.2[/C][C]11.2155[/C][C]0.984473[/C][/ROW]
[ROW][C]2[/C][C]7.4[/C][C]10.4315[/C][C]-3.03148[/C][/ROW]
[ROW][C]3[/C][C]6.7[/C][C]10.1826[/C][C]-3.48263[/C][/ROW]
[ROW][C]4[/C][C]12.6[/C][C]10.7114[/C][C]1.88864[/C][/ROW]
[ROW][C]5[/C][C]13.3[/C][C]10.8583[/C][C]2.4417[/C][/ROW]
[ROW][C]6[/C][C]11.1[/C][C]9.6605[/C][C]1.4395[/C][/ROW]
[ROW][C]7[/C][C]8.2[/C][C]9.92994[/C][C]-1.72994[/C][/ROW]
[ROW][C]8[/C][C]11.4[/C][C]10.572[/C][C]0.827998[/C][/ROW]
[ROW][C]9[/C][C]6.4[/C][C]10.155[/C][C]-3.75496[/C][/ROW]
[ROW][C]10[/C][C]10.6[/C][C]10.6697[/C][C]-0.069694[/C][/ROW]
[ROW][C]11[/C][C]11.9[/C][C]11.0945[/C][C]0.80548[/C][/ROW]
[ROW][C]12[/C][C]9.6[/C][C]11.0292[/C][C]-1.42919[/C][/ROW]
[ROW][C]13[/C][C]6.4[/C][C]9.92049[/C][C]-3.52049[/C][/ROW]
[ROW][C]14[/C][C]13.8[/C][C]10.116[/C][C]3.68399[/C][/ROW]
[ROW][C]15[/C][C]13.8[/C][C]10.7938[/C][C]3.00624[/C][/ROW]
[ROW][C]16[/C][C]11.7[/C][C]11.3959[/C][C]0.30411[/C][/ROW]
[ROW][C]17[/C][C]10.9[/C][C]11.3244[/C][C]-0.424429[/C][/ROW]
[ROW][C]18[/C][C]16.1[/C][C]11.4778[/C][C]4.62219[/C][/ROW]
[ROW][C]19[/C][C]9.9[/C][C]10.4733[/C][C]-0.573252[/C][/ROW]
[ROW][C]20[/C][C]9[/C][C]10.6098[/C][C]-1.60985[/C][/ROW]
[ROW][C]21[/C][C]9.7[/C][C]9.85077[/C][C]-0.150768[/C][/ROW]
[ROW][C]22[/C][C]10.8[/C][C]10.3005[/C][C]0.499531[/C][/ROW]
[ROW][C]23[/C][C]10.3[/C][C]11.5971[/C][C]-1.29708[/C][/ROW]
[ROW][C]24[/C][C]12.7[/C][C]10.6666[/C][C]2.03336[/C][/ROW]
[ROW][C]25[/C][C]9.3[/C][C]10.4251[/C][C]-1.12512[/C][/ROW]
[ROW][C]26[/C][C]5.9[/C][C]11.0546[/C][C]-5.15461[/C][/ROW]
[ROW][C]27[/C][C]11.4[/C][C]10.6698[/C][C]0.730164[/C][/ROW]
[ROW][C]28[/C][C]13[/C][C]10.585[/C][C]2.41499[/C][/ROW]
[ROW][C]29[/C][C]10.8[/C][C]11.1362[/C][C]-0.336172[/C][/ROW]
[ROW][C]30[/C][C]12.3[/C][C]10.1005[/C][C]2.19952[/C][/ROW]
[ROW][C]31[/C][C]11.8[/C][C]11.0322[/C][C]0.767801[/C][/ROW]
[ROW][C]32[/C][C]7.9[/C][C]11.1538[/C][C]-3.25385[/C][/ROW]
[ROW][C]33[/C][C]12.3[/C][C]11.3356[/C][C]0.964398[/C][/ROW]
[ROW][C]34[/C][C]11.6[/C][C]10.4591[/C][C]1.14095[/C][/ROW]
[ROW][C]35[/C][C]6.7[/C][C]11.4776[/C][C]-4.77761[/C][/ROW]
[ROW][C]36[/C][C]10.9[/C][C]10.7862[/C][C]0.113772[/C][/ROW]
[ROW][C]37[/C][C]12.1[/C][C]10.9831[/C][C]1.11695[/C][/ROW]
[ROW][C]38[/C][C]13.3[/C][C]10.1658[/C][C]3.13425[/C][/ROW]
[ROW][C]39[/C][C]10.1[/C][C]10.6169[/C][C]-0.516895[/C][/ROW]
[ROW][C]40[/C][C]14.3[/C][C]11.7359[/C][C]2.56411[/C][/ROW]
[ROW][C]41[/C][C]13.3[/C][C]11.4225[/C][C]1.87745[/C][/ROW]
[ROW][C]42[/C][C]9.3[/C][C]9.87649[/C][C]-0.576485[/C][/ROW]
[ROW][C]43[/C][C]15.9[/C][C]10.1829[/C][C]5.71708[/C][/ROW]
[ROW][C]44[/C][C]9.1[/C][C]10.6447[/C][C]-1.54467[/C][/ROW]
[ROW][C]45[/C][C]13[/C][C]11.4895[/C][C]1.51054[/C][/ROW]
[ROW][C]46[/C][C]14.5[/C][C]10.1547[/C][C]4.34525[/C][/ROW]
[ROW][C]47[/C][C]14.6[/C][C]10.5815[/C][C]4.0185[/C][/ROW]
[ROW][C]48[/C][C]12.6[/C][C]11.2587[/C][C]1.34129[/C][/ROW]
[ROW][C]49[/C][C]7.7[/C][C]10.2849[/C][C]-2.5849[/C][/ROW]
[ROW][C]50[/C][C]4.3[/C][C]10.1435[/C][C]-5.84348[/C][/ROW]
[ROW][C]51[/C][C]11.8[/C][C]10.4859[/C][C]1.31411[/C][/ROW]
[ROW][C]52[/C][C]11.2[/C][C]9.82988[/C][C]1.37012[/C][/ROW]
[ROW][C]53[/C][C]12.6[/C][C]10.6025[/C][C]1.99753[/C][/ROW]
[ROW][C]54[/C][C]5.6[/C][C]11.5631[/C][C]-5.96307[/C][/ROW]
[ROW][C]55[/C][C]9.9[/C][C]10.4567[/C][C]-0.556706[/C][/ROW]
[ROW][C]56[/C][C]7.7[/C][C]10.5975[/C][C]-2.89747[/C][/ROW]
[ROW][C]57[/C][C]7.3[/C][C]9.86269[/C][C]-2.56269[/C][/ROW]
[ROW][C]58[/C][C]11.4[/C][C]10.3407[/C][C]1.05926[/C][/ROW]
[ROW][C]59[/C][C]13.6[/C][C]10.8922[/C][C]2.70778[/C][/ROW]
[ROW][C]60[/C][C]7.9[/C][C]11.2512[/C][C]-3.35125[/C][/ROW]
[ROW][C]61[/C][C]10.7[/C][C]10.5758[/C][C]0.124205[/C][/ROW]
[ROW][C]62[/C][C]8.3[/C][C]10.9631[/C][C]-2.66308[/C][/ROW]
[ROW][C]63[/C][C]9.6[/C][C]10.9919[/C][C]-1.39187[/C][/ROW]
[ROW][C]64[/C][C]14.2[/C][C]13.0673[/C][C]1.1327[/C][/ROW]
[ROW][C]65[/C][C]11.1[/C][C]11.1262[/C][C]-0.0261967[/C][/ROW]
[/TABLE]
Source: https://freestatistics.org/blog/index.php?pk=268263&T=4

Globally Unique Identifier (entire table): ba.freestatistics.org/blog/index.php?pk=268263&T=4

As an alternative you can also use a QR Code:  

The GUIDs for individual cells are displayed in the table below:

Multiple Linear Regression - Actuals, Interpolation, and Residuals
Time or IndexActualsInterpolationForecastResidualsPrediction Error
112.211.21550.984473
27.410.4315-3.03148
36.710.1826-3.48263
412.610.71141.88864
513.310.85832.4417
611.19.66051.4395
78.29.92994-1.72994
811.410.5720.827998
96.410.155-3.75496
1010.610.6697-0.069694
1111.911.09450.80548
129.611.0292-1.42919
136.49.92049-3.52049
1413.810.1163.68399
1513.810.79383.00624
1611.711.39590.30411
1710.911.3244-0.424429
1816.111.47784.62219
199.910.4733-0.573252
20910.6098-1.60985
219.79.85077-0.150768
2210.810.30050.499531
2310.311.5971-1.29708
2412.710.66662.03336
259.310.4251-1.12512
265.911.0546-5.15461
2711.410.66980.730164
281310.5852.41499
2910.811.1362-0.336172
3012.310.10052.19952
3111.811.03220.767801
327.911.1538-3.25385
3312.311.33560.964398
3411.610.45911.14095
356.711.4776-4.77761
3610.910.78620.113772
3712.110.98311.11695
3813.310.16583.13425
3910.110.6169-0.516895
4014.311.73592.56411
4113.311.42251.87745
429.39.87649-0.576485
4315.910.18295.71708
449.110.6447-1.54467
451311.48951.51054
4614.510.15474.34525
4714.610.58154.0185
4812.611.25871.34129
497.710.2849-2.5849
504.310.1435-5.84348
5111.810.48591.31411
5211.29.829881.37012
5312.610.60251.99753
545.611.5631-5.96307
559.910.4567-0.556706
567.710.5975-2.89747
577.39.86269-2.56269
5811.410.34071.05926
5913.610.89222.70778
607.911.2512-3.35125
6110.710.57580.124205
628.310.9631-2.66308
639.610.9919-1.39187
6414.213.06731.1327
6511.111.1262-0.0261967


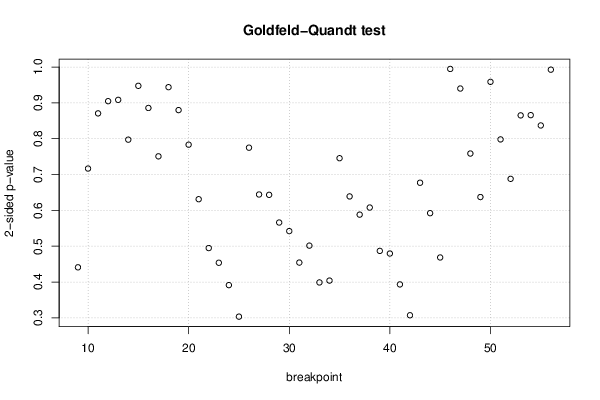
Goldfeld-Quandt test for Heteroskedasticity
p-valuesAlternative Hypothesis
breakpoint indexgreater2-sidedless
90.7794950.441010.220505
100.6416760.7166480.358324
110.5646880.8706240.435312
120.4523420.9046850.547658
130.4542090.9084180.545791
140.6013760.7972480.398624
150.5262390.9475220.473761
160.4428850.8857690.557115
170.3753720.7507450.624628
180.5281220.9437570.471878
190.439890.879780.56011
200.3916180.7832360.608382
210.3155360.6310720.684464
220.2473720.4947430.752628
230.226850.4536990.77315
240.1956420.3912840.804358
250.151650.3033010.84835
260.3874240.7748490.612576
270.3221230.6442450.677877
280.3216720.6433440.678328
290.2829950.565990.717005
300.2710180.5420350.728982
310.2271180.4542350.772882
320.2507420.5014840.749258
330.1993950.3987910.800605
340.2019870.4039750.798013
350.3727650.7455290.627235
360.319450.63890.68055
370.2940350.588070.705965
380.3039320.6078640.696068
390.2434050.4868090.756595
400.2397540.4795070.760246
410.196640.3932790.80336
420.1536020.3072040.846398
430.3385190.6770370.661481
440.2960480.5920970.703952
450.2342260.4684520.765774
460.4973180.9946370.502682
470.4700120.9400230.529988
480.3792810.7585620.620719
490.3185480.6370960.681452
500.4793360.9586720.520664
510.3990240.7980480.600976
520.3439590.6879190.656041
530.4325210.8650430.567479
540.5671430.8657150.432857
550.4184630.8369260.581537
560.496310.992620.50369

\begin{tabular}{lllllllll}
\hline
Goldfeld-Quandt test for Heteroskedasticity \tabularnewline
p-values & Alternative Hypothesis \tabularnewline
breakpoint index & greater & 2-sided & less \tabularnewline
9 & 0.779495 & 0.44101 & 0.220505 \tabularnewline
10 & 0.641676 & 0.716648 & 0.358324 \tabularnewline
11 & 0.564688 & 0.870624 & 0.435312 \tabularnewline
12 & 0.452342 & 0.904685 & 0.547658 \tabularnewline
13 & 0.454209 & 0.908418 & 0.545791 \tabularnewline
14 & 0.601376 & 0.797248 & 0.398624 \tabularnewline
15 & 0.526239 & 0.947522 & 0.473761 \tabularnewline
16 & 0.442885 & 0.885769 & 0.557115 \tabularnewline
17 & 0.375372 & 0.750745 & 0.624628 \tabularnewline
18 & 0.528122 & 0.943757 & 0.471878 \tabularnewline
19 & 0.43989 & 0.87978 & 0.56011 \tabularnewline
20 & 0.391618 & 0.783236 & 0.608382 \tabularnewline
21 & 0.315536 & 0.631072 & 0.684464 \tabularnewline
22 & 0.247372 & 0.494743 & 0.752628 \tabularnewline
23 & 0.22685 & 0.453699 & 0.77315 \tabularnewline
24 & 0.195642 & 0.391284 & 0.804358 \tabularnewline
25 & 0.15165 & 0.303301 & 0.84835 \tabularnewline
26 & 0.387424 & 0.774849 & 0.612576 \tabularnewline
27 & 0.322123 & 0.644245 & 0.677877 \tabularnewline
28 & 0.321672 & 0.643344 & 0.678328 \tabularnewline
29 & 0.282995 & 0.56599 & 0.717005 \tabularnewline
30 & 0.271018 & 0.542035 & 0.728982 \tabularnewline
31 & 0.227118 & 0.454235 & 0.772882 \tabularnewline
32 & 0.250742 & 0.501484 & 0.749258 \tabularnewline
33 & 0.199395 & 0.398791 & 0.800605 \tabularnewline
34 & 0.201987 & 0.403975 & 0.798013 \tabularnewline
35 & 0.372765 & 0.745529 & 0.627235 \tabularnewline
36 & 0.31945 & 0.6389 & 0.68055 \tabularnewline
37 & 0.294035 & 0.58807 & 0.705965 \tabularnewline
38 & 0.303932 & 0.607864 & 0.696068 \tabularnewline
39 & 0.243405 & 0.486809 & 0.756595 \tabularnewline
40 & 0.239754 & 0.479507 & 0.760246 \tabularnewline
41 & 0.19664 & 0.393279 & 0.80336 \tabularnewline
42 & 0.153602 & 0.307204 & 0.846398 \tabularnewline
43 & 0.338519 & 0.677037 & 0.661481 \tabularnewline
44 & 0.296048 & 0.592097 & 0.703952 \tabularnewline
45 & 0.234226 & 0.468452 & 0.765774 \tabularnewline
46 & 0.497318 & 0.994637 & 0.502682 \tabularnewline
47 & 0.470012 & 0.940023 & 0.529988 \tabularnewline
48 & 0.379281 & 0.758562 & 0.620719 \tabularnewline
49 & 0.318548 & 0.637096 & 0.681452 \tabularnewline
50 & 0.479336 & 0.958672 & 0.520664 \tabularnewline
51 & 0.399024 & 0.798048 & 0.600976 \tabularnewline
52 & 0.343959 & 0.687919 & 0.656041 \tabularnewline
53 & 0.432521 & 0.865043 & 0.567479 \tabularnewline
54 & 0.567143 & 0.865715 & 0.432857 \tabularnewline
55 & 0.418463 & 0.836926 & 0.581537 \tabularnewline
56 & 0.49631 & 0.99262 & 0.50369 \tabularnewline
\hline
\end{tabular}
%Source: https://freestatistics.org/blog/index.php?pk=268263&T=5

[TABLE]
[ROW][C]Goldfeld-Quandt test for Heteroskedasticity[/C][/ROW]
[ROW][C]p-values[/C][C]Alternative Hypothesis[/C][/ROW]
[ROW][C]breakpoint index[/C][C]greater[/C][C]2-sided[/C][C]less[/C][/ROW]
[ROW][C]9[/C][C]0.779495[/C][C]0.44101[/C][C]0.220505[/C][/ROW]
[ROW][C]10[/C][C]0.641676[/C][C]0.716648[/C][C]0.358324[/C][/ROW]
[ROW][C]11[/C][C]0.564688[/C][C]0.870624[/C][C]0.435312[/C][/ROW]
[ROW][C]12[/C][C]0.452342[/C][C]0.904685[/C][C]0.547658[/C][/ROW]
[ROW][C]13[/C][C]0.454209[/C][C]0.908418[/C][C]0.545791[/C][/ROW]
[ROW][C]14[/C][C]0.601376[/C][C]0.797248[/C][C]0.398624[/C][/ROW]
[ROW][C]15[/C][C]0.526239[/C][C]0.947522[/C][C]0.473761[/C][/ROW]
[ROW][C]16[/C][C]0.442885[/C][C]0.885769[/C][C]0.557115[/C][/ROW]
[ROW][C]17[/C][C]0.375372[/C][C]0.750745[/C][C]0.624628[/C][/ROW]
[ROW][C]18[/C][C]0.528122[/C][C]0.943757[/C][C]0.471878[/C][/ROW]
[ROW][C]19[/C][C]0.43989[/C][C]0.87978[/C][C]0.56011[/C][/ROW]
[ROW][C]20[/C][C]0.391618[/C][C]0.783236[/C][C]0.608382[/C][/ROW]
[ROW][C]21[/C][C]0.315536[/C][C]0.631072[/C][C]0.684464[/C][/ROW]
[ROW][C]22[/C][C]0.247372[/C][C]0.494743[/C][C]0.752628[/C][/ROW]
[ROW][C]23[/C][C]0.22685[/C][C]0.453699[/C][C]0.77315[/C][/ROW]
[ROW][C]24[/C][C]0.195642[/C][C]0.391284[/C][C]0.804358[/C][/ROW]
[ROW][C]25[/C][C]0.15165[/C][C]0.303301[/C][C]0.84835[/C][/ROW]
[ROW][C]26[/C][C]0.387424[/C][C]0.774849[/C][C]0.612576[/C][/ROW]
[ROW][C]27[/C][C]0.322123[/C][C]0.644245[/C][C]0.677877[/C][/ROW]
[ROW][C]28[/C][C]0.321672[/C][C]0.643344[/C][C]0.678328[/C][/ROW]
[ROW][C]29[/C][C]0.282995[/C][C]0.56599[/C][C]0.717005[/C][/ROW]
[ROW][C]30[/C][C]0.271018[/C][C]0.542035[/C][C]0.728982[/C][/ROW]
[ROW][C]31[/C][C]0.227118[/C][C]0.454235[/C][C]0.772882[/C][/ROW]
[ROW][C]32[/C][C]0.250742[/C][C]0.501484[/C][C]0.749258[/C][/ROW]
[ROW][C]33[/C][C]0.199395[/C][C]0.398791[/C][C]0.800605[/C][/ROW]
[ROW][C]34[/C][C]0.201987[/C][C]0.403975[/C][C]0.798013[/C][/ROW]
[ROW][C]35[/C][C]0.372765[/C][C]0.745529[/C][C]0.627235[/C][/ROW]
[ROW][C]36[/C][C]0.31945[/C][C]0.6389[/C][C]0.68055[/C][/ROW]
[ROW][C]37[/C][C]0.294035[/C][C]0.58807[/C][C]0.705965[/C][/ROW]
[ROW][C]38[/C][C]0.303932[/C][C]0.607864[/C][C]0.696068[/C][/ROW]
[ROW][C]39[/C][C]0.243405[/C][C]0.486809[/C][C]0.756595[/C][/ROW]
[ROW][C]40[/C][C]0.239754[/C][C]0.479507[/C][C]0.760246[/C][/ROW]
[ROW][C]41[/C][C]0.19664[/C][C]0.393279[/C][C]0.80336[/C][/ROW]
[ROW][C]42[/C][C]0.153602[/C][C]0.307204[/C][C]0.846398[/C][/ROW]
[ROW][C]43[/C][C]0.338519[/C][C]0.677037[/C][C]0.661481[/C][/ROW]
[ROW][C]44[/C][C]0.296048[/C][C]0.592097[/C][C]0.703952[/C][/ROW]
[ROW][C]45[/C][C]0.234226[/C][C]0.468452[/C][C]0.765774[/C][/ROW]
[ROW][C]46[/C][C]0.497318[/C][C]0.994637[/C][C]0.502682[/C][/ROW]
[ROW][C]47[/C][C]0.470012[/C][C]0.940023[/C][C]0.529988[/C][/ROW]
[ROW][C]48[/C][C]0.379281[/C][C]0.758562[/C][C]0.620719[/C][/ROW]
[ROW][C]49[/C][C]0.318548[/C][C]0.637096[/C][C]0.681452[/C][/ROW]
[ROW][C]50[/C][C]0.479336[/C][C]0.958672[/C][C]0.520664[/C][/ROW]
[ROW][C]51[/C][C]0.399024[/C][C]0.798048[/C][C]0.600976[/C][/ROW]
[ROW][C]52[/C][C]0.343959[/C][C]0.687919[/C][C]0.656041[/C][/ROW]
[ROW][C]53[/C][C]0.432521[/C][C]0.865043[/C][C]0.567479[/C][/ROW]
[ROW][C]54[/C][C]0.567143[/C][C]0.865715[/C][C]0.432857[/C][/ROW]
[ROW][C]55[/C][C]0.418463[/C][C]0.836926[/C][C]0.581537[/C][/ROW]
[ROW][C]56[/C][C]0.49631[/C][C]0.99262[/C][C]0.50369[/C][/ROW]
[/TABLE]
Source: https://freestatistics.org/blog/index.php?pk=268263&T=5

Globally Unique Identifier (entire table): ba.freestatistics.org/blog/index.php?pk=268263&T=5

As an alternative you can also use a QR Code:  

The GUIDs for individual cells are displayed in the table below:

Goldfeld-Quandt test for Heteroskedasticity
p-valuesAlternative Hypothesis
breakpoint indexgreater2-sidedless
90.7794950.441010.220505
100.6416760.7166480.358324
110.5646880.8706240.435312
120.4523420.9046850.547658
130.4542090.9084180.545791
140.6013760.7972480.398624
150.5262390.9475220.473761
160.4428850.8857690.557115
170.3753720.7507450.624628
180.5281220.9437570.471878
190.439890.879780.56011
200.3916180.7832360.608382
210.3155360.6310720.684464
220.2473720.4947430.752628
230.226850.4536990.77315
240.1956420.3912840.804358
250.151650.3033010.84835
260.3874240.7748490.612576
270.3221230.6442450.677877
280.3216720.6433440.678328
290.2829950.565990.717005
300.2710180.5420350.728982
310.2271180.4542350.772882
320.2507420.5014840.749258
330.1993950.3987910.800605
340.2019870.4039750.798013
350.3727650.7455290.627235
360.319450.63890.68055
370.2940350.588070.705965
380.3039320.6078640.696068
390.2434050.4868090.756595
400.2397540.4795070.760246
410.196640.3932790.80336
420.1536020.3072040.846398
430.3385190.6770370.661481
440.2960480.5920970.703952
450.2342260.4684520.765774
460.4973180.9946370.502682
470.4700120.9400230.529988
480.3792810.7585620.620719
490.3185480.6370960.681452
500.4793360.9586720.520664
510.3990240.7980480.600976
520.3439590.6879190.656041
530.4325210.8650430.567479
540.5671430.8657150.432857
550.4184630.8369260.581537
560.496310.992620.50369


Meta Analysis of Goldfeld-Quandt test for Heteroskedasticity
Description# significant tests% significant testsOK/NOK
1% type I error level00OK
5% type I error level00OK
10% type I error level00OK

\begin{tabular}{lllllllll}
\hline
Meta Analysis of Goldfeld-Quandt test for Heteroskedasticity \tabularnewline
Description & # significant tests & % significant tests & OK/NOK \tabularnewline
1% type I error level & 0 & 0 & OK \tabularnewline
5% type I error level & 0 & 0 & OK \tabularnewline
10% type I error level & 0 & 0 & OK \tabularnewline
\hline
\end{tabular}
%Source: https://freestatistics.org/blog/index.php?pk=268263&T=6

[TABLE]
[ROW][C]Meta Analysis of Goldfeld-Quandt test for Heteroskedasticity[/C][/ROW]
[ROW][C]Description[/C][C]# significant tests[/C][C]% significant tests[/C][C]OK/NOK[/C][/ROW]
[ROW][C]1% type I error level[/C][C]0[/C][C]0[/C][C]OK[/C][/ROW]
[ROW][C]5% type I error level[/C][C]0[/C][C]0[/C][C]OK[/C][/ROW]
[ROW][C]10% type I error level[/C][C]0[/C][C]0[/C][C]OK[/C][/ROW]
[/TABLE]
Source: https://freestatistics.org/blog/index.php?pk=268263&T=6

Globally Unique Identifier (entire table): ba.freestatistics.org/blog/index.php?pk=268263&T=6

As an alternative you can also use a QR Code:  

The GUIDs for individual cells are displayed in the table below:

Meta Analysis of Goldfeld-Quandt test for Heteroskedasticity
Description# significant tests% significant testsOK/NOK
1% type I error level00OK
5% type I error level00OK
10% type I error level00OK


Parameters (Session):
par1 = 1 ; par2 = Do not include Seasonal Dummies ; par3 = No Linear Trend ;
Parameters (R input):
par1 = 1 ; par2 = Do not include Seasonal Dummies ; par3 = No Linear Trend ;
R code (references can be found in the software module):
library(lattice)
library(lmtest)
n25 <- 25 #minimum number of obs. for Goldfeld-Quandt test
par1 <- as.numeric(par1)
x <- t(y)
k <- length(x[1,])
n <- length(x[,1])
x1 <- cbind(x[,par1], x[,1:k!=par1])
mycolnames <- c(colnames(x)[par1], colnames(x)[1:k!=par1])
colnames(x1) <- mycolnames #colnames(x)[par1]
x <- x1
if (par3 == 'First Differences'){
x2 <- array(0, dim=c(n-1,k), dimnames=list(1:(n-1), paste('(1-B)',colnames(x),sep='')))
for (i in 1:n-1) {
for (j in 1:k) {
x2[i,j] <- x[i+1,j] - x[i,j]
}
}
x <- x2
}
if (par2 == 'Include Monthly Dummies'){
x2 <- array(0, dim=c(n,11), dimnames=list(1:n, paste('M', seq(1:11), sep ='')))
for (i in 1:11){
x2[seq(i,n,12),i] <- 1
}
x <- cbind(x, x2)
}
if (par2 == 'Include Quarterly Dummies'){
x2 <- array(0, dim=c(n,3), dimnames=list(1:n, paste('Q', seq(1:3), sep ='')))
for (i in 1:3){
x2[seq(i,n,4),i] <- 1
}
x <- cbind(x, x2)
}
k <- length(x[1,])
if (par3 == 'Linear Trend'){
x <- cbind(x, c(1:n))
colnames(x)[k+1] <- 't'
}
x
k <- length(x[1,])
df <- as.data.frame(x)
(mylm <- lm(df))
(mysum <- summary(mylm))
if (n > n25) {
kp3 <- k + 3
nmkm3 <- n - k - 3
gqarr <- array(NA, dim=c(nmkm3-kp3+1,3))
numgqtests <- 0
numsignificant1 <- 0
numsignificant5 <- 0
numsignificant10 <- 0
for (mypoint in kp3:nmkm3) {
j <- 0
numgqtests <- numgqtests + 1
for (myalt in c('greater', 'two.sided', 'less')) {
j <- j + 1
gqarr[mypoint-kp3+1,j] <- gqtest(mylm, point=mypoint, alternative=myalt)$p.value
}
if (gqarr[mypoint-kp3+1,2] < 0.01) numsignificant1 <- numsignificant1 + 1
if (gqarr[mypoint-kp3+1,2] < 0.05) numsignificant5 <- numsignificant5 + 1
if (gqarr[mypoint-kp3+1,2] < 0.10) numsignificant10 <- numsignificant10 + 1
}
gqarr
}
bitmap(file='test0.png')
plot(x[,1], type='l', main='Actuals and Interpolation', ylab='value of Actuals and Interpolation (dots)', xlab='time or index')
points(x[,1]-mysum$resid)
grid()
dev.off()
bitmap(file='test1.png')
plot(mysum$resid, type='b', pch=19, main='Residuals', ylab='value of Residuals', xlab='time or index')
grid()
dev.off()
bitmap(file='test2.png')
hist(mysum$resid, main='Residual Histogram', xlab='values of Residuals')
grid()
dev.off()
bitmap(file='test3.png')
densityplot(~mysum$resid,col='black',main='Residual Density Plot', xlab='values of Residuals')
dev.off()
bitmap(file='test4.png')
qqnorm(mysum$resid, main='Residual Normal Q-Q Plot')
qqline(mysum$resid)
grid()
dev.off()
(myerror <- as.ts(mysum$resid))
bitmap(file='test5.png')
dum <- cbind(lag(myerror,k=1),myerror)
dum
dum1 <- dum[2:length(myerror),]
dum1
z <- as.data.frame(dum1)
z
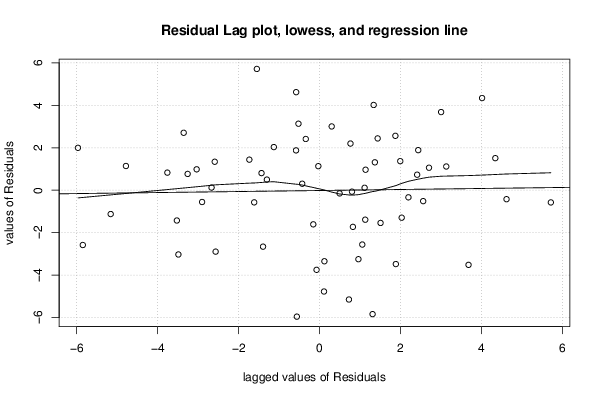
plot(z,main=paste('Residual Lag plot, lowess, and regression line'), ylab='values of Residuals', xlab='lagged values of Residuals')
lines(lowess(z))
abline(lm(z))
grid()
dev.off()
bitmap(file='test6.png')
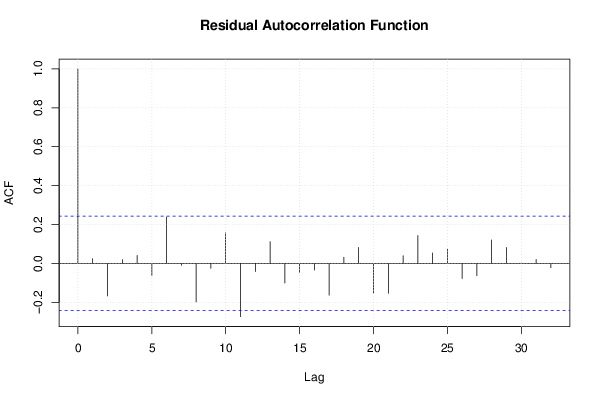
acf(mysum$resid, lag.max=length(mysum$resid)/2, main='Residual Autocorrelation Function')
grid()
dev.off()
bitmap(file='test7.png')
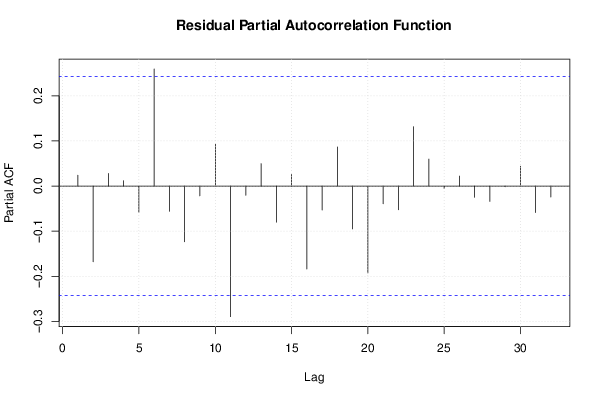
pacf(mysum$resid, lag.max=length(mysum$resid)/2, main='Residual Partial Autocorrelation Function')
grid()
dev.off()
bitmap(file='test8.png')
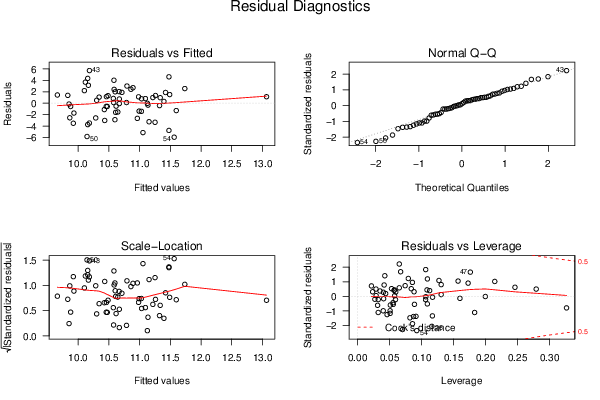
opar <- par(mfrow = c(2,2), oma = c(0, 0, 1.1, 0))
plot(mylm, las = 1, sub='Residual Diagnostics')
par(opar)
dev.off()
if (n > n25) {
bitmap(file='test9.png')
plot(kp3:nmkm3,gqarr[,2], main='Goldfeld-Quandt test',ylab='2-sided p-value',xlab='breakpoint')
grid()
dev.off()
}
load(file='createtable')
a<-table.start()
a<-table.row.start(a)
a<-table.element(a, 'Multiple Linear Regression - Estimated Regression Equation', 1, TRUE)
a<-table.row.end(a)
myeq <- colnames(x)[1]
myeq <- paste(myeq, '[t] = ', sep='')
for (i in 1:k){
if (mysum$coefficients[i,1] > 0) myeq <- paste(myeq, '+', '')
myeq <- paste(myeq, signif(mysum$coefficients[i,1],6), sep=' ')
if (rownames(mysum$coefficients)[i] != '(Intercept)') {
myeq <- paste(myeq, rownames(mysum$coefficients)[i], sep='')
if (rownames(mysum$coefficients)[i] != 't') myeq <- paste(myeq, '[t]', sep='')
}
}
myeq <- paste(myeq, ' + e[t]')
a<-table.row.start(a)
a<-table.element(a, myeq)
a<-table.row.end(a)
a<-table.end(a)
table.save(a,file='mytable1.tab')
a<-table.start()
a<-table.row.start(a)
a<-table.element(a,hyperlink('ols1.htm','Multiple Linear Regression - Ordinary Least Squares',''), 6, TRUE)
a<-table.row.end(a)
a<-table.row.start(a)
a<-table.element(a,'Variable',header=TRUE)
a<-table.element(a,'Parameter',header=TRUE)
a<-table.element(a,'S.D.',header=TRUE)
a<-table.element(a,'T-STAT
H0: parameter = 0',header=TRUE)
a<-table.element(a,'2-tail p-value',header=TRUE)
a<-table.element(a,'1-tail p-value',header=TRUE)
a<-table.row.end(a)
for (i in 1:k){
a<-table.row.start(a)
a<-table.element(a,rownames(mysum$coefficients)[i],header=TRUE)
a<-table.element(a,signif(mysum$coefficients[i,1],6))
a<-table.element(a, signif(mysum$coefficients[i,2],6))
a<-table.element(a, signif(mysum$coefficients[i,3],4))
a<-table.element(a, signif(mysum$coefficients[i,4],6))
a<-table.element(a, signif(mysum$coefficients[i,4]/2,6))
a<-table.row.end(a)
}
a<-table.end(a)
table.save(a,file='mytable2.tab')
a<-table.start()
a<-table.row.start(a)
a<-table.element(a, 'Multiple Linear Regression - Regression Statistics', 2, TRUE)
a<-table.row.end(a)
a<-table.row.start(a)
a<-table.element(a, 'Multiple R',1,TRUE)
a<-table.element(a, signif(sqrt(mysum$r.squared),6))
a<-table.row.end(a)
a<-table.row.start(a)
a<-table.element(a, 'R-squared',1,TRUE)
a<-table.element(a, signif(mysum$r.squared,6))
a<-table.row.end(a)
a<-table.row.start(a)
a<-table.element(a, 'Adjusted R-squared',1,TRUE)
a<-table.element(a, signif(mysum$adj.r.squared,6))
a<-table.row.end(a)
a<-table.row.start(a)
a<-table.element(a, 'F-TEST (value)',1,TRUE)
a<-table.element(a, signif(mysum$fstatistic[1],6))
a<-table.row.end(a)
a<-table.row.start(a)
a<-table.element(a, 'F-TEST (DF numerator)',1,TRUE)
a<-table.element(a, signif(mysum$fstatistic[2],6))
a<-table.row.end(a)
a<-table.row.start(a)
a<-table.element(a, 'F-TEST (DF denominator)',1,TRUE)
a<-table.element(a, signif(mysum$fstatistic[3],6))
a<-table.row.end(a)
a<-table.row.start(a)
a<-table.element(a, 'p-value',1,TRUE)
a<-table.element(a, signif(1-pf(mysum$fstatistic[1],mysum$fstatistic[2],mysum$fstatistic[3]),6))
a<-table.row.end(a)
a<-table.row.start(a)
a<-table.element(a, 'Multiple Linear Regression - Residual Statistics', 2, TRUE)
a<-table.row.end(a)
a<-table.row.start(a)
a<-table.element(a, 'Residual Standard Deviation',1,TRUE)
a<-table.element(a, signif(mysum$sigma,6))
a<-table.row.end(a)
a<-table.row.start(a)
a<-table.element(a, 'Sum Squared Residuals',1,TRUE)
a<-table.element(a, signif(sum(myerror*myerror),6))
a<-table.row.end(a)
a<-table.end(a)
table.save(a,file='mytable3.tab')
a<-table.start()
a<-table.row.start(a)
a<-table.element(a, 'Multiple Linear Regression - Actuals, Interpolation, and Residuals', 4, TRUE)
a<-table.row.end(a)
a<-table.row.start(a)
a<-table.element(a, 'Time or Index', 1, TRUE)
a<-table.element(a, 'Actuals', 1, TRUE)
a<-table.element(a, 'Interpolation
Forecast', 1, TRUE)
a<-table.element(a, 'Residuals
Prediction Error', 1, TRUE)
a<-table.row.end(a)
for (i in 1:n) {
a<-table.row.start(a)
a<-table.element(a,i, 1, TRUE)
a<-table.element(a,signif(x[i],6))
a<-table.element(a,signif(x[i]-mysum$resid[i],6))
a<-table.element(a,signif(mysum$resid[i],6))
a<-table.row.end(a)
}
a<-table.end(a)
table.save(a,file='mytable4.tab')
if (n > n25) {
a<-table.start()
a<-table.row.start(a)
a<-table.element(a,'Goldfeld-Quandt test for Heteroskedasticity',4,TRUE)
a<-table.row.end(a)
a<-table.row.start(a)
a<-table.element(a,'p-values',header=TRUE)
a<-table.element(a,'Alternative Hypothesis',3,header=TRUE)
a<-table.row.end(a)
a<-table.row.start(a)
a<-table.element(a,'breakpoint index',header=TRUE)
a<-table.element(a,'greater',header=TRUE)
a<-table.element(a,'2-sided',header=TRUE)
a<-table.element(a,'less',header=TRUE)
a<-table.row.end(a)
for (mypoint in kp3:nmkm3) {
a<-table.row.start(a)
a<-table.element(a,mypoint,header=TRUE)
a<-table.element(a,signif(gqarr[mypoint-kp3+1,1],6))
a<-table.element(a,signif(gqarr[mypoint-kp3+1,2],6))
a<-table.element(a,signif(gqarr[mypoint-kp3+1,3],6))
a<-table.row.end(a)
}
a<-table.end(a)
table.save(a,file='mytable5.tab')
a<-table.start()
a<-table.row.start(a)
a<-table.element(a,'Meta Analysis of Goldfeld-Quandt test for Heteroskedasticity',4,TRUE)
a<-table.row.end(a)
a<-table.row.start(a)
a<-table.element(a,'Description',header=TRUE)
a<-table.element(a,'# significant tests',header=TRUE)
a<-table.element(a,'% significant tests',header=TRUE)
a<-table.element(a,'OK/NOK',header=TRUE)
a<-table.row.end(a)
a<-table.row.start(a)
a<-table.element(a,'1% type I error level',header=TRUE)
a<-table.element(a,signif(numsignificant1,6))
a<-table.element(a,signif(numsignificant1/numgqtests,6))
if (numsignificant1/numgqtests < 0.01) dum <- 'OK' else dum <- 'NOK'
a<-table.element(a,dum)
a<-table.row.end(a)
a<-table.row.start(a)
a<-table.element(a,'5% type I error level',header=TRUE)
a<-table.element(a,signif(numsignificant5,6))
a<-table.element(a,signif(numsignificant5/numgqtests,6))
if (numsignificant5/numgqtests < 0.05) dum <- 'OK' else dum <- 'NOK'
a<-table.element(a,dum)
a<-table.row.end(a)
a<-table.row.start(a)
a<-table.element(a,'10% type I error level',header=TRUE)
a<-table.element(a,signif(numsignificant10,6))
a<-table.element(a,signif(numsignificant10/numgqtests,6))
if (numsignificant10/numgqtests < 0.1) dum <- 'OK' else dum <- 'NOK'
a<-table.element(a,dum)
a<-table.row.end(a)
a<-table.end(a)
table.save(a,file='mytable6.tab')
}