Free Statistics

of Irreproducible Research!

Author's title

Author*The author of this computation has been verified*
R Software Modulerwasp_multipleregression.wasp
Title produced by softwareMultiple Regression
Date of computationMon, 15 Dec 2014 12:52:43 +0000
Cite this page as followsStatistical Computations at FreeStatistics.org, Office for Research Development and Education, URL https://freestatistics.org/blog/index.php?v=date/2014/Dec/15/t1418647974ylq5r04zmgyex0d.htm/, Retrieved Thu, 16 May 2024 13:24:43 +0000
Statistical Computations at FreeStatistics.org, Office for Research Development and Education, URL https://freestatistics.org/blog/index.php?pk=268282, Retrieved Thu, 16 May 2024 13:24:43 +0000
QR Codes:

Original text written by user:
IsPrivate?No (this computation is public)
User-defined keywords
Estimated Impact57
Family? (F = Feedback message, R = changed R code, M = changed R Module, P = changed Parameters, D = changed Data)
-       [Multiple Regression] [] [2014-12-15 12:52:43] [624214a256768d6065ce8a528542dcc5] [Current]
Feedback Forum

Post a new message
Dataseries X:
11,3	62	72	16	12	11
9,6	56	61	13	8	13
16,1	57	68	14	7	12
13,4	51	61	16	12	15
12,7	56	64	17	13	13
12,3	30	65	16	11	16
7,9	61	69	15	12	12
12,3	47	63	13	10	12
11,6	56	75	14	11	15
6,7	50	63	13	7	12
12,1	67	73	19	13	12
5,7	41	75	15	6	11
8	45	63	10	10	12
13,3	48	63	16	12	11
9,1	44	62	12	12	14
12,2	37	64	15	12	12
8,8	56	60	11	8	15
14,6	66	56	9	10	14
12,6	38	59	12	12	12
9,9	34	68	14	9	14
10,5	49	66	14	11	11
13,4	55	73	13	10	13
10,9	49	72	16	12	14
4,3	59	71	13	10	16
10,3	40	59	16	9	13
11,8	58	64	16	11	14
11,2	60	66	16	12	16
11,4	63	78	10	7	11
8,6	56	68	12	11	13
13,2	54	73	12	12	13
12,6	52	62	12	6	15
5,6	34	65	12	9	12
9,9	69	68	19	15	13
8,8	32	65	14	10	12
7,7	48	60	13	11	14
9	67	71	16	12	14
7,3	58	65	15	12	16
11,4	57	68	12	12	15
13,6	42	64	8	11	14
7,9	64	74	10	9	13
10,7	58	69	16	11	14
10,3	66	76	16	12	15
8,3	26	68	10	12	14
9,6	61	72	18	14	12
14,2	52	67	12	8	7
8,5	51	63	16	10	12
13,5	55	59	10	9	15
4,9	50	73	14	10	12
6,4	60	66	12	9	13
9,6	56	62	11	10	11
11,6	63	69	15	12	14
11,1	61	66	7	11	13


Summary of computational transaction
Raw Inputview raw input (R code)
Raw Outputview raw output of R engine
Computing time5 seconds
R Server'George Udny Yule' @ yule.wessa.net

\begin{tabular}{lllllllll}
\hline
Summary of computational transaction \tabularnewline
Raw Input & view raw input (R code)  \tabularnewline
Raw Output & view raw output of R engine  \tabularnewline
Computing time & 5 seconds \tabularnewline
R Server & 'George Udny Yule' @ yule.wessa.net \tabularnewline
\hline
\end{tabular}
%Source: https://freestatistics.org/blog/index.php?pk=268282&T=0

[TABLE]
[ROW][C]Summary of computational transaction[/C][/ROW]
[ROW][C]Raw Input[/C][C]view raw input (R code) [/C][/ROW]
[ROW][C]Raw Output[/C][C]view raw output of R engine [/C][/ROW]
[ROW][C]Computing time[/C][C]5 seconds[/C][/ROW]
[ROW][C]R Server[/C][C]'George Udny Yule' @ yule.wessa.net[/C][/ROW]
[/TABLE]
Source: https://freestatistics.org/blog/index.php?pk=268282&T=0

Globally Unique Identifier (entire table): ba.freestatistics.org/blog/index.php?pk=268282&T=0

As an alternative you can also use a QR Code:  

The GUIDs for individual cells are displayed in the table below:

Summary of computational transaction
Raw Inputview raw input (R code)
Raw Outputview raw output of R engine
Computing time5 seconds
R Server'George Udny Yule' @ yule.wessa.net


Multiple Linear Regression - Estimated Regression Equation
TOT.B[t] = + 17.116 + 0.0419092AMS.I.B[t] -0.124963AMS.E.B[t] -0.0366087CONFSTAT.B[t] + 0.211774CONFSOFT.B[t] -0.180195STRESS.B[t] + e[t]

\begin{tabular}{lllllllll}
\hline
Multiple Linear Regression - Estimated Regression Equation \tabularnewline
TOT.B[t] =  +  17.116 +  0.0419092AMS.I.B[t] -0.124963AMS.E.B[t] -0.0366087CONFSTAT.B[t] +  0.211774CONFSOFT.B[t] -0.180195STRESS.B[t]  + e[t] \tabularnewline
\hline
\end{tabular}
%Source: https://freestatistics.org/blog/index.php?pk=268282&T=1

[TABLE]
[ROW][C]Multiple Linear Regression - Estimated Regression Equation[/C][/ROW]
[ROW][C]TOT.B[t] =  +  17.116 +  0.0419092AMS.I.B[t] -0.124963AMS.E.B[t] -0.0366087CONFSTAT.B[t] +  0.211774CONFSOFT.B[t] -0.180195STRESS.B[t]  + e[t][/C][/ROW]
[/TABLE]
Source: https://freestatistics.org/blog/index.php?pk=268282&T=1

Globally Unique Identifier (entire table): ba.freestatistics.org/blog/index.php?pk=268282&T=1

As an alternative you can also use a QR Code:  

The GUIDs for individual cells are displayed in the table below:

Multiple Linear Regression - Estimated Regression Equation
TOT.B[t] = + 17.116 + 0.0419092AMS.I.B[t] -0.124963AMS.E.B[t] -0.0366087CONFSTAT.B[t] + 0.211774CONFSOFT.B[t] -0.180195STRESS.B[t] + e[t]


Multiple Linear Regression - Ordinary Least Squares
VariableParameterS.D.T-STATH0: parameter = 02-tail p-value1-tail p-value
(Intercept)17.1166.015712.8450.006605080.00330254
AMS.I.B0.04190920.03839921.0910.2807770.140389
AMS.E.B-0.1249630.0789959-1.5820.1205270.0602637
CONFSTAT.B-0.03660870.158899-0.23040.818810.409405
CONFSOFT.B0.2117740.2197960.96350.3403350.170167
STRESS.B-0.1801950.227396-0.79240.432180.21609

\begin{tabular}{lllllllll}
\hline
Multiple Linear Regression - Ordinary Least Squares \tabularnewline
Variable & Parameter & S.D. & T-STATH0: parameter = 0 & 2-tail p-value & 1-tail p-value \tabularnewline
(Intercept) & 17.116 & 6.01571 & 2.845 & 0.00660508 & 0.00330254 \tabularnewline
AMS.I.B & 0.0419092 & 0.0383992 & 1.091 & 0.280777 & 0.140389 \tabularnewline
AMS.E.B & -0.124963 & 0.0789959 & -1.582 & 0.120527 & 0.0602637 \tabularnewline
CONFSTAT.B & -0.0366087 & 0.158899 & -0.2304 & 0.81881 & 0.409405 \tabularnewline
CONFSOFT.B & 0.211774 & 0.219796 & 0.9635 & 0.340335 & 0.170167 \tabularnewline
STRESS.B & -0.180195 & 0.227396 & -0.7924 & 0.43218 & 0.21609 \tabularnewline
\hline
\end{tabular}
%Source: https://freestatistics.org/blog/index.php?pk=268282&T=2

[TABLE]
[ROW][C]Multiple Linear Regression - Ordinary Least Squares[/C][/ROW]
[ROW][C]Variable[/C][C]Parameter[/C][C]S.D.[/C][C]T-STATH0: parameter = 0[/C][C]2-tail p-value[/C][C]1-tail p-value[/C][/ROW]
[ROW][C](Intercept)[/C][C]17.116[/C][C]6.01571[/C][C]2.845[/C][C]0.00660508[/C][C]0.00330254[/C][/ROW]
[ROW][C]AMS.I.B[/C][C]0.0419092[/C][C]0.0383992[/C][C]1.091[/C][C]0.280777[/C][C]0.140389[/C][/ROW]
[ROW][C]AMS.E.B[/C][C]-0.124963[/C][C]0.0789959[/C][C]-1.582[/C][C]0.120527[/C][C]0.0602637[/C][/ROW]
[ROW][C]CONFSTAT.B[/C][C]-0.0366087[/C][C]0.158899[/C][C]-0.2304[/C][C]0.81881[/C][C]0.409405[/C][/ROW]
[ROW][C]CONFSOFT.B[/C][C]0.211774[/C][C]0.219796[/C][C]0.9635[/C][C]0.340335[/C][C]0.170167[/C][/ROW]
[ROW][C]STRESS.B[/C][C]-0.180195[/C][C]0.227396[/C][C]-0.7924[/C][C]0.43218[/C][C]0.21609[/C][/ROW]
[/TABLE]
Source: https://freestatistics.org/blog/index.php?pk=268282&T=2

Globally Unique Identifier (entire table): ba.freestatistics.org/blog/index.php?pk=268282&T=2

As an alternative you can also use a QR Code:  

The GUIDs for individual cells are displayed in the table below:

Multiple Linear Regression - Ordinary Least Squares
VariableParameterS.D.T-STATH0: parameter = 02-tail p-value1-tail p-value
(Intercept)17.1166.015712.8450.006605080.00330254
AMS.I.B0.04190920.03839921.0910.2807770.140389
AMS.E.B-0.1249630.0789959-1.5820.1205270.0602637
CONFSTAT.B-0.03660870.158899-0.23040.818810.409405
CONFSOFT.B0.2117740.2197960.96350.3403350.170167
STRESS.B-0.1801950.227396-0.79240.432180.21609


Multiple Linear Regression - Regression Statistics
Multiple R0.288316
R-squared0.0831264
Adjusted R-squared-0.0165338
F-TEST (value)0.834099
F-TEST (DF numerator)5
F-TEST (DF denominator)46
p-value0.532303
Multiple Linear Regression - Residual Statistics
Residual Standard Deviation2.66346
Sum Squared Residuals326.324

\begin{tabular}{lllllllll}
\hline
Multiple Linear Regression - Regression Statistics \tabularnewline
Multiple R & 0.288316 \tabularnewline
R-squared & 0.0831264 \tabularnewline
Adjusted R-squared & -0.0165338 \tabularnewline
F-TEST (value) & 0.834099 \tabularnewline
F-TEST (DF numerator) & 5 \tabularnewline
F-TEST (DF denominator) & 46 \tabularnewline
p-value & 0.532303 \tabularnewline
Multiple Linear Regression - Residual Statistics \tabularnewline
Residual Standard Deviation & 2.66346 \tabularnewline
Sum Squared Residuals & 326.324 \tabularnewline
\hline
\end{tabular}
%Source: https://freestatistics.org/blog/index.php?pk=268282&T=3

[TABLE]
[ROW][C]Multiple Linear Regression - Regression Statistics[/C][/ROW]
[ROW][C]Multiple R[/C][C]0.288316[/C][/ROW]
[ROW][C]R-squared[/C][C]0.0831264[/C][/ROW]
[ROW][C]Adjusted R-squared[/C][C]-0.0165338[/C][/ROW]
[ROW][C]F-TEST (value)[/C][C]0.834099[/C][/ROW]
[ROW][C]F-TEST (DF numerator)[/C][C]5[/C][/ROW]
[ROW][C]F-TEST (DF denominator)[/C][C]46[/C][/ROW]
[ROW][C]p-value[/C][C]0.532303[/C][/ROW]
[ROW][C]Multiple Linear Regression - Residual Statistics[/C][/ROW]
[ROW][C]Residual Standard Deviation[/C][C]2.66346[/C][/ROW]
[ROW][C]Sum Squared Residuals[/C][C]326.324[/C][/ROW]
[/TABLE]
Source: https://freestatistics.org/blog/index.php?pk=268282&T=3

Globally Unique Identifier (entire table): ba.freestatistics.org/blog/index.php?pk=268282&T=3

As an alternative you can also use a QR Code:  

The GUIDs for individual cells are displayed in the table below:

Multiple Linear Regression - Regression Statistics
Multiple R0.288316
R-squared0.0831264
Adjusted R-squared-0.0165338
F-TEST (value)0.834099
F-TEST (DF numerator)5
F-TEST (DF denominator)46
p-value0.532303
Multiple Linear Regression - Residual Statistics
Residual Standard Deviation2.66346
Sum Squared Residuals326.324


Multiple Linear Regression - Actuals, Interpolation, and Residuals
Time or IndexActualsInterpolationForecastResidualsPrediction Error
111.310.69050.609528
29.610.7159-1.11595
316.19.814936.28507
413.410.88332.51672
512.711.25351.44651
612.39.111373.18863
77.910.8799-2.97986
812.310.69261.60742
911.69.204792.39521
106.710.183-3.48299
1112.110.69681.40319
125.78.20146-2.50146
13810.7186-2.71859
1413.311.22842.07159
159.110.7916-1.69158
1612.210.49891.70114
178.810.5537-1.75374
1814.612.14962.45036
1912.611.27541.32459
209.98.914180.985823
2110.510.7569-0.256872
2213.49.598033.80197
2310.99.605071.29493
244.39.47501-5.17501
2510.310.3973-0.0972741
2611.810.77021.02982
2711.210.45550.744544
2811.49.143392.25661
298.610.5131-1.91314
3013.210.01633.18372
3112.69.676022.92398
325.69.72267-4.12267
339.911.6488-1.74879
348.89.77741-0.97741
357.710.9608-3.26076
36910.4844-1.4844
377.310.5332-3.23321
3811.410.40640.993567
3913.610.39253.2075
407.99.74831-1.84831
4110.710.14540.554635
4210.39.637480.662521
438.39.36066-1.06066
449.610.8187-1.2187
4514.210.91633.28369
468.510.7504-2.25039
4713.510.88522.61482
484.99.53207-4.63207
496.410.5072-4.10715
509.611.4481-1.84814
5111.610.60330.996706
5211.111.1557-0.0556541

\begin{tabular}{lllllllll}
\hline
Multiple Linear Regression - Actuals, Interpolation, and Residuals \tabularnewline
Time or Index & Actuals & InterpolationForecast & ResidualsPrediction Error \tabularnewline
1 & 11.3 & 10.6905 & 0.609528 \tabularnewline
2 & 9.6 & 10.7159 & -1.11595 \tabularnewline
3 & 16.1 & 9.81493 & 6.28507 \tabularnewline
4 & 13.4 & 10.8833 & 2.51672 \tabularnewline
5 & 12.7 & 11.2535 & 1.44651 \tabularnewline
6 & 12.3 & 9.11137 & 3.18863 \tabularnewline
7 & 7.9 & 10.8799 & -2.97986 \tabularnewline
8 & 12.3 & 10.6926 & 1.60742 \tabularnewline
9 & 11.6 & 9.20479 & 2.39521 \tabularnewline
10 & 6.7 & 10.183 & -3.48299 \tabularnewline
11 & 12.1 & 10.6968 & 1.40319 \tabularnewline
12 & 5.7 & 8.20146 & -2.50146 \tabularnewline
13 & 8 & 10.7186 & -2.71859 \tabularnewline
14 & 13.3 & 11.2284 & 2.07159 \tabularnewline
15 & 9.1 & 10.7916 & -1.69158 \tabularnewline
16 & 12.2 & 10.4989 & 1.70114 \tabularnewline
17 & 8.8 & 10.5537 & -1.75374 \tabularnewline
18 & 14.6 & 12.1496 & 2.45036 \tabularnewline
19 & 12.6 & 11.2754 & 1.32459 \tabularnewline
20 & 9.9 & 8.91418 & 0.985823 \tabularnewline
21 & 10.5 & 10.7569 & -0.256872 \tabularnewline
22 & 13.4 & 9.59803 & 3.80197 \tabularnewline
23 & 10.9 & 9.60507 & 1.29493 \tabularnewline
24 & 4.3 & 9.47501 & -5.17501 \tabularnewline
25 & 10.3 & 10.3973 & -0.0972741 \tabularnewline
26 & 11.8 & 10.7702 & 1.02982 \tabularnewline
27 & 11.2 & 10.4555 & 0.744544 \tabularnewline
28 & 11.4 & 9.14339 & 2.25661 \tabularnewline
29 & 8.6 & 10.5131 & -1.91314 \tabularnewline
30 & 13.2 & 10.0163 & 3.18372 \tabularnewline
31 & 12.6 & 9.67602 & 2.92398 \tabularnewline
32 & 5.6 & 9.72267 & -4.12267 \tabularnewline
33 & 9.9 & 11.6488 & -1.74879 \tabularnewline
34 & 8.8 & 9.77741 & -0.97741 \tabularnewline
35 & 7.7 & 10.9608 & -3.26076 \tabularnewline
36 & 9 & 10.4844 & -1.4844 \tabularnewline
37 & 7.3 & 10.5332 & -3.23321 \tabularnewline
38 & 11.4 & 10.4064 & 0.993567 \tabularnewline
39 & 13.6 & 10.3925 & 3.2075 \tabularnewline
40 & 7.9 & 9.74831 & -1.84831 \tabularnewline
41 & 10.7 & 10.1454 & 0.554635 \tabularnewline
42 & 10.3 & 9.63748 & 0.662521 \tabularnewline
43 & 8.3 & 9.36066 & -1.06066 \tabularnewline
44 & 9.6 & 10.8187 & -1.2187 \tabularnewline
45 & 14.2 & 10.9163 & 3.28369 \tabularnewline
46 & 8.5 & 10.7504 & -2.25039 \tabularnewline
47 & 13.5 & 10.8852 & 2.61482 \tabularnewline
48 & 4.9 & 9.53207 & -4.63207 \tabularnewline
49 & 6.4 & 10.5072 & -4.10715 \tabularnewline
50 & 9.6 & 11.4481 & -1.84814 \tabularnewline
51 & 11.6 & 10.6033 & 0.996706 \tabularnewline
52 & 11.1 & 11.1557 & -0.0556541 \tabularnewline
\hline
\end{tabular}
%Source: https://freestatistics.org/blog/index.php?pk=268282&T=4

[TABLE]
[ROW][C]Multiple Linear Regression - Actuals, Interpolation, and Residuals[/C][/ROW]
[ROW][C]Time or Index[/C][C]Actuals[/C][C]InterpolationForecast[/C][C]ResidualsPrediction Error[/C][/ROW]
[ROW][C]1[/C][C]11.3[/C][C]10.6905[/C][C]0.609528[/C][/ROW]
[ROW][C]2[/C][C]9.6[/C][C]10.7159[/C][C]-1.11595[/C][/ROW]
[ROW][C]3[/C][C]16.1[/C][C]9.81493[/C][C]6.28507[/C][/ROW]
[ROW][C]4[/C][C]13.4[/C][C]10.8833[/C][C]2.51672[/C][/ROW]
[ROW][C]5[/C][C]12.7[/C][C]11.2535[/C][C]1.44651[/C][/ROW]
[ROW][C]6[/C][C]12.3[/C][C]9.11137[/C][C]3.18863[/C][/ROW]
[ROW][C]7[/C][C]7.9[/C][C]10.8799[/C][C]-2.97986[/C][/ROW]
[ROW][C]8[/C][C]12.3[/C][C]10.6926[/C][C]1.60742[/C][/ROW]
[ROW][C]9[/C][C]11.6[/C][C]9.20479[/C][C]2.39521[/C][/ROW]
[ROW][C]10[/C][C]6.7[/C][C]10.183[/C][C]-3.48299[/C][/ROW]
[ROW][C]11[/C][C]12.1[/C][C]10.6968[/C][C]1.40319[/C][/ROW]
[ROW][C]12[/C][C]5.7[/C][C]8.20146[/C][C]-2.50146[/C][/ROW]
[ROW][C]13[/C][C]8[/C][C]10.7186[/C][C]-2.71859[/C][/ROW]
[ROW][C]14[/C][C]13.3[/C][C]11.2284[/C][C]2.07159[/C][/ROW]
[ROW][C]15[/C][C]9.1[/C][C]10.7916[/C][C]-1.69158[/C][/ROW]
[ROW][C]16[/C][C]12.2[/C][C]10.4989[/C][C]1.70114[/C][/ROW]
[ROW][C]17[/C][C]8.8[/C][C]10.5537[/C][C]-1.75374[/C][/ROW]
[ROW][C]18[/C][C]14.6[/C][C]12.1496[/C][C]2.45036[/C][/ROW]
[ROW][C]19[/C][C]12.6[/C][C]11.2754[/C][C]1.32459[/C][/ROW]
[ROW][C]20[/C][C]9.9[/C][C]8.91418[/C][C]0.985823[/C][/ROW]
[ROW][C]21[/C][C]10.5[/C][C]10.7569[/C][C]-0.256872[/C][/ROW]
[ROW][C]22[/C][C]13.4[/C][C]9.59803[/C][C]3.80197[/C][/ROW]
[ROW][C]23[/C][C]10.9[/C][C]9.60507[/C][C]1.29493[/C][/ROW]
[ROW][C]24[/C][C]4.3[/C][C]9.47501[/C][C]-5.17501[/C][/ROW]
[ROW][C]25[/C][C]10.3[/C][C]10.3973[/C][C]-0.0972741[/C][/ROW]
[ROW][C]26[/C][C]11.8[/C][C]10.7702[/C][C]1.02982[/C][/ROW]
[ROW][C]27[/C][C]11.2[/C][C]10.4555[/C][C]0.744544[/C][/ROW]
[ROW][C]28[/C][C]11.4[/C][C]9.14339[/C][C]2.25661[/C][/ROW]
[ROW][C]29[/C][C]8.6[/C][C]10.5131[/C][C]-1.91314[/C][/ROW]
[ROW][C]30[/C][C]13.2[/C][C]10.0163[/C][C]3.18372[/C][/ROW]
[ROW][C]31[/C][C]12.6[/C][C]9.67602[/C][C]2.92398[/C][/ROW]
[ROW][C]32[/C][C]5.6[/C][C]9.72267[/C][C]-4.12267[/C][/ROW]
[ROW][C]33[/C][C]9.9[/C][C]11.6488[/C][C]-1.74879[/C][/ROW]
[ROW][C]34[/C][C]8.8[/C][C]9.77741[/C][C]-0.97741[/C][/ROW]
[ROW][C]35[/C][C]7.7[/C][C]10.9608[/C][C]-3.26076[/C][/ROW]
[ROW][C]36[/C][C]9[/C][C]10.4844[/C][C]-1.4844[/C][/ROW]
[ROW][C]37[/C][C]7.3[/C][C]10.5332[/C][C]-3.23321[/C][/ROW]
[ROW][C]38[/C][C]11.4[/C][C]10.4064[/C][C]0.993567[/C][/ROW]
[ROW][C]39[/C][C]13.6[/C][C]10.3925[/C][C]3.2075[/C][/ROW]
[ROW][C]40[/C][C]7.9[/C][C]9.74831[/C][C]-1.84831[/C][/ROW]
[ROW][C]41[/C][C]10.7[/C][C]10.1454[/C][C]0.554635[/C][/ROW]
[ROW][C]42[/C][C]10.3[/C][C]9.63748[/C][C]0.662521[/C][/ROW]
[ROW][C]43[/C][C]8.3[/C][C]9.36066[/C][C]-1.06066[/C][/ROW]
[ROW][C]44[/C][C]9.6[/C][C]10.8187[/C][C]-1.2187[/C][/ROW]
[ROW][C]45[/C][C]14.2[/C][C]10.9163[/C][C]3.28369[/C][/ROW]
[ROW][C]46[/C][C]8.5[/C][C]10.7504[/C][C]-2.25039[/C][/ROW]
[ROW][C]47[/C][C]13.5[/C][C]10.8852[/C][C]2.61482[/C][/ROW]
[ROW][C]48[/C][C]4.9[/C][C]9.53207[/C][C]-4.63207[/C][/ROW]
[ROW][C]49[/C][C]6.4[/C][C]10.5072[/C][C]-4.10715[/C][/ROW]
[ROW][C]50[/C][C]9.6[/C][C]11.4481[/C][C]-1.84814[/C][/ROW]
[ROW][C]51[/C][C]11.6[/C][C]10.6033[/C][C]0.996706[/C][/ROW]
[ROW][C]52[/C][C]11.1[/C][C]11.1557[/C][C]-0.0556541[/C][/ROW]
[/TABLE]
Source: https://freestatistics.org/blog/index.php?pk=268282&T=4

Globally Unique Identifier (entire table): ba.freestatistics.org/blog/index.php?pk=268282&T=4

As an alternative you can also use a QR Code:  

The GUIDs for individual cells are displayed in the table below:

Multiple Linear Regression - Actuals, Interpolation, and Residuals
Time or IndexActualsInterpolationForecastResidualsPrediction Error
111.310.69050.609528
29.610.7159-1.11595
316.19.814936.28507
413.410.88332.51672
512.711.25351.44651
612.39.111373.18863
77.910.8799-2.97986
812.310.69261.60742
911.69.204792.39521
106.710.183-3.48299
1112.110.69681.40319
125.78.20146-2.50146
13810.7186-2.71859
1413.311.22842.07159
159.110.7916-1.69158
1612.210.49891.70114
178.810.5537-1.75374
1814.612.14962.45036
1912.611.27541.32459
209.98.914180.985823
2110.510.7569-0.256872
2213.49.598033.80197
2310.99.605071.29493
244.39.47501-5.17501
2510.310.3973-0.0972741
2611.810.77021.02982
2711.210.45550.744544
2811.49.143392.25661
298.610.5131-1.91314
3013.210.01633.18372
3112.69.676022.92398
325.69.72267-4.12267
339.911.6488-1.74879
348.89.77741-0.97741
357.710.9608-3.26076
36910.4844-1.4844
377.310.5332-3.23321
3811.410.40640.993567
3913.610.39253.2075
407.99.74831-1.84831
4110.710.14540.554635
4210.39.637480.662521
438.39.36066-1.06066
449.610.8187-1.2187
4514.210.91633.28369
468.510.7504-2.25039
4713.510.88522.61482
484.99.53207-4.63207
496.410.5072-4.10715
509.611.4481-1.84814
5111.610.60330.996706
5211.111.1557-0.0556541


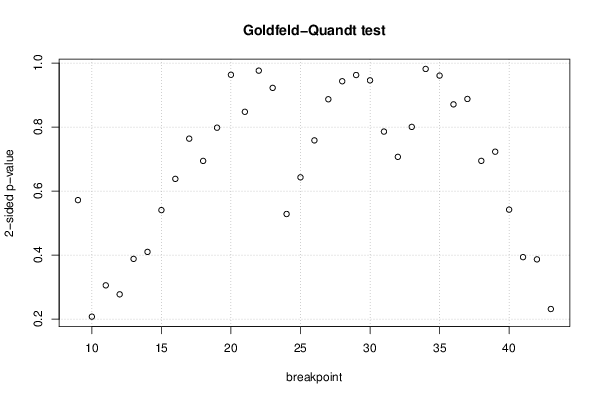
Goldfeld-Quandt test for Heteroskedasticity
p-valuesAlternative Hypothesis
breakpoint indexgreater2-sidedless
90.7140320.5719360.285968
100.8961440.2077130.103856
110.8472140.3055720.152786
120.8612620.2774770.138738
130.8058980.3882040.194102
140.7950180.4099650.204982
150.7296840.5406320.270316
160.6808820.6382350.319118
170.6180750.763850.381925
180.6528310.6943380.347169
190.6009630.7980750.399037
200.5182960.9634090.481704
210.4239030.8478050.576097
220.5118130.9763740.488187
230.4612680.9225370.538732
240.7357840.5284320.264216
250.6784590.6430820.321541
260.6207360.7585280.379264
270.5565160.8869680.443484
280.5283520.9432950.471648
290.4813480.9626960.518652
300.5269610.9460790.473039
310.6070050.7859890.392995
320.6465010.7069990.353499
330.5996680.8006640.400332
340.5091520.9816960.490848
350.5195590.9608830.480441
360.4355180.8710360.564482
370.4439730.8879460.556027
380.3472480.6944960.652752
390.3615320.7230650.638468
400.2710450.542090.728955
410.1968410.3936820.803159
420.193360.3867210.80664
430.1157980.2315970.884202

\begin{tabular}{lllllllll}
\hline
Goldfeld-Quandt test for Heteroskedasticity \tabularnewline
p-values & Alternative Hypothesis \tabularnewline
breakpoint index & greater & 2-sided & less \tabularnewline
9 & 0.714032 & 0.571936 & 0.285968 \tabularnewline
10 & 0.896144 & 0.207713 & 0.103856 \tabularnewline
11 & 0.847214 & 0.305572 & 0.152786 \tabularnewline
12 & 0.861262 & 0.277477 & 0.138738 \tabularnewline
13 & 0.805898 & 0.388204 & 0.194102 \tabularnewline
14 & 0.795018 & 0.409965 & 0.204982 \tabularnewline
15 & 0.729684 & 0.540632 & 0.270316 \tabularnewline
16 & 0.680882 & 0.638235 & 0.319118 \tabularnewline
17 & 0.618075 & 0.76385 & 0.381925 \tabularnewline
18 & 0.652831 & 0.694338 & 0.347169 \tabularnewline
19 & 0.600963 & 0.798075 & 0.399037 \tabularnewline
20 & 0.518296 & 0.963409 & 0.481704 \tabularnewline
21 & 0.423903 & 0.847805 & 0.576097 \tabularnewline
22 & 0.511813 & 0.976374 & 0.488187 \tabularnewline
23 & 0.461268 & 0.922537 & 0.538732 \tabularnewline
24 & 0.735784 & 0.528432 & 0.264216 \tabularnewline
25 & 0.678459 & 0.643082 & 0.321541 \tabularnewline
26 & 0.620736 & 0.758528 & 0.379264 \tabularnewline
27 & 0.556516 & 0.886968 & 0.443484 \tabularnewline
28 & 0.528352 & 0.943295 & 0.471648 \tabularnewline
29 & 0.481348 & 0.962696 & 0.518652 \tabularnewline
30 & 0.526961 & 0.946079 & 0.473039 \tabularnewline
31 & 0.607005 & 0.785989 & 0.392995 \tabularnewline
32 & 0.646501 & 0.706999 & 0.353499 \tabularnewline
33 & 0.599668 & 0.800664 & 0.400332 \tabularnewline
34 & 0.509152 & 0.981696 & 0.490848 \tabularnewline
35 & 0.519559 & 0.960883 & 0.480441 \tabularnewline
36 & 0.435518 & 0.871036 & 0.564482 \tabularnewline
37 & 0.443973 & 0.887946 & 0.556027 \tabularnewline
38 & 0.347248 & 0.694496 & 0.652752 \tabularnewline
39 & 0.361532 & 0.723065 & 0.638468 \tabularnewline
40 & 0.271045 & 0.54209 & 0.728955 \tabularnewline
41 & 0.196841 & 0.393682 & 0.803159 \tabularnewline
42 & 0.19336 & 0.386721 & 0.80664 \tabularnewline
43 & 0.115798 & 0.231597 & 0.884202 \tabularnewline
\hline
\end{tabular}
%Source: https://freestatistics.org/blog/index.php?pk=268282&T=5

[TABLE]
[ROW][C]Goldfeld-Quandt test for Heteroskedasticity[/C][/ROW]
[ROW][C]p-values[/C][C]Alternative Hypothesis[/C][/ROW]
[ROW][C]breakpoint index[/C][C]greater[/C][C]2-sided[/C][C]less[/C][/ROW]
[ROW][C]9[/C][C]0.714032[/C][C]0.571936[/C][C]0.285968[/C][/ROW]
[ROW][C]10[/C][C]0.896144[/C][C]0.207713[/C][C]0.103856[/C][/ROW]
[ROW][C]11[/C][C]0.847214[/C][C]0.305572[/C][C]0.152786[/C][/ROW]
[ROW][C]12[/C][C]0.861262[/C][C]0.277477[/C][C]0.138738[/C][/ROW]
[ROW][C]13[/C][C]0.805898[/C][C]0.388204[/C][C]0.194102[/C][/ROW]
[ROW][C]14[/C][C]0.795018[/C][C]0.409965[/C][C]0.204982[/C][/ROW]
[ROW][C]15[/C][C]0.729684[/C][C]0.540632[/C][C]0.270316[/C][/ROW]
[ROW][C]16[/C][C]0.680882[/C][C]0.638235[/C][C]0.319118[/C][/ROW]
[ROW][C]17[/C][C]0.618075[/C][C]0.76385[/C][C]0.381925[/C][/ROW]
[ROW][C]18[/C][C]0.652831[/C][C]0.694338[/C][C]0.347169[/C][/ROW]
[ROW][C]19[/C][C]0.600963[/C][C]0.798075[/C][C]0.399037[/C][/ROW]
[ROW][C]20[/C][C]0.518296[/C][C]0.963409[/C][C]0.481704[/C][/ROW]
[ROW][C]21[/C][C]0.423903[/C][C]0.847805[/C][C]0.576097[/C][/ROW]
[ROW][C]22[/C][C]0.511813[/C][C]0.976374[/C][C]0.488187[/C][/ROW]
[ROW][C]23[/C][C]0.461268[/C][C]0.922537[/C][C]0.538732[/C][/ROW]
[ROW][C]24[/C][C]0.735784[/C][C]0.528432[/C][C]0.264216[/C][/ROW]
[ROW][C]25[/C][C]0.678459[/C][C]0.643082[/C][C]0.321541[/C][/ROW]
[ROW][C]26[/C][C]0.620736[/C][C]0.758528[/C][C]0.379264[/C][/ROW]
[ROW][C]27[/C][C]0.556516[/C][C]0.886968[/C][C]0.443484[/C][/ROW]
[ROW][C]28[/C][C]0.528352[/C][C]0.943295[/C][C]0.471648[/C][/ROW]
[ROW][C]29[/C][C]0.481348[/C][C]0.962696[/C][C]0.518652[/C][/ROW]
[ROW][C]30[/C][C]0.526961[/C][C]0.946079[/C][C]0.473039[/C][/ROW]
[ROW][C]31[/C][C]0.607005[/C][C]0.785989[/C][C]0.392995[/C][/ROW]
[ROW][C]32[/C][C]0.646501[/C][C]0.706999[/C][C]0.353499[/C][/ROW]
[ROW][C]33[/C][C]0.599668[/C][C]0.800664[/C][C]0.400332[/C][/ROW]
[ROW][C]34[/C][C]0.509152[/C][C]0.981696[/C][C]0.490848[/C][/ROW]
[ROW][C]35[/C][C]0.519559[/C][C]0.960883[/C][C]0.480441[/C][/ROW]
[ROW][C]36[/C][C]0.435518[/C][C]0.871036[/C][C]0.564482[/C][/ROW]
[ROW][C]37[/C][C]0.443973[/C][C]0.887946[/C][C]0.556027[/C][/ROW]
[ROW][C]38[/C][C]0.347248[/C][C]0.694496[/C][C]0.652752[/C][/ROW]
[ROW][C]39[/C][C]0.361532[/C][C]0.723065[/C][C]0.638468[/C][/ROW]
[ROW][C]40[/C][C]0.271045[/C][C]0.54209[/C][C]0.728955[/C][/ROW]
[ROW][C]41[/C][C]0.196841[/C][C]0.393682[/C][C]0.803159[/C][/ROW]
[ROW][C]42[/C][C]0.19336[/C][C]0.386721[/C][C]0.80664[/C][/ROW]
[ROW][C]43[/C][C]0.115798[/C][C]0.231597[/C][C]0.884202[/C][/ROW]
[/TABLE]
Source: https://freestatistics.org/blog/index.php?pk=268282&T=5

Globally Unique Identifier (entire table): ba.freestatistics.org/blog/index.php?pk=268282&T=5

As an alternative you can also use a QR Code:  

The GUIDs for individual cells are displayed in the table below:

Goldfeld-Quandt test for Heteroskedasticity
p-valuesAlternative Hypothesis
breakpoint indexgreater2-sidedless
90.7140320.5719360.285968
100.8961440.2077130.103856
110.8472140.3055720.152786
120.8612620.2774770.138738
130.8058980.3882040.194102
140.7950180.4099650.204982
150.7296840.5406320.270316
160.6808820.6382350.319118
170.6180750.763850.381925
180.6528310.6943380.347169
190.6009630.7980750.399037
200.5182960.9634090.481704
210.4239030.8478050.576097
220.5118130.9763740.488187
230.4612680.9225370.538732
240.7357840.5284320.264216
250.6784590.6430820.321541
260.6207360.7585280.379264
270.5565160.8869680.443484
280.5283520.9432950.471648
290.4813480.9626960.518652
300.5269610.9460790.473039
310.6070050.7859890.392995
320.6465010.7069990.353499
330.5996680.8006640.400332
340.5091520.9816960.490848
350.5195590.9608830.480441
360.4355180.8710360.564482
370.4439730.8879460.556027
380.3472480.6944960.652752
390.3615320.7230650.638468
400.2710450.542090.728955
410.1968410.3936820.803159
420.193360.3867210.80664
430.1157980.2315970.884202


Meta Analysis of Goldfeld-Quandt test for Heteroskedasticity
Description# significant tests% significant testsOK/NOK
1% type I error level00OK
5% type I error level00OK
10% type I error level00OK

\begin{tabular}{lllllllll}
\hline
Meta Analysis of Goldfeld-Quandt test for Heteroskedasticity \tabularnewline
Description & # significant tests & % significant tests & OK/NOK \tabularnewline
1% type I error level & 0 & 0 & OK \tabularnewline
5% type I error level & 0 & 0 & OK \tabularnewline
10% type I error level & 0 & 0 & OK \tabularnewline
\hline
\end{tabular}
%Source: https://freestatistics.org/blog/index.php?pk=268282&T=6

[TABLE]
[ROW][C]Meta Analysis of Goldfeld-Quandt test for Heteroskedasticity[/C][/ROW]
[ROW][C]Description[/C][C]# significant tests[/C][C]% significant tests[/C][C]OK/NOK[/C][/ROW]
[ROW][C]1% type I error level[/C][C]0[/C][C]0[/C][C]OK[/C][/ROW]
[ROW][C]5% type I error level[/C][C]0[/C][C]0[/C][C]OK[/C][/ROW]
[ROW][C]10% type I error level[/C][C]0[/C][C]0[/C][C]OK[/C][/ROW]
[/TABLE]
Source: https://freestatistics.org/blog/index.php?pk=268282&T=6

Globally Unique Identifier (entire table): ba.freestatistics.org/blog/index.php?pk=268282&T=6

As an alternative you can also use a QR Code:  

The GUIDs for individual cells are displayed in the table below:

Meta Analysis of Goldfeld-Quandt test for Heteroskedasticity
Description# significant tests% significant testsOK/NOK
1% type I error level00OK
5% type I error level00OK
10% type I error level00OK


Parameters (Session):
par1 = 1 ; par2 = Do not include Seasonal Dummies ; par3 = No Linear Trend ;
Parameters (R input):
par1 = 1 ; par2 = Do not include Seasonal Dummies ; par3 = No Linear Trend ;
R code (references can be found in the software module):
library(lattice)
library(lmtest)
n25 <- 25 #minimum number of obs. for Goldfeld-Quandt test
par1 <- as.numeric(par1)
x <- t(y)
k <- length(x[1,])
n <- length(x[,1])
x1 <- cbind(x[,par1], x[,1:k!=par1])
mycolnames <- c(colnames(x)[par1], colnames(x)[1:k!=par1])
colnames(x1) <- mycolnames #colnames(x)[par1]
x <- x1
if (par3 == 'First Differences'){
x2 <- array(0, dim=c(n-1,k), dimnames=list(1:(n-1), paste('(1-B)',colnames(x),sep='')))
for (i in 1:n-1) {
for (j in 1:k) {
x2[i,j] <- x[i+1,j] - x[i,j]
}
}
x <- x2
}
if (par2 == 'Include Monthly Dummies'){
x2 <- array(0, dim=c(n,11), dimnames=list(1:n, paste('M', seq(1:11), sep ='')))
for (i in 1:11){
x2[seq(i,n,12),i] <- 1
}
x <- cbind(x, x2)
}
if (par2 == 'Include Quarterly Dummies'){
x2 <- array(0, dim=c(n,3), dimnames=list(1:n, paste('Q', seq(1:3), sep ='')))
for (i in 1:3){
x2[seq(i,n,4),i] <- 1
}
x <- cbind(x, x2)
}
k <- length(x[1,])
if (par3 == 'Linear Trend'){
x <- cbind(x, c(1:n))
colnames(x)[k+1] <- 't'
}
x
k <- length(x[1,])
df <- as.data.frame(x)
(mylm <- lm(df))
(mysum <- summary(mylm))
if (n > n25) {
kp3 <- k + 3
nmkm3 <- n - k - 3
gqarr <- array(NA, dim=c(nmkm3-kp3+1,3))
numgqtests <- 0
numsignificant1 <- 0
numsignificant5 <- 0
numsignificant10 <- 0
for (mypoint in kp3:nmkm3) {
j <- 0
numgqtests <- numgqtests + 1
for (myalt in c('greater', 'two.sided', 'less')) {
j <- j + 1
gqarr[mypoint-kp3+1,j] <- gqtest(mylm, point=mypoint, alternative=myalt)$p.value
}
if (gqarr[mypoint-kp3+1,2] < 0.01) numsignificant1 <- numsignificant1 + 1
if (gqarr[mypoint-kp3+1,2] < 0.05) numsignificant5 <- numsignificant5 + 1
if (gqarr[mypoint-kp3+1,2] < 0.10) numsignificant10 <- numsignificant10 + 1
}
gqarr
}
bitmap(file='test0.png')
plot(x[,1], type='l', main='Actuals and Interpolation', ylab='value of Actuals and Interpolation (dots)', xlab='time or index')
points(x[,1]-mysum$resid)
grid()
dev.off()
bitmap(file='test1.png')
plot(mysum$resid, type='b', pch=19, main='Residuals', ylab='value of Residuals', xlab='time or index')
grid()
dev.off()
bitmap(file='test2.png')
hist(mysum$resid, main='Residual Histogram', xlab='values of Residuals')
grid()
dev.off()
bitmap(file='test3.png')
densityplot(~mysum$resid,col='black',main='Residual Density Plot', xlab='values of Residuals')
dev.off()
bitmap(file='test4.png')
qqnorm(mysum$resid, main='Residual Normal Q-Q Plot')
qqline(mysum$resid)
grid()
dev.off()
(myerror <- as.ts(mysum$resid))
bitmap(file='test5.png')
dum <- cbind(lag(myerror,k=1),myerror)
dum
dum1 <- dum[2:length(myerror),]
dum1
z <- as.data.frame(dum1)
z
plot(z,main=paste('Residual Lag plot, lowess, and regression line'), ylab='values of Residuals', xlab='lagged values of Residuals')
lines(lowess(z))
abline(lm(z))
grid()
dev.off()
bitmap(file='test6.png')
acf(mysum$resid, lag.max=length(mysum$resid)/2, main='Residual Autocorrelation Function')
grid()
dev.off()
bitmap(file='test7.png')
pacf(mysum$resid, lag.max=length(mysum$resid)/2, main='Residual Partial Autocorrelation Function')
grid()
dev.off()
bitmap(file='test8.png')
opar <- par(mfrow = c(2,2), oma = c(0, 0, 1.1, 0))
plot(mylm, las = 1, sub='Residual Diagnostics')
par(opar)
dev.off()
if (n > n25) {
bitmap(file='test9.png')
plot(kp3:nmkm3,gqarr[,2], main='Goldfeld-Quandt test',ylab='2-sided p-value',xlab='breakpoint')
grid()
dev.off()
}
load(file='createtable')
a<-table.start()
a<-table.row.start(a)
a<-table.element(a, 'Multiple Linear Regression - Estimated Regression Equation', 1, TRUE)
a<-table.row.end(a)
myeq <- colnames(x)[1]
myeq <- paste(myeq, '[t] = ', sep='')
for (i in 1:k){
if (mysum$coefficients[i,1] > 0) myeq <- paste(myeq, '+', '')
myeq <- paste(myeq, signif(mysum$coefficients[i,1],6), sep=' ')
if (rownames(mysum$coefficients)[i] != '(Intercept)') {
myeq <- paste(myeq, rownames(mysum$coefficients)[i], sep='')
if (rownames(mysum$coefficients)[i] != 't') myeq <- paste(myeq, '[t]', sep='')
}
}
myeq <- paste(myeq, ' + e[t]')
a<-table.row.start(a)
a<-table.element(a, myeq)
a<-table.row.end(a)
a<-table.end(a)
table.save(a,file='mytable1.tab')
a<-table.start()
a<-table.row.start(a)
a<-table.element(a,hyperlink('ols1.htm','Multiple Linear Regression - Ordinary Least Squares',''), 6, TRUE)
a<-table.row.end(a)
a<-table.row.start(a)
a<-table.element(a,'Variable',header=TRUE)
a<-table.element(a,'Parameter',header=TRUE)
a<-table.element(a,'S.D.',header=TRUE)
a<-table.element(a,'T-STAT
H0: parameter = 0',header=TRUE)
a<-table.element(a,'2-tail p-value',header=TRUE)
a<-table.element(a,'1-tail p-value',header=TRUE)
a<-table.row.end(a)
for (i in 1:k){
a<-table.row.start(a)
a<-table.element(a,rownames(mysum$coefficients)[i],header=TRUE)
a<-table.element(a,signif(mysum$coefficients[i,1],6))
a<-table.element(a, signif(mysum$coefficients[i,2],6))
a<-table.element(a, signif(mysum$coefficients[i,3],4))
a<-table.element(a, signif(mysum$coefficients[i,4],6))
a<-table.element(a, signif(mysum$coefficients[i,4]/2,6))
a<-table.row.end(a)
}
a<-table.end(a)
table.save(a,file='mytable2.tab')
a<-table.start()
a<-table.row.start(a)
a<-table.element(a, 'Multiple Linear Regression - Regression Statistics', 2, TRUE)
a<-table.row.end(a)
a<-table.row.start(a)
a<-table.element(a, 'Multiple R',1,TRUE)
a<-table.element(a, signif(sqrt(mysum$r.squared),6))
a<-table.row.end(a)
a<-table.row.start(a)
a<-table.element(a, 'R-squared',1,TRUE)
a<-table.element(a, signif(mysum$r.squared,6))
a<-table.row.end(a)
a<-table.row.start(a)
a<-table.element(a, 'Adjusted R-squared',1,TRUE)
a<-table.element(a, signif(mysum$adj.r.squared,6))
a<-table.row.end(a)
a<-table.row.start(a)
a<-table.element(a, 'F-TEST (value)',1,TRUE)
a<-table.element(a, signif(mysum$fstatistic[1],6))
a<-table.row.end(a)
a<-table.row.start(a)
a<-table.element(a, 'F-TEST (DF numerator)',1,TRUE)
a<-table.element(a, signif(mysum$fstatistic[2],6))
a<-table.row.end(a)
a<-table.row.start(a)
a<-table.element(a, 'F-TEST (DF denominator)',1,TRUE)
a<-table.element(a, signif(mysum$fstatistic[3],6))
a<-table.row.end(a)
a<-table.row.start(a)
a<-table.element(a, 'p-value',1,TRUE)
a<-table.element(a, signif(1-pf(mysum$fstatistic[1],mysum$fstatistic[2],mysum$fstatistic[3]),6))
a<-table.row.end(a)
a<-table.row.start(a)
a<-table.element(a, 'Multiple Linear Regression - Residual Statistics', 2, TRUE)
a<-table.row.end(a)
a<-table.row.start(a)
a<-table.element(a, 'Residual Standard Deviation',1,TRUE)
a<-table.element(a, signif(mysum$sigma,6))
a<-table.row.end(a)
a<-table.row.start(a)
a<-table.element(a, 'Sum Squared Residuals',1,TRUE)
a<-table.element(a, signif(sum(myerror*myerror),6))
a<-table.row.end(a)
a<-table.end(a)
table.save(a,file='mytable3.tab')
a<-table.start()
a<-table.row.start(a)
a<-table.element(a, 'Multiple Linear Regression - Actuals, Interpolation, and Residuals', 4, TRUE)
a<-table.row.end(a)
a<-table.row.start(a)
a<-table.element(a, 'Time or Index', 1, TRUE)
a<-table.element(a, 'Actuals', 1, TRUE)
a<-table.element(a, 'Interpolation
Forecast', 1, TRUE)
a<-table.element(a, 'Residuals
Prediction Error', 1, TRUE)
a<-table.row.end(a)
for (i in 1:n) {
a<-table.row.start(a)
a<-table.element(a,i, 1, TRUE)
a<-table.element(a,signif(x[i],6))
a<-table.element(a,signif(x[i]-mysum$resid[i],6))
a<-table.element(a,signif(mysum$resid[i],6))
a<-table.row.end(a)
}
a<-table.end(a)
table.save(a,file='mytable4.tab')
if (n > n25) {
a<-table.start()
a<-table.row.start(a)
a<-table.element(a,'Goldfeld-Quandt test for Heteroskedasticity',4,TRUE)
a<-table.row.end(a)
a<-table.row.start(a)
a<-table.element(a,'p-values',header=TRUE)
a<-table.element(a,'Alternative Hypothesis',3,header=TRUE)
a<-table.row.end(a)
a<-table.row.start(a)
a<-table.element(a,'breakpoint index',header=TRUE)
a<-table.element(a,'greater',header=TRUE)
a<-table.element(a,'2-sided',header=TRUE)
a<-table.element(a,'less',header=TRUE)
a<-table.row.end(a)
for (mypoint in kp3:nmkm3) {
a<-table.row.start(a)
a<-table.element(a,mypoint,header=TRUE)
a<-table.element(a,signif(gqarr[mypoint-kp3+1,1],6))
a<-table.element(a,signif(gqarr[mypoint-kp3+1,2],6))
a<-table.element(a,signif(gqarr[mypoint-kp3+1,3],6))
a<-table.row.end(a)
}
a<-table.end(a)
table.save(a,file='mytable5.tab')
a<-table.start()
a<-table.row.start(a)
a<-table.element(a,'Meta Analysis of Goldfeld-Quandt test for Heteroskedasticity',4,TRUE)
a<-table.row.end(a)
a<-table.row.start(a)
a<-table.element(a,'Description',header=TRUE)
a<-table.element(a,'# significant tests',header=TRUE)
a<-table.element(a,'% significant tests',header=TRUE)
a<-table.element(a,'OK/NOK',header=TRUE)
a<-table.row.end(a)
a<-table.row.start(a)
a<-table.element(a,'1% type I error level',header=TRUE)
a<-table.element(a,signif(numsignificant1,6))
a<-table.element(a,signif(numsignificant1/numgqtests,6))
if (numsignificant1/numgqtests < 0.01) dum <- 'OK' else dum <- 'NOK'
a<-table.element(a,dum)
a<-table.row.end(a)
a<-table.row.start(a)
a<-table.element(a,'5% type I error level',header=TRUE)
a<-table.element(a,signif(numsignificant5,6))
a<-table.element(a,signif(numsignificant5/numgqtests,6))
if (numsignificant5/numgqtests < 0.05) dum <- 'OK' else dum <- 'NOK'
a<-table.element(a,dum)
a<-table.row.end(a)
a<-table.row.start(a)
a<-table.element(a,'10% type I error level',header=TRUE)
a<-table.element(a,signif(numsignificant10,6))
a<-table.element(a,signif(numsignificant10/numgqtests,6))
if (numsignificant10/numgqtests < 0.1) dum <- 'OK' else dum <- 'NOK'
a<-table.element(a,dum)
a<-table.row.end(a)
a<-table.end(a)
table.save(a,file='mytable6.tab')
}