Free Statistics

of Irreproducible Research!

Author's title

Author*The author of this computation has been verified*
R Software Modulerwasp_multipleregression.wasp
Title produced by softwareMultiple Regression
Date of computationMon, 15 Dec 2014 13:20:22 +0000
Cite this page as followsStatistical Computations at FreeStatistics.org, Office for Research Development and Education, URL https://freestatistics.org/blog/index.php?v=date/2014/Dec/15/t1418649834xu85xn7308ugo72.htm/, Retrieved Thu, 16 May 2024 19:26:27 +0000
Statistical Computations at FreeStatistics.org, Office for Research Development and Education, URL https://freestatistics.org/blog/index.php?pk=268332, Retrieved Thu, 16 May 2024 19:26:27 +0000
QR Codes:

Original text written by user:
IsPrivate?No (this computation is public)
User-defined keywords
Estimated Impact73
Family? (F = Feedback message, R = changed R code, M = changed R Module, P = changed Parameters, D = changed Data)
-     [Chi-Squared Test, McNemar Test, and Fisher Exact Test] [P chi AMSIBconfstat] [2014-12-15 09:53:08] [46c7ebd23dbdec306a09830d8b7528e7]
- RM D    [Multiple Regression] [P MR MOTstress2] [2014-12-15 13:20:22] [9772ee27deeac3d50cc1fb84835cd7d6] [Current]
Feedback Forum

Post a new message
Dataseries X:
26 50 4 13
57 62 4 13
37 54 5 11
67 71 4 14
43 54 4 15
52 65 9 14
52 73 8 11
43 52 11 13
84 84 4 16
67 42 4 14
49 66 6 14
70 65 4 15
52 78 8 15
58 73 4 13
68 75 4 14
43 66 4 12
56 70 4 14
74 81 6 12
65 71 4 15
63 69 8 15
58 71 5 14
57 72 4 14
63 68 9 12
53 70 4 12
64 67 4 14
53 76 4 16
29 70 7 12
54 60 12 12
58 72 7 14
43 69 5 16
51 71 8 15
53 62 5 12
54 70 4 14
61 58 7 14
47 76 4 16
39 52 4 12
48 59 4 14
50 68 4 15
35 76 4 13
68 67 4 16
49 59 7 12
67 76 4 16
43 60 4 13
62 63 4 14
57 70 4 14
54 66 12 10
61 64 4 16
56 70 5 14
41 75 15 14
43 61 5 15
53 60 10 15
66 73 8 13
58 61 4 11
46 66 5 16
51 59 9 15
51 64 4 14
37 78 4 13
59 53 6 6
42 67 7 12
66 66 4 14
53 71 4 15


Summary of computational transaction
Raw Inputview raw input (R code)
Raw Outputview raw output of R engine
Computing time6 seconds
R Server'Sir Maurice George Kendall' @ kendall.wessa.net

\begin{tabular}{lllllllll}
\hline
Summary of computational transaction \tabularnewline
Raw Input & view raw input (R code)  \tabularnewline
Raw Output & view raw output of R engine  \tabularnewline
Computing time & 6 seconds \tabularnewline
R Server & 'Sir Maurice George Kendall' @ kendall.wessa.net \tabularnewline
\hline
\end{tabular}
%Source: https://freestatistics.org/blog/index.php?pk=268332&T=0

[TABLE]
[ROW][C]Summary of computational transaction[/C][/ROW]
[ROW][C]Raw Input[/C][C]view raw input (R code) [/C][/ROW]
[ROW][C]Raw Output[/C][C]view raw output of R engine [/C][/ROW]
[ROW][C]Computing time[/C][C]6 seconds[/C][/ROW]
[ROW][C]R Server[/C][C]'Sir Maurice George Kendall' @ kendall.wessa.net[/C][/ROW]
[/TABLE]
Source: https://freestatistics.org/blog/index.php?pk=268332&T=0

Globally Unique Identifier (entire table): ba.freestatistics.org/blog/index.php?pk=268332&T=0

As an alternative you can also use a QR Code:  

The GUIDs for individual cells are displayed in the table below:

Summary of computational transaction
Raw Inputview raw input (R code)
Raw Outputview raw output of R engine
Computing time6 seconds
R Server'Sir Maurice George Kendall' @ kendall.wessa.net


Multiple Linear Regression - Estimated Regression Equation
STRESSTOTS[t] = + 9.7871 + 0.0138059AMS.IS[t] + 0.0587431AMS.ES[t] -0.140068AMS.AS[t] + e[t]

\begin{tabular}{lllllllll}
\hline
Multiple Linear Regression - Estimated Regression Equation \tabularnewline
STRESSTOTS[t] =  +  9.7871 +  0.0138059AMS.IS[t] +  0.0587431AMS.ES[t] -0.140068AMS.AS[t]  + e[t] \tabularnewline
\hline
\end{tabular}
%Source: https://freestatistics.org/blog/index.php?pk=268332&T=1

[TABLE]
[ROW][C]Multiple Linear Regression - Estimated Regression Equation[/C][/ROW]
[ROW][C]STRESSTOTS[t] =  +  9.7871 +  0.0138059AMS.IS[t] +  0.0587431AMS.ES[t] -0.140068AMS.AS[t]  + e[t][/C][/ROW]
[/TABLE]
Source: https://freestatistics.org/blog/index.php?pk=268332&T=1

Globally Unique Identifier (entire table): ba.freestatistics.org/blog/index.php?pk=268332&T=1

As an alternative you can also use a QR Code:  

The GUIDs for individual cells are displayed in the table below:

Multiple Linear Regression - Estimated Regression Equation
STRESSTOTS[t] = + 9.7871 + 0.0138059AMS.IS[t] + 0.0587431AMS.ES[t] -0.140068AMS.AS[t] + e[t]


Multiple Linear Regression - Ordinary Least Squares
VariableParameterS.D.T-STATH0: parameter = 02-tail p-value1-tail p-value
(Intercept)9.78711.99854.8978.38575e-064.19287e-06
AMS.IS0.01380590.02090730.66030.5116960.255848
AMS.ES0.05874310.02814152.0870.04133190.0206659
AMS.AS-0.1400680.0877485-1.5960.1159640.0579822

\begin{tabular}{lllllllll}
\hline
Multiple Linear Regression - Ordinary Least Squares \tabularnewline
Variable & Parameter & S.D. & T-STATH0: parameter = 0 & 2-tail p-value & 1-tail p-value \tabularnewline
(Intercept) & 9.7871 & 1.9985 & 4.897 & 8.38575e-06 & 4.19287e-06 \tabularnewline
AMS.IS & 0.0138059 & 0.0209073 & 0.6603 & 0.511696 & 0.255848 \tabularnewline
AMS.ES & 0.0587431 & 0.0281415 & 2.087 & 0.0413319 & 0.0206659 \tabularnewline
AMS.AS & -0.140068 & 0.0877485 & -1.596 & 0.115964 & 0.0579822 \tabularnewline
\hline
\end{tabular}
%Source: https://freestatistics.org/blog/index.php?pk=268332&T=2

[TABLE]
[ROW][C]Multiple Linear Regression - Ordinary Least Squares[/C][/ROW]
[ROW][C]Variable[/C][C]Parameter[/C][C]S.D.[/C][C]T-STATH0: parameter = 0[/C][C]2-tail p-value[/C][C]1-tail p-value[/C][/ROW]
[ROW][C](Intercept)[/C][C]9.7871[/C][C]1.9985[/C][C]4.897[/C][C]8.38575e-06[/C][C]4.19287e-06[/C][/ROW]
[ROW][C]AMS.IS[/C][C]0.0138059[/C][C]0.0209073[/C][C]0.6603[/C][C]0.511696[/C][C]0.255848[/C][/ROW]
[ROW][C]AMS.ES[/C][C]0.0587431[/C][C]0.0281415[/C][C]2.087[/C][C]0.0413319[/C][C]0.0206659[/C][/ROW]
[ROW][C]AMS.AS[/C][C]-0.140068[/C][C]0.0877485[/C][C]-1.596[/C][C]0.115964[/C][C]0.0579822[/C][/ROW]
[/TABLE]
Source: https://freestatistics.org/blog/index.php?pk=268332&T=2

Globally Unique Identifier (entire table): ba.freestatistics.org/blog/index.php?pk=268332&T=2

As an alternative you can also use a QR Code:  

The GUIDs for individual cells are displayed in the table below:

Multiple Linear Regression - Ordinary Least Squares
VariableParameterS.D.T-STATH0: parameter = 02-tail p-value1-tail p-value
(Intercept)9.78711.99854.8978.38575e-064.19287e-06
AMS.IS0.01380590.02090730.66030.5116960.255848
AMS.ES0.05874310.02814152.0870.04133190.0206659
AMS.AS-0.1400680.0877485-1.5960.1159640.0579822


Multiple Linear Regression - Regression Statistics
Multiple R0.374103
R-squared0.139953
Adjusted R-squared0.0946872
F-TEST (value)3.09181
F-TEST (DF numerator)3
F-TEST (DF denominator)57
p-value0.0340518
Multiple Linear Regression - Residual Statistics
Residual Standard Deviation1.69346
Sum Squared Residuals163.465

\begin{tabular}{lllllllll}
\hline
Multiple Linear Regression - Regression Statistics \tabularnewline
Multiple R & 0.374103 \tabularnewline
R-squared & 0.139953 \tabularnewline
Adjusted R-squared & 0.0946872 \tabularnewline
F-TEST (value) & 3.09181 \tabularnewline
F-TEST (DF numerator) & 3 \tabularnewline
F-TEST (DF denominator) & 57 \tabularnewline
p-value & 0.0340518 \tabularnewline
Multiple Linear Regression - Residual Statistics \tabularnewline
Residual Standard Deviation & 1.69346 \tabularnewline
Sum Squared Residuals & 163.465 \tabularnewline
\hline
\end{tabular}
%Source: https://freestatistics.org/blog/index.php?pk=268332&T=3

[TABLE]
[ROW][C]Multiple Linear Regression - Regression Statistics[/C][/ROW]
[ROW][C]Multiple R[/C][C]0.374103[/C][/ROW]
[ROW][C]R-squared[/C][C]0.139953[/C][/ROW]
[ROW][C]Adjusted R-squared[/C][C]0.0946872[/C][/ROW]
[ROW][C]F-TEST (value)[/C][C]3.09181[/C][/ROW]
[ROW][C]F-TEST (DF numerator)[/C][C]3[/C][/ROW]
[ROW][C]F-TEST (DF denominator)[/C][C]57[/C][/ROW]
[ROW][C]p-value[/C][C]0.0340518[/C][/ROW]
[ROW][C]Multiple Linear Regression - Residual Statistics[/C][/ROW]
[ROW][C]Residual Standard Deviation[/C][C]1.69346[/C][/ROW]
[ROW][C]Sum Squared Residuals[/C][C]163.465[/C][/ROW]
[/TABLE]
Source: https://freestatistics.org/blog/index.php?pk=268332&T=3

Globally Unique Identifier (entire table): ba.freestatistics.org/blog/index.php?pk=268332&T=3

As an alternative you can also use a QR Code:  

The GUIDs for individual cells are displayed in the table below:

Multiple Linear Regression - Regression Statistics
Multiple R0.374103
R-squared0.139953
Adjusted R-squared0.0946872
F-TEST (value)3.09181
F-TEST (DF numerator)3
F-TEST (DF denominator)57
p-value0.0340518
Multiple Linear Regression - Residual Statistics
Residual Standard Deviation1.69346
Sum Squared Residuals163.465


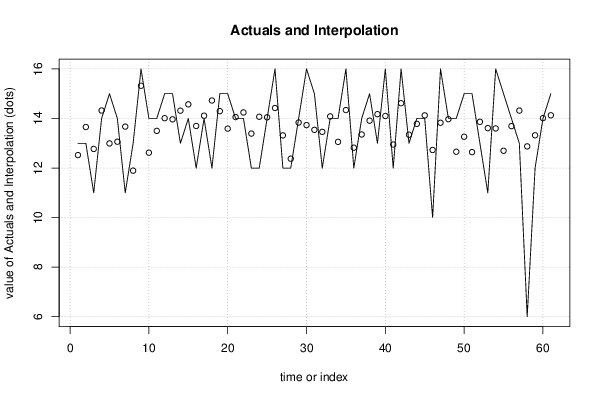
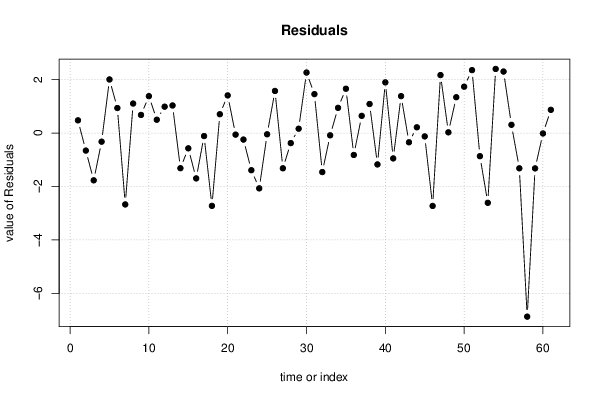
Multiple Linear Regression - Actuals, Interpolation, and Residuals
Time or IndexActualsInterpolationForecastResidualsPrediction Error
11312.52290.477062
21313.6558-0.65584
31112.7697-1.76971
41414.3226-0.322587
51512.99262.00739
61413.06270.937301
71113.6727-2.67271
81311.89461.10535
91615.32090.679051
101412.6191.38096
111413.50020.499771
121514.01150.988454
131513.96641.03357
141314.3158-1.31582
151414.5714-0.571366
161213.6975-1.69753
171414.112-0.111979
181214.7265-2.72652
191514.2950.705025
201513.58961.41039
211414.0583-0.0582657
221414.2433-0.243271
231213.3908-1.39079
241214.0706-2.07056
251414.0462-0.046197
261614.4231.57698
271213.319-1.31901
281212.3764-0.376391
291413.83690.163127
301613.73372.26631
311513.54141.45858
321213.4605-1.46055
331414.0844-0.0843669
341413.05590.944113
351614.34021.65982
361212.8199-0.819902
371413.35540.644643
381513.91171.08834
391314.1745-1.17451
401614.10141.89858
411212.949-0.948959
421614.61631.3837
431313.3451-0.34507
441413.78360.216387
451414.1258-0.125785
461012.7289-2.72885
471613.82852.17145
481413.97190.0280893
491412.65791.34214
501513.26371.73625
511512.64272.35728
521313.866-0.865995
531113.6109-2.6109
541613.59892.40112
551512.69642.30357
561413.69050.30951
571314.3196-1.31961
58612.8746-6.87463
591213.3223-1.32226
601414.0151-0.0150657
611514.12930.870696

\begin{tabular}{lllllllll}
\hline
Multiple Linear Regression - Actuals, Interpolation, and Residuals \tabularnewline
Time or Index & Actuals & InterpolationForecast & ResidualsPrediction Error \tabularnewline
1 & 13 & 12.5229 & 0.477062 \tabularnewline
2 & 13 & 13.6558 & -0.65584 \tabularnewline
3 & 11 & 12.7697 & -1.76971 \tabularnewline
4 & 14 & 14.3226 & -0.322587 \tabularnewline
5 & 15 & 12.9926 & 2.00739 \tabularnewline
6 & 14 & 13.0627 & 0.937301 \tabularnewline
7 & 11 & 13.6727 & -2.67271 \tabularnewline
8 & 13 & 11.8946 & 1.10535 \tabularnewline
9 & 16 & 15.3209 & 0.679051 \tabularnewline
10 & 14 & 12.619 & 1.38096 \tabularnewline
11 & 14 & 13.5002 & 0.499771 \tabularnewline
12 & 15 & 14.0115 & 0.988454 \tabularnewline
13 & 15 & 13.9664 & 1.03357 \tabularnewline
14 & 13 & 14.3158 & -1.31582 \tabularnewline
15 & 14 & 14.5714 & -0.571366 \tabularnewline
16 & 12 & 13.6975 & -1.69753 \tabularnewline
17 & 14 & 14.112 & -0.111979 \tabularnewline
18 & 12 & 14.7265 & -2.72652 \tabularnewline
19 & 15 & 14.295 & 0.705025 \tabularnewline
20 & 15 & 13.5896 & 1.41039 \tabularnewline
21 & 14 & 14.0583 & -0.0582657 \tabularnewline
22 & 14 & 14.2433 & -0.243271 \tabularnewline
23 & 12 & 13.3908 & -1.39079 \tabularnewline
24 & 12 & 14.0706 & -2.07056 \tabularnewline
25 & 14 & 14.0462 & -0.046197 \tabularnewline
26 & 16 & 14.423 & 1.57698 \tabularnewline
27 & 12 & 13.319 & -1.31901 \tabularnewline
28 & 12 & 12.3764 & -0.376391 \tabularnewline
29 & 14 & 13.8369 & 0.163127 \tabularnewline
30 & 16 & 13.7337 & 2.26631 \tabularnewline
31 & 15 & 13.5414 & 1.45858 \tabularnewline
32 & 12 & 13.4605 & -1.46055 \tabularnewline
33 & 14 & 14.0844 & -0.0843669 \tabularnewline
34 & 14 & 13.0559 & 0.944113 \tabularnewline
35 & 16 & 14.3402 & 1.65982 \tabularnewline
36 & 12 & 12.8199 & -0.819902 \tabularnewline
37 & 14 & 13.3554 & 0.644643 \tabularnewline
38 & 15 & 13.9117 & 1.08834 \tabularnewline
39 & 13 & 14.1745 & -1.17451 \tabularnewline
40 & 16 & 14.1014 & 1.89858 \tabularnewline
41 & 12 & 12.949 & -0.948959 \tabularnewline
42 & 16 & 14.6163 & 1.3837 \tabularnewline
43 & 13 & 13.3451 & -0.34507 \tabularnewline
44 & 14 & 13.7836 & 0.216387 \tabularnewline
45 & 14 & 14.1258 & -0.125785 \tabularnewline
46 & 10 & 12.7289 & -2.72885 \tabularnewline
47 & 16 & 13.8285 & 2.17145 \tabularnewline
48 & 14 & 13.9719 & 0.0280893 \tabularnewline
49 & 14 & 12.6579 & 1.34214 \tabularnewline
50 & 15 & 13.2637 & 1.73625 \tabularnewline
51 & 15 & 12.6427 & 2.35728 \tabularnewline
52 & 13 & 13.866 & -0.865995 \tabularnewline
53 & 11 & 13.6109 & -2.6109 \tabularnewline
54 & 16 & 13.5989 & 2.40112 \tabularnewline
55 & 15 & 12.6964 & 2.30357 \tabularnewline
56 & 14 & 13.6905 & 0.30951 \tabularnewline
57 & 13 & 14.3196 & -1.31961 \tabularnewline
58 & 6 & 12.8746 & -6.87463 \tabularnewline
59 & 12 & 13.3223 & -1.32226 \tabularnewline
60 & 14 & 14.0151 & -0.0150657 \tabularnewline
61 & 15 & 14.1293 & 0.870696 \tabularnewline
\hline
\end{tabular}
%Source: https://freestatistics.org/blog/index.php?pk=268332&T=4

[TABLE]
[ROW][C]Multiple Linear Regression - Actuals, Interpolation, and Residuals[/C][/ROW]
[ROW][C]Time or Index[/C][C]Actuals[/C][C]InterpolationForecast[/C][C]ResidualsPrediction Error[/C][/ROW]
[ROW][C]1[/C][C]13[/C][C]12.5229[/C][C]0.477062[/C][/ROW]
[ROW][C]2[/C][C]13[/C][C]13.6558[/C][C]-0.65584[/C][/ROW]
[ROW][C]3[/C][C]11[/C][C]12.7697[/C][C]-1.76971[/C][/ROW]
[ROW][C]4[/C][C]14[/C][C]14.3226[/C][C]-0.322587[/C][/ROW]
[ROW][C]5[/C][C]15[/C][C]12.9926[/C][C]2.00739[/C][/ROW]
[ROW][C]6[/C][C]14[/C][C]13.0627[/C][C]0.937301[/C][/ROW]
[ROW][C]7[/C][C]11[/C][C]13.6727[/C][C]-2.67271[/C][/ROW]
[ROW][C]8[/C][C]13[/C][C]11.8946[/C][C]1.10535[/C][/ROW]
[ROW][C]9[/C][C]16[/C][C]15.3209[/C][C]0.679051[/C][/ROW]
[ROW][C]10[/C][C]14[/C][C]12.619[/C][C]1.38096[/C][/ROW]
[ROW][C]11[/C][C]14[/C][C]13.5002[/C][C]0.499771[/C][/ROW]
[ROW][C]12[/C][C]15[/C][C]14.0115[/C][C]0.988454[/C][/ROW]
[ROW][C]13[/C][C]15[/C][C]13.9664[/C][C]1.03357[/C][/ROW]
[ROW][C]14[/C][C]13[/C][C]14.3158[/C][C]-1.31582[/C][/ROW]
[ROW][C]15[/C][C]14[/C][C]14.5714[/C][C]-0.571366[/C][/ROW]
[ROW][C]16[/C][C]12[/C][C]13.6975[/C][C]-1.69753[/C][/ROW]
[ROW][C]17[/C][C]14[/C][C]14.112[/C][C]-0.111979[/C][/ROW]
[ROW][C]18[/C][C]12[/C][C]14.7265[/C][C]-2.72652[/C][/ROW]
[ROW][C]19[/C][C]15[/C][C]14.295[/C][C]0.705025[/C][/ROW]
[ROW][C]20[/C][C]15[/C][C]13.5896[/C][C]1.41039[/C][/ROW]
[ROW][C]21[/C][C]14[/C][C]14.0583[/C][C]-0.0582657[/C][/ROW]
[ROW][C]22[/C][C]14[/C][C]14.2433[/C][C]-0.243271[/C][/ROW]
[ROW][C]23[/C][C]12[/C][C]13.3908[/C][C]-1.39079[/C][/ROW]
[ROW][C]24[/C][C]12[/C][C]14.0706[/C][C]-2.07056[/C][/ROW]
[ROW][C]25[/C][C]14[/C][C]14.0462[/C][C]-0.046197[/C][/ROW]
[ROW][C]26[/C][C]16[/C][C]14.423[/C][C]1.57698[/C][/ROW]
[ROW][C]27[/C][C]12[/C][C]13.319[/C][C]-1.31901[/C][/ROW]
[ROW][C]28[/C][C]12[/C][C]12.3764[/C][C]-0.376391[/C][/ROW]
[ROW][C]29[/C][C]14[/C][C]13.8369[/C][C]0.163127[/C][/ROW]
[ROW][C]30[/C][C]16[/C][C]13.7337[/C][C]2.26631[/C][/ROW]
[ROW][C]31[/C][C]15[/C][C]13.5414[/C][C]1.45858[/C][/ROW]
[ROW][C]32[/C][C]12[/C][C]13.4605[/C][C]-1.46055[/C][/ROW]
[ROW][C]33[/C][C]14[/C][C]14.0844[/C][C]-0.0843669[/C][/ROW]
[ROW][C]34[/C][C]14[/C][C]13.0559[/C][C]0.944113[/C][/ROW]
[ROW][C]35[/C][C]16[/C][C]14.3402[/C][C]1.65982[/C][/ROW]
[ROW][C]36[/C][C]12[/C][C]12.8199[/C][C]-0.819902[/C][/ROW]
[ROW][C]37[/C][C]14[/C][C]13.3554[/C][C]0.644643[/C][/ROW]
[ROW][C]38[/C][C]15[/C][C]13.9117[/C][C]1.08834[/C][/ROW]
[ROW][C]39[/C][C]13[/C][C]14.1745[/C][C]-1.17451[/C][/ROW]
[ROW][C]40[/C][C]16[/C][C]14.1014[/C][C]1.89858[/C][/ROW]
[ROW][C]41[/C][C]12[/C][C]12.949[/C][C]-0.948959[/C][/ROW]
[ROW][C]42[/C][C]16[/C][C]14.6163[/C][C]1.3837[/C][/ROW]
[ROW][C]43[/C][C]13[/C][C]13.3451[/C][C]-0.34507[/C][/ROW]
[ROW][C]44[/C][C]14[/C][C]13.7836[/C][C]0.216387[/C][/ROW]
[ROW][C]45[/C][C]14[/C][C]14.1258[/C][C]-0.125785[/C][/ROW]
[ROW][C]46[/C][C]10[/C][C]12.7289[/C][C]-2.72885[/C][/ROW]
[ROW][C]47[/C][C]16[/C][C]13.8285[/C][C]2.17145[/C][/ROW]
[ROW][C]48[/C][C]14[/C][C]13.9719[/C][C]0.0280893[/C][/ROW]
[ROW][C]49[/C][C]14[/C][C]12.6579[/C][C]1.34214[/C][/ROW]
[ROW][C]50[/C][C]15[/C][C]13.2637[/C][C]1.73625[/C][/ROW]
[ROW][C]51[/C][C]15[/C][C]12.6427[/C][C]2.35728[/C][/ROW]
[ROW][C]52[/C][C]13[/C][C]13.866[/C][C]-0.865995[/C][/ROW]
[ROW][C]53[/C][C]11[/C][C]13.6109[/C][C]-2.6109[/C][/ROW]
[ROW][C]54[/C][C]16[/C][C]13.5989[/C][C]2.40112[/C][/ROW]
[ROW][C]55[/C][C]15[/C][C]12.6964[/C][C]2.30357[/C][/ROW]
[ROW][C]56[/C][C]14[/C][C]13.6905[/C][C]0.30951[/C][/ROW]
[ROW][C]57[/C][C]13[/C][C]14.3196[/C][C]-1.31961[/C][/ROW]
[ROW][C]58[/C][C]6[/C][C]12.8746[/C][C]-6.87463[/C][/ROW]
[ROW][C]59[/C][C]12[/C][C]13.3223[/C][C]-1.32226[/C][/ROW]
[ROW][C]60[/C][C]14[/C][C]14.0151[/C][C]-0.0150657[/C][/ROW]
[ROW][C]61[/C][C]15[/C][C]14.1293[/C][C]0.870696[/C][/ROW]
[/TABLE]
Source: https://freestatistics.org/blog/index.php?pk=268332&T=4

Globally Unique Identifier (entire table): ba.freestatistics.org/blog/index.php?pk=268332&T=4

As an alternative you can also use a QR Code:  

The GUIDs for individual cells are displayed in the table below:

Multiple Linear Regression - Actuals, Interpolation, and Residuals
Time or IndexActualsInterpolationForecastResidualsPrediction Error
11312.52290.477062
21313.6558-0.65584
31112.7697-1.76971
41414.3226-0.322587
51512.99262.00739
61413.06270.937301
71113.6727-2.67271
81311.89461.10535
91615.32090.679051
101412.6191.38096
111413.50020.499771
121514.01150.988454
131513.96641.03357
141314.3158-1.31582
151414.5714-0.571366
161213.6975-1.69753
171414.112-0.111979
181214.7265-2.72652
191514.2950.705025
201513.58961.41039
211414.0583-0.0582657
221414.2433-0.243271
231213.3908-1.39079
241214.0706-2.07056
251414.0462-0.046197
261614.4231.57698
271213.319-1.31901
281212.3764-0.376391
291413.83690.163127
301613.73372.26631
311513.54141.45858
321213.4605-1.46055
331414.0844-0.0843669
341413.05590.944113
351614.34021.65982
361212.8199-0.819902
371413.35540.644643
381513.91171.08834
391314.1745-1.17451
401614.10141.89858
411212.949-0.948959
421614.61631.3837
431313.3451-0.34507
441413.78360.216387
451414.1258-0.125785
461012.7289-2.72885
471613.82852.17145
481413.97190.0280893
491412.65791.34214
501513.26371.73625
511512.64272.35728
521313.866-0.865995
531113.6109-2.6109
541613.59892.40112
551512.69642.30357
561413.69050.30951
571314.3196-1.31961
58612.8746-6.87463
591213.3223-1.32226
601414.0151-0.0150657
611514.12930.870696


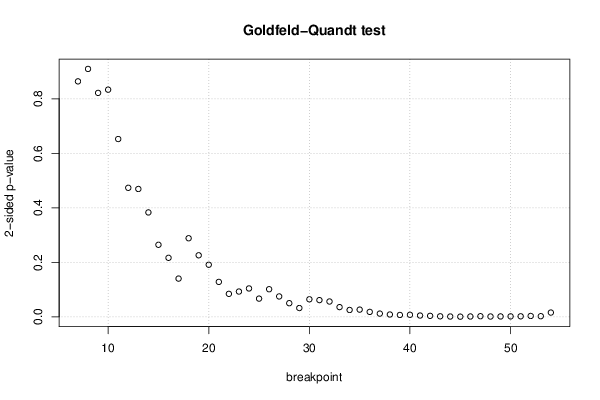
Goldfeld-Quandt test for Heteroskedasticity
p-valuesAlternative Hypothesis
breakpoint indexgreater2-sidedless
70.5679620.8640770.432038
80.4548230.9096460.545177
90.410840.821680.58916
100.4167770.8335550.583223
110.3262170.6524350.673783
120.2366660.4733320.763334
130.234540.469080.76546
140.1914870.3829730.808513
150.1321210.2642430.867879
160.1081730.2163450.891827
170.07006620.1401320.929934
180.1440990.2881980.855901
190.1128280.2256570.887172
200.09541910.1908380.904581
210.06396080.1279220.936039
220.0420610.0841220.957939
230.04628680.09257370.953713
240.05194150.1038830.948059
250.03332130.06664270.966679
260.05055670.1011130.949443
270.03729190.07458380.962708
280.02488460.04976910.975115
290.01600560.03201130.983994
300.03207830.06415670.967922
310.03056940.06113870.969431
320.02802040.05604080.97198
330.0177080.03541590.982292
340.0124890.0249780.987511
350.01311660.02623320.986883
360.008938340.01787670.991062
370.005833830.01166770.994166
380.004152510.008305010.995847
390.003267160.006534320.996733
400.003567550.007135090.996432
410.00224830.00449660.997752
420.001652530.003305060.998347
430.000852870.001705740.999147
440.000448580.0008971610.999551
450.0002054040.0004108080.999795
460.0004989180.0009978350.999501
470.001012220.002024430.998988
480.0004670530.0009341050.999533
490.0006093550.001218710.999391
500.0007093090.001418620.999291
510.0008434720.001686940.999157
520.001458250.00291650.998542
530.001022450.002044910.998978
540.007723610.01544720.992276

\begin{tabular}{lllllllll}
\hline
Goldfeld-Quandt test for Heteroskedasticity \tabularnewline
p-values & Alternative Hypothesis \tabularnewline
breakpoint index & greater & 2-sided & less \tabularnewline
7 & 0.567962 & 0.864077 & 0.432038 \tabularnewline
8 & 0.454823 & 0.909646 & 0.545177 \tabularnewline
9 & 0.41084 & 0.82168 & 0.58916 \tabularnewline
10 & 0.416777 & 0.833555 & 0.583223 \tabularnewline
11 & 0.326217 & 0.652435 & 0.673783 \tabularnewline
12 & 0.236666 & 0.473332 & 0.763334 \tabularnewline
13 & 0.23454 & 0.46908 & 0.76546 \tabularnewline
14 & 0.191487 & 0.382973 & 0.808513 \tabularnewline
15 & 0.132121 & 0.264243 & 0.867879 \tabularnewline
16 & 0.108173 & 0.216345 & 0.891827 \tabularnewline
17 & 0.0700662 & 0.140132 & 0.929934 \tabularnewline
18 & 0.144099 & 0.288198 & 0.855901 \tabularnewline
19 & 0.112828 & 0.225657 & 0.887172 \tabularnewline
20 & 0.0954191 & 0.190838 & 0.904581 \tabularnewline
21 & 0.0639608 & 0.127922 & 0.936039 \tabularnewline
22 & 0.042061 & 0.084122 & 0.957939 \tabularnewline
23 & 0.0462868 & 0.0925737 & 0.953713 \tabularnewline
24 & 0.0519415 & 0.103883 & 0.948059 \tabularnewline
25 & 0.0333213 & 0.0666427 & 0.966679 \tabularnewline
26 & 0.0505567 & 0.101113 & 0.949443 \tabularnewline
27 & 0.0372919 & 0.0745838 & 0.962708 \tabularnewline
28 & 0.0248846 & 0.0497691 & 0.975115 \tabularnewline
29 & 0.0160056 & 0.0320113 & 0.983994 \tabularnewline
30 & 0.0320783 & 0.0641567 & 0.967922 \tabularnewline
31 & 0.0305694 & 0.0611387 & 0.969431 \tabularnewline
32 & 0.0280204 & 0.0560408 & 0.97198 \tabularnewline
33 & 0.017708 & 0.0354159 & 0.982292 \tabularnewline
34 & 0.012489 & 0.024978 & 0.987511 \tabularnewline
35 & 0.0131166 & 0.0262332 & 0.986883 \tabularnewline
36 & 0.00893834 & 0.0178767 & 0.991062 \tabularnewline
37 & 0.00583383 & 0.0116677 & 0.994166 \tabularnewline
38 & 0.00415251 & 0.00830501 & 0.995847 \tabularnewline
39 & 0.00326716 & 0.00653432 & 0.996733 \tabularnewline
40 & 0.00356755 & 0.00713509 & 0.996432 \tabularnewline
41 & 0.0022483 & 0.0044966 & 0.997752 \tabularnewline
42 & 0.00165253 & 0.00330506 & 0.998347 \tabularnewline
43 & 0.00085287 & 0.00170574 & 0.999147 \tabularnewline
44 & 0.00044858 & 0.000897161 & 0.999551 \tabularnewline
45 & 0.000205404 & 0.000410808 & 0.999795 \tabularnewline
46 & 0.000498918 & 0.000997835 & 0.999501 \tabularnewline
47 & 0.00101222 & 0.00202443 & 0.998988 \tabularnewline
48 & 0.000467053 & 0.000934105 & 0.999533 \tabularnewline
49 & 0.000609355 & 0.00121871 & 0.999391 \tabularnewline
50 & 0.000709309 & 0.00141862 & 0.999291 \tabularnewline
51 & 0.000843472 & 0.00168694 & 0.999157 \tabularnewline
52 & 0.00145825 & 0.0029165 & 0.998542 \tabularnewline
53 & 0.00102245 & 0.00204491 & 0.998978 \tabularnewline
54 & 0.00772361 & 0.0154472 & 0.992276 \tabularnewline
\hline
\end{tabular}
%Source: https://freestatistics.org/blog/index.php?pk=268332&T=5

[TABLE]
[ROW][C]Goldfeld-Quandt test for Heteroskedasticity[/C][/ROW]
[ROW][C]p-values[/C][C]Alternative Hypothesis[/C][/ROW]
[ROW][C]breakpoint index[/C][C]greater[/C][C]2-sided[/C][C]less[/C][/ROW]
[ROW][C]7[/C][C]0.567962[/C][C]0.864077[/C][C]0.432038[/C][/ROW]
[ROW][C]8[/C][C]0.454823[/C][C]0.909646[/C][C]0.545177[/C][/ROW]
[ROW][C]9[/C][C]0.41084[/C][C]0.82168[/C][C]0.58916[/C][/ROW]
[ROW][C]10[/C][C]0.416777[/C][C]0.833555[/C][C]0.583223[/C][/ROW]
[ROW][C]11[/C][C]0.326217[/C][C]0.652435[/C][C]0.673783[/C][/ROW]
[ROW][C]12[/C][C]0.236666[/C][C]0.473332[/C][C]0.763334[/C][/ROW]
[ROW][C]13[/C][C]0.23454[/C][C]0.46908[/C][C]0.76546[/C][/ROW]
[ROW][C]14[/C][C]0.191487[/C][C]0.382973[/C][C]0.808513[/C][/ROW]
[ROW][C]15[/C][C]0.132121[/C][C]0.264243[/C][C]0.867879[/C][/ROW]
[ROW][C]16[/C][C]0.108173[/C][C]0.216345[/C][C]0.891827[/C][/ROW]
[ROW][C]17[/C][C]0.0700662[/C][C]0.140132[/C][C]0.929934[/C][/ROW]
[ROW][C]18[/C][C]0.144099[/C][C]0.288198[/C][C]0.855901[/C][/ROW]
[ROW][C]19[/C][C]0.112828[/C][C]0.225657[/C][C]0.887172[/C][/ROW]
[ROW][C]20[/C][C]0.0954191[/C][C]0.190838[/C][C]0.904581[/C][/ROW]
[ROW][C]21[/C][C]0.0639608[/C][C]0.127922[/C][C]0.936039[/C][/ROW]
[ROW][C]22[/C][C]0.042061[/C][C]0.084122[/C][C]0.957939[/C][/ROW]
[ROW][C]23[/C][C]0.0462868[/C][C]0.0925737[/C][C]0.953713[/C][/ROW]
[ROW][C]24[/C][C]0.0519415[/C][C]0.103883[/C][C]0.948059[/C][/ROW]
[ROW][C]25[/C][C]0.0333213[/C][C]0.0666427[/C][C]0.966679[/C][/ROW]
[ROW][C]26[/C][C]0.0505567[/C][C]0.101113[/C][C]0.949443[/C][/ROW]
[ROW][C]27[/C][C]0.0372919[/C][C]0.0745838[/C][C]0.962708[/C][/ROW]
[ROW][C]28[/C][C]0.0248846[/C][C]0.0497691[/C][C]0.975115[/C][/ROW]
[ROW][C]29[/C][C]0.0160056[/C][C]0.0320113[/C][C]0.983994[/C][/ROW]
[ROW][C]30[/C][C]0.0320783[/C][C]0.0641567[/C][C]0.967922[/C][/ROW]
[ROW][C]31[/C][C]0.0305694[/C][C]0.0611387[/C][C]0.969431[/C][/ROW]
[ROW][C]32[/C][C]0.0280204[/C][C]0.0560408[/C][C]0.97198[/C][/ROW]
[ROW][C]33[/C][C]0.017708[/C][C]0.0354159[/C][C]0.982292[/C][/ROW]
[ROW][C]34[/C][C]0.012489[/C][C]0.024978[/C][C]0.987511[/C][/ROW]
[ROW][C]35[/C][C]0.0131166[/C][C]0.0262332[/C][C]0.986883[/C][/ROW]
[ROW][C]36[/C][C]0.00893834[/C][C]0.0178767[/C][C]0.991062[/C][/ROW]
[ROW][C]37[/C][C]0.00583383[/C][C]0.0116677[/C][C]0.994166[/C][/ROW]
[ROW][C]38[/C][C]0.00415251[/C][C]0.00830501[/C][C]0.995847[/C][/ROW]
[ROW][C]39[/C][C]0.00326716[/C][C]0.00653432[/C][C]0.996733[/C][/ROW]
[ROW][C]40[/C][C]0.00356755[/C][C]0.00713509[/C][C]0.996432[/C][/ROW]
[ROW][C]41[/C][C]0.0022483[/C][C]0.0044966[/C][C]0.997752[/C][/ROW]
[ROW][C]42[/C][C]0.00165253[/C][C]0.00330506[/C][C]0.998347[/C][/ROW]
[ROW][C]43[/C][C]0.00085287[/C][C]0.00170574[/C][C]0.999147[/C][/ROW]
[ROW][C]44[/C][C]0.00044858[/C][C]0.000897161[/C][C]0.999551[/C][/ROW]
[ROW][C]45[/C][C]0.000205404[/C][C]0.000410808[/C][C]0.999795[/C][/ROW]
[ROW][C]46[/C][C]0.000498918[/C][C]0.000997835[/C][C]0.999501[/C][/ROW]
[ROW][C]47[/C][C]0.00101222[/C][C]0.00202443[/C][C]0.998988[/C][/ROW]
[ROW][C]48[/C][C]0.000467053[/C][C]0.000934105[/C][C]0.999533[/C][/ROW]
[ROW][C]49[/C][C]0.000609355[/C][C]0.00121871[/C][C]0.999391[/C][/ROW]
[ROW][C]50[/C][C]0.000709309[/C][C]0.00141862[/C][C]0.999291[/C][/ROW]
[ROW][C]51[/C][C]0.000843472[/C][C]0.00168694[/C][C]0.999157[/C][/ROW]
[ROW][C]52[/C][C]0.00145825[/C][C]0.0029165[/C][C]0.998542[/C][/ROW]
[ROW][C]53[/C][C]0.00102245[/C][C]0.00204491[/C][C]0.998978[/C][/ROW]
[ROW][C]54[/C][C]0.00772361[/C][C]0.0154472[/C][C]0.992276[/C][/ROW]
[/TABLE]
Source: https://freestatistics.org/blog/index.php?pk=268332&T=5

Globally Unique Identifier (entire table): ba.freestatistics.org/blog/index.php?pk=268332&T=5

As an alternative you can also use a QR Code:  

The GUIDs for individual cells are displayed in the table below:

Goldfeld-Quandt test for Heteroskedasticity
p-valuesAlternative Hypothesis
breakpoint indexgreater2-sidedless
70.5679620.8640770.432038
80.4548230.9096460.545177
90.410840.821680.58916
100.4167770.8335550.583223
110.3262170.6524350.673783
120.2366660.4733320.763334
130.234540.469080.76546
140.1914870.3829730.808513
150.1321210.2642430.867879
160.1081730.2163450.891827
170.07006620.1401320.929934
180.1440990.2881980.855901
190.1128280.2256570.887172
200.09541910.1908380.904581
210.06396080.1279220.936039
220.0420610.0841220.957939
230.04628680.09257370.953713
240.05194150.1038830.948059
250.03332130.06664270.966679
260.05055670.1011130.949443
270.03729190.07458380.962708
280.02488460.04976910.975115
290.01600560.03201130.983994
300.03207830.06415670.967922
310.03056940.06113870.969431
320.02802040.05604080.97198
330.0177080.03541590.982292
340.0124890.0249780.987511
350.01311660.02623320.986883
360.008938340.01787670.991062
370.005833830.01166770.994166
380.004152510.008305010.995847
390.003267160.006534320.996733
400.003567550.007135090.996432
410.00224830.00449660.997752
420.001652530.003305060.998347
430.000852870.001705740.999147
440.000448580.0008971610.999551
450.0002054040.0004108080.999795
460.0004989180.0009978350.999501
470.001012220.002024430.998988
480.0004670530.0009341050.999533
490.0006093550.001218710.999391
500.0007093090.001418620.999291
510.0008434720.001686940.999157
520.001458250.00291650.998542
530.001022450.002044910.998978
540.007723610.01544720.992276


Meta Analysis of Goldfeld-Quandt test for Heteroskedasticity
Description# significant tests% significant testsOK/NOK
1% type I error level160.333333NOK
5% type I error level240.5NOK
10% type I error level310.645833NOK

\begin{tabular}{lllllllll}
\hline
Meta Analysis of Goldfeld-Quandt test for Heteroskedasticity \tabularnewline
Description & # significant tests & % significant tests & OK/NOK \tabularnewline
1% type I error level & 16 & 0.333333 & NOK \tabularnewline
5% type I error level & 24 & 0.5 & NOK \tabularnewline
10% type I error level & 31 & 0.645833 & NOK \tabularnewline
\hline
\end{tabular}
%Source: https://freestatistics.org/blog/index.php?pk=268332&T=6

[TABLE]
[ROW][C]Meta Analysis of Goldfeld-Quandt test for Heteroskedasticity[/C][/ROW]
[ROW][C]Description[/C][C]# significant tests[/C][C]% significant tests[/C][C]OK/NOK[/C][/ROW]
[ROW][C]1% type I error level[/C][C]16[/C][C]0.333333[/C][C]NOK[/C][/ROW]
[ROW][C]5% type I error level[/C][C]24[/C][C]0.5[/C][C]NOK[/C][/ROW]
[ROW][C]10% type I error level[/C][C]31[/C][C]0.645833[/C][C]NOK[/C][/ROW]
[/TABLE]
Source: https://freestatistics.org/blog/index.php?pk=268332&T=6

Globally Unique Identifier (entire table): ba.freestatistics.org/blog/index.php?pk=268332&T=6

As an alternative you can also use a QR Code:  

The GUIDs for individual cells are displayed in the table below:

Meta Analysis of Goldfeld-Quandt test for Heteroskedasticity
Description# significant tests% significant testsOK/NOK
1% type I error level160.333333NOK
5% type I error level240.5NOK
10% type I error level310.645833NOK


Parameters (Session):
par1 = 1 ; par2 = 2 ; par3 = Pearson Chi-Squared ;
Parameters (R input):
par1 = 4 ; par2 = Do not include Seasonal Dummies ; par3 = No Linear Trend ;
R code (references can be found in the software module):
library(lattice)
library(lmtest)
n25 <- 25 #minimum number of obs. for Goldfeld-Quandt test
par1 <- as.numeric(par1)
x <- t(y)
k <- length(x[1,])
n <- length(x[,1])
x1 <- cbind(x[,par1], x[,1:k!=par1])
mycolnames <- c(colnames(x)[par1], colnames(x)[1:k!=par1])
colnames(x1) <- mycolnames #colnames(x)[par1]
x <- x1
if (par3 == 'First Differences'){
x2 <- array(0, dim=c(n-1,k), dimnames=list(1:(n-1), paste('(1-B)',colnames(x),sep='')))
for (i in 1:n-1) {
for (j in 1:k) {
x2[i,j] <- x[i+1,j] - x[i,j]
}
}
x <- x2
}
if (par2 == 'Include Monthly Dummies'){
x2 <- array(0, dim=c(n,11), dimnames=list(1:n, paste('M', seq(1:11), sep ='')))
for (i in 1:11){
x2[seq(i,n,12),i] <- 1
}
x <- cbind(x, x2)
}
if (par2 == 'Include Quarterly Dummies'){
x2 <- array(0, dim=c(n,3), dimnames=list(1:n, paste('Q', seq(1:3), sep ='')))
for (i in 1:3){
x2[seq(i,n,4),i] <- 1
}
x <- cbind(x, x2)
}
k <- length(x[1,])
if (par3 == 'Linear Trend'){
x <- cbind(x, c(1:n))
colnames(x)[k+1] <- 't'
}
x
k <- length(x[1,])
df <- as.data.frame(x)
(mylm <- lm(df))
(mysum <- summary(mylm))
if (n > n25) {
kp3 <- k + 3
nmkm3 <- n - k - 3
gqarr <- array(NA, dim=c(nmkm3-kp3+1,3))
numgqtests <- 0
numsignificant1 <- 0
numsignificant5 <- 0
numsignificant10 <- 0
for (mypoint in kp3:nmkm3) {
j <- 0
numgqtests <- numgqtests + 1
for (myalt in c('greater', 'two.sided', 'less')) {
j <- j + 1
gqarr[mypoint-kp3+1,j] <- gqtest(mylm, point=mypoint, alternative=myalt)$p.value
}
if (gqarr[mypoint-kp3+1,2] < 0.01) numsignificant1 <- numsignificant1 + 1
if (gqarr[mypoint-kp3+1,2] < 0.05) numsignificant5 <- numsignificant5 + 1
if (gqarr[mypoint-kp3+1,2] < 0.10) numsignificant10 <- numsignificant10 + 1
}
gqarr
}
bitmap(file='test0.png')
plot(x[,1], type='l', main='Actuals and Interpolation', ylab='value of Actuals and Interpolation (dots)', xlab='time or index')
points(x[,1]-mysum$resid)
grid()
dev.off()
bitmap(file='test1.png')
plot(mysum$resid, type='b', pch=19, main='Residuals', ylab='value of Residuals', xlab='time or index')
grid()
dev.off()
bitmap(file='test2.png')
hist(mysum$resid, main='Residual Histogram', xlab='values of Residuals')
grid()
dev.off()
bitmap(file='test3.png')
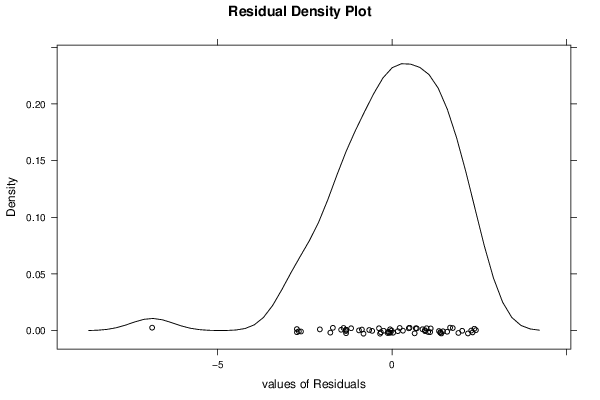
densityplot(~mysum$resid,col='black',main='Residual Density Plot', xlab='values of Residuals')
dev.off()
bitmap(file='test4.png')
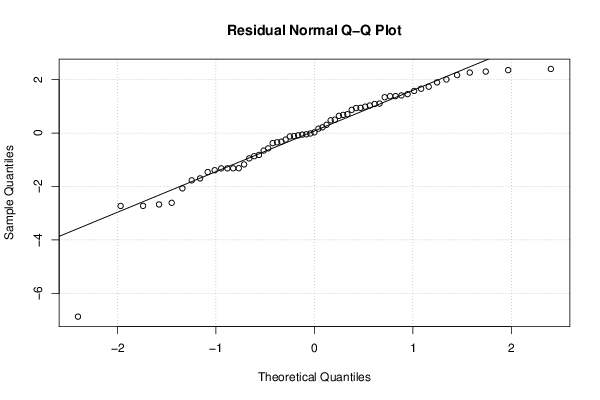
qqnorm(mysum$resid, main='Residual Normal Q-Q Plot')
qqline(mysum$resid)
grid()
dev.off()
(myerror <- as.ts(mysum$resid))
bitmap(file='test5.png')
dum <- cbind(lag(myerror,k=1),myerror)
dum
dum1 <- dum[2:length(myerror),]
dum1
z <- as.data.frame(dum1)
z
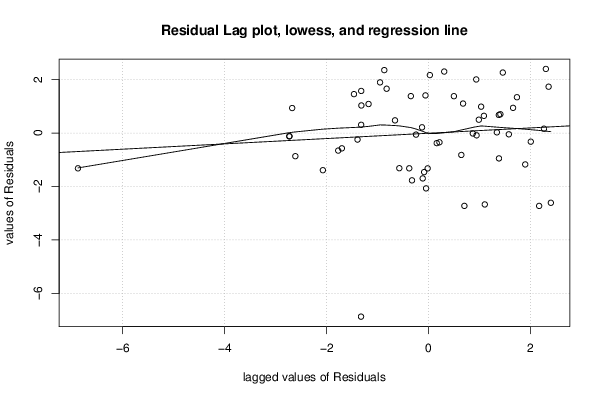
plot(z,main=paste('Residual Lag plot, lowess, and regression line'), ylab='values of Residuals', xlab='lagged values of Residuals')
lines(lowess(z))
abline(lm(z))
grid()
dev.off()
bitmap(file='test6.png')
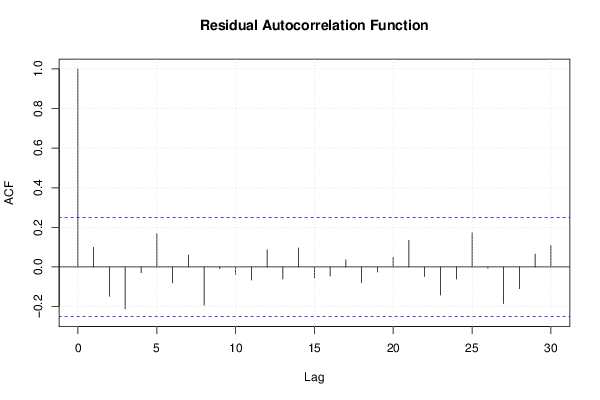
acf(mysum$resid, lag.max=length(mysum$resid)/2, main='Residual Autocorrelation Function')
grid()
dev.off()
bitmap(file='test7.png')
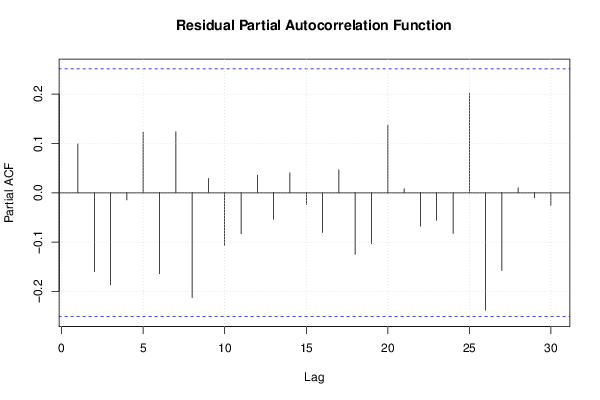
pacf(mysum$resid, lag.max=length(mysum$resid)/2, main='Residual Partial Autocorrelation Function')
grid()
dev.off()
bitmap(file='test8.png')
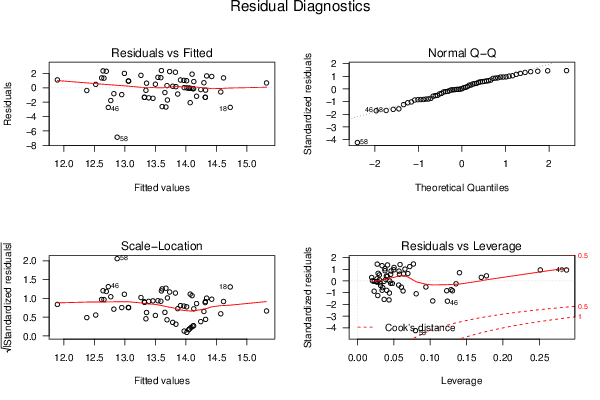
opar <- par(mfrow = c(2,2), oma = c(0, 0, 1.1, 0))
plot(mylm, las = 1, sub='Residual Diagnostics')
par(opar)
dev.off()
if (n > n25) {
bitmap(file='test9.png')
plot(kp3:nmkm3,gqarr[,2], main='Goldfeld-Quandt test',ylab='2-sided p-value',xlab='breakpoint')
grid()
dev.off()
}
load(file='createtable')
a<-table.start()
a<-table.row.start(a)
a<-table.element(a, 'Multiple Linear Regression - Estimated Regression Equation', 1, TRUE)
a<-table.row.end(a)
myeq <- colnames(x)[1]
myeq <- paste(myeq, '[t] = ', sep='')
for (i in 1:k){
if (mysum$coefficients[i,1] > 0) myeq <- paste(myeq, '+', '')
myeq <- paste(myeq, signif(mysum$coefficients[i,1],6), sep=' ')
if (rownames(mysum$coefficients)[i] != '(Intercept)') {
myeq <- paste(myeq, rownames(mysum$coefficients)[i], sep='')
if (rownames(mysum$coefficients)[i] != 't') myeq <- paste(myeq, '[t]', sep='')
}
}
myeq <- paste(myeq, ' + e[t]')
a<-table.row.start(a)
a<-table.element(a, myeq)
a<-table.row.end(a)
a<-table.end(a)
table.save(a,file='mytable1.tab')
a<-table.start()
a<-table.row.start(a)
a<-table.element(a,hyperlink('ols1.htm','Multiple Linear Regression - Ordinary Least Squares',''), 6, TRUE)
a<-table.row.end(a)
a<-table.row.start(a)
a<-table.element(a,'Variable',header=TRUE)
a<-table.element(a,'Parameter',header=TRUE)
a<-table.element(a,'S.D.',header=TRUE)
a<-table.element(a,'T-STAT
H0: parameter = 0',header=TRUE)
a<-table.element(a,'2-tail p-value',header=TRUE)
a<-table.element(a,'1-tail p-value',header=TRUE)
a<-table.row.end(a)
for (i in 1:k){
a<-table.row.start(a)
a<-table.element(a,rownames(mysum$coefficients)[i],header=TRUE)
a<-table.element(a,signif(mysum$coefficients[i,1],6))
a<-table.element(a, signif(mysum$coefficients[i,2],6))
a<-table.element(a, signif(mysum$coefficients[i,3],4))
a<-table.element(a, signif(mysum$coefficients[i,4],6))
a<-table.element(a, signif(mysum$coefficients[i,4]/2,6))
a<-table.row.end(a)
}
a<-table.end(a)
table.save(a,file='mytable2.tab')
a<-table.start()
a<-table.row.start(a)
a<-table.element(a, 'Multiple Linear Regression - Regression Statistics', 2, TRUE)
a<-table.row.end(a)
a<-table.row.start(a)
a<-table.element(a, 'Multiple R',1,TRUE)
a<-table.element(a, signif(sqrt(mysum$r.squared),6))
a<-table.row.end(a)
a<-table.row.start(a)
a<-table.element(a, 'R-squared',1,TRUE)
a<-table.element(a, signif(mysum$r.squared,6))
a<-table.row.end(a)
a<-table.row.start(a)
a<-table.element(a, 'Adjusted R-squared',1,TRUE)
a<-table.element(a, signif(mysum$adj.r.squared,6))
a<-table.row.end(a)
a<-table.row.start(a)
a<-table.element(a, 'F-TEST (value)',1,TRUE)
a<-table.element(a, signif(mysum$fstatistic[1],6))
a<-table.row.end(a)
a<-table.row.start(a)
a<-table.element(a, 'F-TEST (DF numerator)',1,TRUE)
a<-table.element(a, signif(mysum$fstatistic[2],6))
a<-table.row.end(a)
a<-table.row.start(a)
a<-table.element(a, 'F-TEST (DF denominator)',1,TRUE)
a<-table.element(a, signif(mysum$fstatistic[3],6))
a<-table.row.end(a)
a<-table.row.start(a)
a<-table.element(a, 'p-value',1,TRUE)
a<-table.element(a, signif(1-pf(mysum$fstatistic[1],mysum$fstatistic[2],mysum$fstatistic[3]),6))
a<-table.row.end(a)
a<-table.row.start(a)
a<-table.element(a, 'Multiple Linear Regression - Residual Statistics', 2, TRUE)
a<-table.row.end(a)
a<-table.row.start(a)
a<-table.element(a, 'Residual Standard Deviation',1,TRUE)
a<-table.element(a, signif(mysum$sigma,6))
a<-table.row.end(a)
a<-table.row.start(a)
a<-table.element(a, 'Sum Squared Residuals',1,TRUE)
a<-table.element(a, signif(sum(myerror*myerror),6))
a<-table.row.end(a)
a<-table.end(a)
table.save(a,file='mytable3.tab')
a<-table.start()
a<-table.row.start(a)
a<-table.element(a, 'Multiple Linear Regression - Actuals, Interpolation, and Residuals', 4, TRUE)
a<-table.row.end(a)
a<-table.row.start(a)
a<-table.element(a, 'Time or Index', 1, TRUE)
a<-table.element(a, 'Actuals', 1, TRUE)
a<-table.element(a, 'Interpolation
Forecast', 1, TRUE)
a<-table.element(a, 'Residuals
Prediction Error', 1, TRUE)
a<-table.row.end(a)
for (i in 1:n) {
a<-table.row.start(a)
a<-table.element(a,i, 1, TRUE)
a<-table.element(a,signif(x[i],6))
a<-table.element(a,signif(x[i]-mysum$resid[i],6))
a<-table.element(a,signif(mysum$resid[i],6))
a<-table.row.end(a)
}
a<-table.end(a)
table.save(a,file='mytable4.tab')
if (n > n25) {
a<-table.start()
a<-table.row.start(a)
a<-table.element(a,'Goldfeld-Quandt test for Heteroskedasticity',4,TRUE)
a<-table.row.end(a)
a<-table.row.start(a)
a<-table.element(a,'p-values',header=TRUE)
a<-table.element(a,'Alternative Hypothesis',3,header=TRUE)
a<-table.row.end(a)
a<-table.row.start(a)
a<-table.element(a,'breakpoint index',header=TRUE)
a<-table.element(a,'greater',header=TRUE)
a<-table.element(a,'2-sided',header=TRUE)
a<-table.element(a,'less',header=TRUE)
a<-table.row.end(a)
for (mypoint in kp3:nmkm3) {
a<-table.row.start(a)
a<-table.element(a,mypoint,header=TRUE)
a<-table.element(a,signif(gqarr[mypoint-kp3+1,1],6))
a<-table.element(a,signif(gqarr[mypoint-kp3+1,2],6))
a<-table.element(a,signif(gqarr[mypoint-kp3+1,3],6))
a<-table.row.end(a)
}
a<-table.end(a)
table.save(a,file='mytable5.tab')
a<-table.start()
a<-table.row.start(a)
a<-table.element(a,'Meta Analysis of Goldfeld-Quandt test for Heteroskedasticity',4,TRUE)
a<-table.row.end(a)
a<-table.row.start(a)
a<-table.element(a,'Description',header=TRUE)
a<-table.element(a,'# significant tests',header=TRUE)
a<-table.element(a,'% significant tests',header=TRUE)
a<-table.element(a,'OK/NOK',header=TRUE)
a<-table.row.end(a)
a<-table.row.start(a)
a<-table.element(a,'1% type I error level',header=TRUE)
a<-table.element(a,signif(numsignificant1,6))
a<-table.element(a,signif(numsignificant1/numgqtests,6))
if (numsignificant1/numgqtests < 0.01) dum <- 'OK' else dum <- 'NOK'
a<-table.element(a,dum)
a<-table.row.end(a)
a<-table.row.start(a)
a<-table.element(a,'5% type I error level',header=TRUE)
a<-table.element(a,signif(numsignificant5,6))
a<-table.element(a,signif(numsignificant5/numgqtests,6))
if (numsignificant5/numgqtests < 0.05) dum <- 'OK' else dum <- 'NOK'
a<-table.element(a,dum)
a<-table.row.end(a)
a<-table.row.start(a)
a<-table.element(a,'10% type I error level',header=TRUE)
a<-table.element(a,signif(numsignificant10,6))
a<-table.element(a,signif(numsignificant10/numgqtests,6))
if (numsignificant10/numgqtests < 0.1) dum <- 'OK' else dum <- 'NOK'
a<-table.element(a,dum)
a<-table.row.end(a)
a<-table.end(a)
table.save(a,file='mytable6.tab')
}