Free Statistics

of Irreproducible Research!

Author's title

Author*The author of this computation has been verified*
R Software Modulerwasp_chi_squared_tests.wasp
Title produced by softwareChi-Squared Test, McNemar Test, and Fisher Exact Test
Date of computationMon, 15 Dec 2014 13:54:35 +0000
Cite this page as followsStatistical Computations at FreeStatistics.org, Office for Research Development and Education, URL https://freestatistics.org/blog/index.php?v=date/2014/Dec/15/t141865171247kvykdr8ompmon.htm/, Retrieved Thu, 16 May 2024 17:41:38 +0000
Statistical Computations at FreeStatistics.org, Office for Research Development and Education, URL https://freestatistics.org/blog/index.php?pk=268409, Retrieved Thu, 16 May 2024 17:41:38 +0000
QR Codes:

Original text written by user:
IsPrivate?No (this computation is public)
User-defined keywords
Estimated Impact46
Family? (F = Feedback message, R = changed R code, M = changed R Module, P = changed Parameters, D = changed Data)
-       [Chi-Squared Test, McNemar Test, and Fisher Exact Test] [] [2014-12-15 13:54:35] [9a966322e4d935aee68609d815c1a240] [Current]
Feedback Forum

Post a new message
Dataseries X:
26 0
51 0
57 1
37 0
67 1
43 1
52 1
52 0
43 1
84 1
67 1
49 1
70 1
58 0
68 0
62 0
43 1
56 0
74 0
63 1
58 0
63 1
53 1
57 1
64 1
53 0
29 0
54 0
58 1
51 1
54 0
56 1
47 0
50 1
35 1
30 1
68 0
56 1
43 1
67 1
62 1
57 1
54 1
61 1
56 0
41 0
53 0
46 1
51 0
37 0
42 0
38 1
66 0
53 1
49 0
49 0
59 1
40 0
63 0
34 1
32 0
67 0
61 1
60 0
63 0
52 1
16 1
46 1
56 1
52 0
55 1
50 1
59 0
60 1
52 0
44 0
67 1
52 1
55 1
37 1
54 1
72 1
51 1
48 1
60 0
50 1
63 1
33 1
67 1
46 1
54 1
59 0
61 1
33 1
47 1
69 1
52 1
55 0
55 0
41 0
73 1
51 0
52 0
50 0
51 1
60 0
56 1
56 1
29 0
66 1
66 1
73 1
55 0
64 0
40 0
46 0
58 1
43 0
61 1
51 0
50 1
52 0
54 1
66 0
61 0
80 1
51 0
56 1
56 1
56 1
53 1
47 1
25 0
47 1
46 0
50 0
39 0
51 1
58 0
35 1
58 0
60 0
62 0
63 0
53 1
46 1
67 1
59 1
64 0
38 0
50 1
48 0
48 0
47 0
66 0
47 1
63 1
58 0
44 0
51 1
43 0
55 1
38 1
56 1
45 0
50 1
54 1
57 1
60 0
55 0
56 0
49 1
37 1
43 0
59 1
46 1
51 0
58 0
64 0
53 1
48 1
51 0
47 0
59 0
62 1
62 1
51 0
64 0
52 0
67 1
50 1
54 1
58 1
56 0
63 1
31 1
65 1
71 0
50 0
57 1
47 0
54 1
47 1
57 1
43 0
41 1
63 0
63 1
56 1
51 0
50 1
22 0
41 1
59 0
56 1
66 0
53 0
42 1
52 1
54 0
44 1
62 1
53 0
50 1
36 0
76 0
66 1
62 1
59 0
47 1
55 0
58 0
60 1
44 0
57 0
45 1


Summary of computational transaction
Raw Inputview raw input (R code)
Raw Outputview raw output of R engine
Computing time2 seconds
R Server'Herman Ole Andreas Wold' @ wold.wessa.net

\begin{tabular}{lllllllll}
\hline
Summary of computational transaction \tabularnewline
Raw Input & view raw input (R code)  \tabularnewline
Raw Output & view raw output of R engine  \tabularnewline
Computing time & 2 seconds \tabularnewline
R Server & 'Herman Ole Andreas Wold' @ wold.wessa.net \tabularnewline
\hline
\end{tabular}
%Source: https://freestatistics.org/blog/index.php?pk=268409&T=0

[TABLE]
[ROW][C]Summary of computational transaction[/C][/ROW]
[ROW][C]Raw Input[/C][C]view raw input (R code) [/C][/ROW]
[ROW][C]Raw Output[/C][C]view raw output of R engine [/C][/ROW]
[ROW][C]Computing time[/C][C]2 seconds[/C][/ROW]
[ROW][C]R Server[/C][C]'Herman Ole Andreas Wold' @ wold.wessa.net[/C][/ROW]
[/TABLE]
Source: https://freestatistics.org/blog/index.php?pk=268409&T=0

Globally Unique Identifier (entire table): ba.freestatistics.org/blog/index.php?pk=268409&T=0

As an alternative you can also use a QR Code:  

The GUIDs for individual cells are displayed in the table below:

Summary of computational transaction
Raw Inputview raw input (R code)
Raw Outputview raw output of R engine
Computing time2 seconds
R Server'Herman Ole Andreas Wold' @ wold.wessa.net


Tabulation of Results
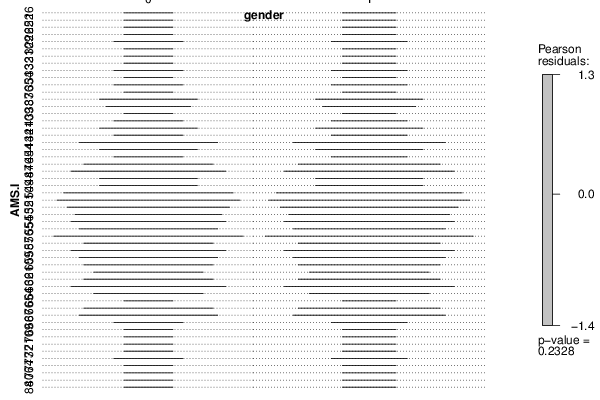
AMS.I x gender
01
1601
2210
2510
2610
2920
3001
3101
3210
3302
3401
3502
3610
3722
3812
3910
4020
4122
4211
4344
4431
4511
4625
4746
4822
4922
5039
5195
5265
5345
5437
5553
56411
5716
5873
5953
6052
6114
6225
6346
6441
6501
6643
6717
6820
6901
7001
7110
7201
7302
7410
7610
8001
8401

\begin{tabular}{lllllllll}
\hline
Tabulation of Results \tabularnewline
AMS.I  x  gender \tabularnewline
  & 0 & 1 \tabularnewline
16 & 0 & 1 \tabularnewline
22 & 1 & 0 \tabularnewline
25 & 1 & 0 \tabularnewline
26 & 1 & 0 \tabularnewline
29 & 2 & 0 \tabularnewline
30 & 0 & 1 \tabularnewline
31 & 0 & 1 \tabularnewline
32 & 1 & 0 \tabularnewline
33 & 0 & 2 \tabularnewline
34 & 0 & 1 \tabularnewline
35 & 0 & 2 \tabularnewline
36 & 1 & 0 \tabularnewline
37 & 2 & 2 \tabularnewline
38 & 1 & 2 \tabularnewline
39 & 1 & 0 \tabularnewline
40 & 2 & 0 \tabularnewline
41 & 2 & 2 \tabularnewline
42 & 1 & 1 \tabularnewline
43 & 4 & 4 \tabularnewline
44 & 3 & 1 \tabularnewline
45 & 1 & 1 \tabularnewline
46 & 2 & 5 \tabularnewline
47 & 4 & 6 \tabularnewline
48 & 2 & 2 \tabularnewline
49 & 2 & 2 \tabularnewline
50 & 3 & 9 \tabularnewline
51 & 9 & 5 \tabularnewline
52 & 6 & 5 \tabularnewline
53 & 4 & 5 \tabularnewline
54 & 3 & 7 \tabularnewline
55 & 5 & 3 \tabularnewline
56 & 4 & 11 \tabularnewline
57 & 1 & 6 \tabularnewline
58 & 7 & 3 \tabularnewline
59 & 5 & 3 \tabularnewline
60 & 5 & 2 \tabularnewline
61 & 1 & 4 \tabularnewline
62 & 2 & 5 \tabularnewline
63 & 4 & 6 \tabularnewline
64 & 4 & 1 \tabularnewline
65 & 0 & 1 \tabularnewline
66 & 4 & 3 \tabularnewline
67 & 1 & 7 \tabularnewline
68 & 2 & 0 \tabularnewline
69 & 0 & 1 \tabularnewline
70 & 0 & 1 \tabularnewline
71 & 1 & 0 \tabularnewline
72 & 0 & 1 \tabularnewline
73 & 0 & 2 \tabularnewline
74 & 1 & 0 \tabularnewline
76 & 1 & 0 \tabularnewline
80 & 0 & 1 \tabularnewline
84 & 0 & 1 \tabularnewline
\hline
\end{tabular}
%Source: https://freestatistics.org/blog/index.php?pk=268409&T=1

[TABLE]
[ROW][C]Tabulation of Results[/C][/ROW]
[ROW][C]AMS.I  x  gender[/C][/ROW]
[ROW][C] [/C][C]0[/C][C]1[/C][/ROW]
[C]16[/C][C]0[/C][C]1[/C][/ROW]
[C]22[/C][C]1[/C][C]0[/C][/ROW]
[C]25[/C][C]1[/C][C]0[/C][/ROW]
[C]26[/C][C]1[/C][C]0[/C][/ROW]
[C]29[/C][C]2[/C][C]0[/C][/ROW]
[C]30[/C][C]0[/C][C]1[/C][/ROW]
[C]31[/C][C]0[/C][C]1[/C][/ROW]
[C]32[/C][C]1[/C][C]0[/C][/ROW]
[C]33[/C][C]0[/C][C]2[/C][/ROW]
[C]34[/C][C]0[/C][C]1[/C][/ROW]
[C]35[/C][C]0[/C][C]2[/C][/ROW]
[C]36[/C][C]1[/C][C]0[/C][/ROW]
[C]37[/C][C]2[/C][C]2[/C][/ROW]
[C]38[/C][C]1[/C][C]2[/C][/ROW]
[C]39[/C][C]1[/C][C]0[/C][/ROW]
[C]40[/C][C]2[/C][C]0[/C][/ROW]
[C]41[/C][C]2[/C][C]2[/C][/ROW]
[C]42[/C][C]1[/C][C]1[/C][/ROW]
[C]43[/C][C]4[/C][C]4[/C][/ROW]
[C]44[/C][C]3[/C][C]1[/C][/ROW]
[C]45[/C][C]1[/C][C]1[/C][/ROW]
[C]46[/C][C]2[/C][C]5[/C][/ROW]
[C]47[/C][C]4[/C][C]6[/C][/ROW]
[C]48[/C][C]2[/C][C]2[/C][/ROW]
[C]49[/C][C]2[/C][C]2[/C][/ROW]
[C]50[/C][C]3[/C][C]9[/C][/ROW]
[C]51[/C][C]9[/C][C]5[/C][/ROW]
[C]52[/C][C]6[/C][C]5[/C][/ROW]
[C]53[/C][C]4[/C][C]5[/C][/ROW]
[C]54[/C][C]3[/C][C]7[/C][/ROW]
[C]55[/C][C]5[/C][C]3[/C][/ROW]
[C]56[/C][C]4[/C][C]11[/C][/ROW]
[C]57[/C][C]1[/C][C]6[/C][/ROW]
[C]58[/C][C]7[/C][C]3[/C][/ROW]
[C]59[/C][C]5[/C][C]3[/C][/ROW]
[C]60[/C][C]5[/C][C]2[/C][/ROW]
[C]61[/C][C]1[/C][C]4[/C][/ROW]
[C]62[/C][C]2[/C][C]5[/C][/ROW]
[C]63[/C][C]4[/C][C]6[/C][/ROW]
[C]64[/C][C]4[/C][C]1[/C][/ROW]
[C]65[/C][C]0[/C][C]1[/C][/ROW]
[C]66[/C][C]4[/C][C]3[/C][/ROW]
[C]67[/C][C]1[/C][C]7[/C][/ROW]
[C]68[/C][C]2[/C][C]0[/C][/ROW]
[C]69[/C][C]0[/C][C]1[/C][/ROW]
[C]70[/C][C]0[/C][C]1[/C][/ROW]
[C]71[/C][C]1[/C][C]0[/C][/ROW]
[C]72[/C][C]0[/C][C]1[/C][/ROW]
[C]73[/C][C]0[/C][C]2[/C][/ROW]
[C]74[/C][C]1[/C][C]0[/C][/ROW]
[C]76[/C][C]1[/C][C]0[/C][/ROW]
[C]80[/C][C]0[/C][C]1[/C][/ROW]
[C]84[/C][C]0[/C][C]1[/C][/ROW]
[/TABLE]
Source: https://freestatistics.org/blog/index.php?pk=268409&T=1

Globally Unique Identifier (entire table): ba.freestatistics.org/blog/index.php?pk=268409&T=1

As an alternative you can also use a QR Code:  

The GUIDs for individual cells are displayed in the table below:

Tabulation of Results
AMS.I x gender
01
1601
2210
2510
2610
2920
3001
3101
3210
3302
3401
3502
3610
3722
3812
3910
4020
4122
4211
4344
4431
4511
4625
4746
4822
4922
5039
5195
5265
5345
5437
5553
56411
5716
5873
5953
6052
6114
6225
6346
6441
6501
6643
6717
6820
6901
7001
7110
7201
7302
7410
7610
8001
8401


Tabulation of Expected Results
AMS.I x gender
01
160.450.55
220.450.55
250.450.55
260.450.55
290.911.09
300.450.55
310.450.55
320.450.55
330.911.09
340.450.55
350.911.09
360.450.55
371.812.19
381.361.64
390.450.55
400.911.09
411.812.19
420.911.09
433.634.37
441.812.19
450.911.09
463.173.83
474.535.47
481.812.19
491.812.19
505.446.56
516.357.65
524.996.01
534.084.92
544.535.47
553.634.37
566.88.2
573.173.83
584.535.47
593.634.37
603.173.83
612.272.73
623.173.83
634.535.47
642.272.73
650.450.55
663.173.83
673.634.37
680.911.09
690.450.55
700.450.55
710.450.55
720.450.55
730.911.09
740.450.55
760.450.55
800.450.55
840.450.55

\begin{tabular}{lllllllll}
\hline
Tabulation of Expected Results \tabularnewline
AMS.I  x  gender \tabularnewline
  & 0 & 1 \tabularnewline
16 & 0.45 & 0.55 \tabularnewline
22 & 0.45 & 0.55 \tabularnewline
25 & 0.45 & 0.55 \tabularnewline
26 & 0.45 & 0.55 \tabularnewline
29 & 0.91 & 1.09 \tabularnewline
30 & 0.45 & 0.55 \tabularnewline
31 & 0.45 & 0.55 \tabularnewline
32 & 0.45 & 0.55 \tabularnewline
33 & 0.91 & 1.09 \tabularnewline
34 & 0.45 & 0.55 \tabularnewline
35 & 0.91 & 1.09 \tabularnewline
36 & 0.45 & 0.55 \tabularnewline
37 & 1.81 & 2.19 \tabularnewline
38 & 1.36 & 1.64 \tabularnewline
39 & 0.45 & 0.55 \tabularnewline
40 & 0.91 & 1.09 \tabularnewline
41 & 1.81 & 2.19 \tabularnewline
42 & 0.91 & 1.09 \tabularnewline
43 & 3.63 & 4.37 \tabularnewline
44 & 1.81 & 2.19 \tabularnewline
45 & 0.91 & 1.09 \tabularnewline
46 & 3.17 & 3.83 \tabularnewline
47 & 4.53 & 5.47 \tabularnewline
48 & 1.81 & 2.19 \tabularnewline
49 & 1.81 & 2.19 \tabularnewline
50 & 5.44 & 6.56 \tabularnewline
51 & 6.35 & 7.65 \tabularnewline
52 & 4.99 & 6.01 \tabularnewline
53 & 4.08 & 4.92 \tabularnewline
54 & 4.53 & 5.47 \tabularnewline
55 & 3.63 & 4.37 \tabularnewline
56 & 6.8 & 8.2 \tabularnewline
57 & 3.17 & 3.83 \tabularnewline
58 & 4.53 & 5.47 \tabularnewline
59 & 3.63 & 4.37 \tabularnewline
60 & 3.17 & 3.83 \tabularnewline
61 & 2.27 & 2.73 \tabularnewline
62 & 3.17 & 3.83 \tabularnewline
63 & 4.53 & 5.47 \tabularnewline
64 & 2.27 & 2.73 \tabularnewline
65 & 0.45 & 0.55 \tabularnewline
66 & 3.17 & 3.83 \tabularnewline
67 & 3.63 & 4.37 \tabularnewline
68 & 0.91 & 1.09 \tabularnewline
69 & 0.45 & 0.55 \tabularnewline
70 & 0.45 & 0.55 \tabularnewline
71 & 0.45 & 0.55 \tabularnewline
72 & 0.45 & 0.55 \tabularnewline
73 & 0.91 & 1.09 \tabularnewline
74 & 0.45 & 0.55 \tabularnewline
76 & 0.45 & 0.55 \tabularnewline
80 & 0.45 & 0.55 \tabularnewline
84 & 0.45 & 0.55 \tabularnewline
\hline
\end{tabular}
%Source: https://freestatistics.org/blog/index.php?pk=268409&T=2

[TABLE]
[ROW][C]Tabulation of Expected Results[/C][/ROW]
[ROW][C]AMS.I  x  gender[/C][/ROW]
[ROW][C] [/C][C]0[/C][C]1[/C][/ROW]
[C]16[/C][C]0.45[/C][C]0.55[/C][/ROW]
[C]22[/C][C]0.45[/C][C]0.55[/C][/ROW]
[C]25[/C][C]0.45[/C][C]0.55[/C][/ROW]
[C]26[/C][C]0.45[/C][C]0.55[/C][/ROW]
[C]29[/C][C]0.91[/C][C]1.09[/C][/ROW]
[C]30[/C][C]0.45[/C][C]0.55[/C][/ROW]
[C]31[/C][C]0.45[/C][C]0.55[/C][/ROW]
[C]32[/C][C]0.45[/C][C]0.55[/C][/ROW]
[C]33[/C][C]0.91[/C][C]1.09[/C][/ROW]
[C]34[/C][C]0.45[/C][C]0.55[/C][/ROW]
[C]35[/C][C]0.91[/C][C]1.09[/C][/ROW]
[C]36[/C][C]0.45[/C][C]0.55[/C][/ROW]
[C]37[/C][C]1.81[/C][C]2.19[/C][/ROW]
[C]38[/C][C]1.36[/C][C]1.64[/C][/ROW]
[C]39[/C][C]0.45[/C][C]0.55[/C][/ROW]
[C]40[/C][C]0.91[/C][C]1.09[/C][/ROW]
[C]41[/C][C]1.81[/C][C]2.19[/C][/ROW]
[C]42[/C][C]0.91[/C][C]1.09[/C][/ROW]
[C]43[/C][C]3.63[/C][C]4.37[/C][/ROW]
[C]44[/C][C]1.81[/C][C]2.19[/C][/ROW]
[C]45[/C][C]0.91[/C][C]1.09[/C][/ROW]
[C]46[/C][C]3.17[/C][C]3.83[/C][/ROW]
[C]47[/C][C]4.53[/C][C]5.47[/C][/ROW]
[C]48[/C][C]1.81[/C][C]2.19[/C][/ROW]
[C]49[/C][C]1.81[/C][C]2.19[/C][/ROW]
[C]50[/C][C]5.44[/C][C]6.56[/C][/ROW]
[C]51[/C][C]6.35[/C][C]7.65[/C][/ROW]
[C]52[/C][C]4.99[/C][C]6.01[/C][/ROW]
[C]53[/C][C]4.08[/C][C]4.92[/C][/ROW]
[C]54[/C][C]4.53[/C][C]5.47[/C][/ROW]
[C]55[/C][C]3.63[/C][C]4.37[/C][/ROW]
[C]56[/C][C]6.8[/C][C]8.2[/C][/ROW]
[C]57[/C][C]3.17[/C][C]3.83[/C][/ROW]
[C]58[/C][C]4.53[/C][C]5.47[/C][/ROW]
[C]59[/C][C]3.63[/C][C]4.37[/C][/ROW]
[C]60[/C][C]3.17[/C][C]3.83[/C][/ROW]
[C]61[/C][C]2.27[/C][C]2.73[/C][/ROW]
[C]62[/C][C]3.17[/C][C]3.83[/C][/ROW]
[C]63[/C][C]4.53[/C][C]5.47[/C][/ROW]
[C]64[/C][C]2.27[/C][C]2.73[/C][/ROW]
[C]65[/C][C]0.45[/C][C]0.55[/C][/ROW]
[C]66[/C][C]3.17[/C][C]3.83[/C][/ROW]
[C]67[/C][C]3.63[/C][C]4.37[/C][/ROW]
[C]68[/C][C]0.91[/C][C]1.09[/C][/ROW]
[C]69[/C][C]0.45[/C][C]0.55[/C][/ROW]
[C]70[/C][C]0.45[/C][C]0.55[/C][/ROW]
[C]71[/C][C]0.45[/C][C]0.55[/C][/ROW]
[C]72[/C][C]0.45[/C][C]0.55[/C][/ROW]
[C]73[/C][C]0.91[/C][C]1.09[/C][/ROW]
[C]74[/C][C]0.45[/C][C]0.55[/C][/ROW]
[C]76[/C][C]0.45[/C][C]0.55[/C][/ROW]
[C]80[/C][C]0.45[/C][C]0.55[/C][/ROW]
[C]84[/C][C]0.45[/C][C]0.55[/C][/ROW]
[/TABLE]
Source: https://freestatistics.org/blog/index.php?pk=268409&T=2

Globally Unique Identifier (entire table): ba.freestatistics.org/blog/index.php?pk=268409&T=2

As an alternative you can also use a QR Code:  

The GUIDs for individual cells are displayed in the table below:

Tabulation of Expected Results
AMS.I x gender
01
160.450.55
220.450.55
250.450.55
260.450.55
290.911.09
300.450.55
310.450.55
320.450.55
330.911.09
340.450.55
350.911.09
360.450.55
371.812.19
381.361.64
390.450.55
400.911.09
411.812.19
420.911.09
433.634.37
441.812.19
450.911.09
463.173.83
474.535.47
481.812.19
491.812.19
505.446.56
516.357.65
524.996.01
534.084.92
544.535.47
553.634.37
566.88.2
573.173.83
584.535.47
593.634.37
603.173.83
612.272.73
623.173.83
634.535.47
642.272.73
650.450.55
663.173.83
673.634.37
680.911.09
690.450.55
700.450.55
710.450.55
720.450.55
730.911.09
740.450.55
760.450.55
800.450.55
840.450.55


Statistical Results
Pearson's Chi-squared test
Pearson Chi Square Statistic59.08
Degrees of Freedom52
P value0.23

\begin{tabular}{lllllllll}
\hline
Statistical Results \tabularnewline
Pearson's Chi-squared test \tabularnewline
Pearson Chi Square Statistic & 59.08 \tabularnewline
Degrees of Freedom & 52 \tabularnewline
P value & 0.23 \tabularnewline
\hline
\end{tabular}
%Source: https://freestatistics.org/blog/index.php?pk=268409&T=3

[TABLE]
[ROW][C]Statistical Results[/C][/ROW]
[ROW][C]Pearson's Chi-squared test[/C][/ROW]
[ROW][C]Pearson Chi Square Statistic[/C][C]59.08[/C][/ROW]
[ROW][C]Degrees of Freedom[/C][C]52[/C][/ROW]
[ROW][C]P value[/C][C]0.23[/C][/ROW]
[/TABLE]
Source: https://freestatistics.org/blog/index.php?pk=268409&T=3

Globally Unique Identifier (entire table): ba.freestatistics.org/blog/index.php?pk=268409&T=3

As an alternative you can also use a QR Code:  

The GUIDs for individual cells are displayed in the table below:

Statistical Results
Pearson's Chi-squared test
Pearson Chi Square Statistic59.08
Degrees of Freedom52
P value0.23


Parameters (Session):
par1 = 1 ; par2 = 2 ; par3 = Pearson Chi-Squared ;
Parameters (R input):
par1 = 1 ; par2 = 2 ; par3 = Pearson Chi-Squared ;
R code (references can be found in the software module):
library(vcd)
cat1 <- as.numeric(par1) #
cat2<- as.numeric(par2) #
simulate.p.value=FALSE
if (par3 == 'Exact Pearson Chi-Squared by Simulation') simulate.p.value=TRUE
x <- t(x)
(z <- array(unlist(x),dim=c(length(x[,1]),length(x[1,]))))
(table1 <- table(z[,cat1],z[,cat2]))
(V1<-dimnames(y)[[1]][cat1])
(V2<-dimnames(y)[[1]][cat2])
bitmap(file='pic1.png')
assoc(ftable(z[,cat1],z[,cat2],row.vars=1,dnn=c(V1,V2)),shade=T)
dev.off()
load(file='createtable')
a<-table.start()
a<-table.row.start(a)
a<-table.element(a,'Tabulation of Results',ncol(table1)+1,TRUE)
a<-table.row.end(a)
a<-table.row.start(a)
a<-table.element(a,paste(V1,' x ', V2),ncol(table1)+1,TRUE)
a<-table.row.end(a)
a<-table.row.start(a)
a<-table.element(a, ' ', 1,TRUE)
for(nc in 1:ncol(table1)){
a<-table.element(a, colnames(table1)[nc], 1, TRUE)
}
a<-table.row.end(a)
for(nr in 1:nrow(table1) ){
a<-table.element(a, rownames(table1)[nr], 1, TRUE)
for(nc in 1:ncol(table1) ){
a<-table.element(a, table1[nr, nc], 1, FALSE)
}
a<-table.row.end(a)
}
a<-table.end(a)
table.save(a,file='mytable.tab')
(cst<-chisq.test(table1, simulate.p.value=simulate.p.value) )
if (par3 == 'McNemar Chi-Squared') {
(cst <- mcnemar.test(table1))
}
if (par3=='Fisher Exact Test') {
(cst <- fisher.test(table1))
}
if ((par3 != 'McNemar Chi-Squared') & (par3 != 'Fisher Exact Test')) {
a<-table.start()
a<-table.row.start(a)
a<-table.element(a,'Tabulation of Expected Results',ncol(table1)+1,TRUE)
a<-table.row.end(a)
a<-table.row.start(a)
a<-table.element(a,paste(V1,' x ', V2),ncol(table1)+1,TRUE)
a<-table.row.end(a)
a<-table.row.start(a)
a<-table.element(a, ' ', 1,TRUE)
for(nc in 1:ncol(table1)){
a<-table.element(a, colnames(table1)[nc], 1, TRUE)
}
a<-table.row.end(a)
for(nr in 1:nrow(table1) ){
a<-table.element(a, rownames(table1)[nr], 1, TRUE)
for(nc in 1:ncol(table1) ){
a<-table.element(a, round(cst$expected[nr, nc], digits=2), 1, FALSE)
}
a<-table.row.end(a)
}
a<-table.end(a)
table.save(a,file='mytable1.tab')
}
a<-table.start()
a<-table.row.start(a)
a<-table.element(a,'Statistical Results',2,TRUE)
a<-table.row.end(a)
a<-table.row.start(a)
a<-table.element(a, cst$method, 2,TRUE)
a<-table.row.end(a)
a<-table.row.start(a)
if (par3=='Pearson Chi-Squared') a<-table.element(a, 'Pearson Chi Square Statistic', 1, TRUE)
if (par3=='Exact Pearson Chi-Squared by Simulation') a<-table.element(a, 'Exact Pearson Chi Square Statistic', 1, TRUE)
if (par3=='McNemar Chi-Squared') a<-table.element(a, 'McNemar Chi Square Statistic', 1, TRUE)
if (par3=='Fisher Exact Test') a<-table.element(a, 'Odds Ratio', 1, TRUE)
if (par3=='Fisher Exact Test') {
if ((ncol(table1) == 2) & (nrow(table1) == 2)) {
a<-table.element(a, round(cst$estimate, digits=2), 1,FALSE)
} else {
a<-table.element(a, '--', 1,FALSE)
}
} else {
a<-table.element(a, round(cst$statistic, digits=2), 1,FALSE)
}
a<-table.row.end(a)
if(!simulate.p.value){
if(par3!='Fisher Exact Test') {
a<-table.row.start(a)
a<-table.element(a, 'Degrees of Freedom', 1, TRUE)
a<-table.element(a, cst$parameter, 1,FALSE)
a<-table.row.end(a)
}
}
a<-table.row.start(a)
a<-table.element(a, 'P value', 1, TRUE)
a<-table.element(a, round(cst$p.value, digits=2), 1,FALSE)
a<-table.row.end(a)
a<-table.end(a)
table.save(a,file='mytable2.tab')