Free Statistics

of Irreproducible Research!

Author's title

Author*The author of this computation has been verified*
R Software Modulerwasp_multipleregression.wasp
Title produced by softwareMultiple Regression
Date of computationMon, 15 Dec 2014 14:36:11 +0000
Cite this page as followsStatistical Computations at FreeStatistics.org, Office for Research Development and Education, URL https://freestatistics.org/blog/index.php?v=date/2014/Dec/15/t1418654205si4n3y28futjz1o.htm/, Retrieved Thu, 16 May 2024 07:24:57 +0000
Statistical Computations at FreeStatistics.org, Office for Research Development and Education, URL https://freestatistics.org/blog/index.php?pk=268509, Retrieved Thu, 16 May 2024 07:24:57 +0000
QR Codes:

Original text written by user:
IsPrivate?No (this computation is public)
User-defined keywords
Estimated Impact57
Family? (F = Feedback message, R = changed R code, M = changed R Module, P = changed Parameters, D = changed Data)
-     [Cronbach Alpha] [Intrinsic Motivat...] [2010-10-12 11:42:57] [b98453cac15ba1066b407e146608df68]
- RM D  [Multiple Regression] [MR nieuw] [2014-12-10 15:58:18] [837635e05a8b7d15572545de61d5b5ed]
-   PD      [Multiple Regression] [vernieuwde] [2014-12-15 14:36:11] [76a64141a2f0df75ca87242b7cc8f1c2] [Current]
Feedback Forum

Post a new message
Dataseries X:
62 72 11 0 0 0 0 5.0
56 61 6 1 48 41 6 3.0
57 68 7 1 46 49 7 7.5
51 61 10 0 0 0 0 7.0
56 64 9 1 47 41 9 6.0
30 65 7 1 24 42 7 6.0
61 69 4 1 50 49 4 1.0
47 63 4 1 41 40 4 6.0
56 75 4 1 48 52 4 5.0
50 63 8 1 42 44 8 1.0
67 73 4 1 57 52 4 6.5
41 75 7 0 0 0 0 0.0
45 63 4 0 0 0 0 3.5
48 63 4 1 40 43 4 7.5
44 62 9 1 36 41 9 3.5
37 64 4 0 0 0 0 6.0
56 60 10 0 0 0 0 3.5
66 56 4 1 55 39 4 7.5
38 59 5 1 32 40 5 6.5
34 68 4 0 0 0 0 3.5
49 66 4 0 0 0 0 4.0
55 73 4 0 0 0 0 7.5
49 72 4 0 0 0 0 4.5
59 71 6 1 50 46 6 0.0
40 59 10 0 0 0 0 3.5
58 64 7 1 49 44 7 5.5
60 66 4 1 51 47 4 5.0
63 78 4 0 0 0 0 4.5
56 68 7 0 0 0 0 2.5
54 73 4 0 0 0 0 7.5
52 62 8 1 43 41 8 7.0
34 65 11 1 28 42 11 0.0
69 68 6 1 62 46 6 4.5
32 65 14 0 0 0 0 3.0
48 60 5 1 37 42 5 1.5
67 71 4 0 0 0 0 3.5
58 65 8 1 49 43 8 2.5
57 68 9 1 47 46 9 5.5
42 64 4 1 36 45 4 8.0
64 74 4 1 54 52 4 1.0
58 69 5 1 48 47 5 5.0
66 76 4 0 0 0 0 4.5
26 68 5 1 23 48 5 3.0
61 72 4 1 52 51 4 3.0
52 67 4 1 46 44 4 8.0
51 63 7 0 0 0 0 2.5
55 59 10 0 0 0 0 7.0
50 73 4 0 0 0 0 0.0
60 66 5 0 0 0 0 1.0
56 62 4 0 0 0 0 3.5
63 69 4 0 0 0 0 5.5
61 66 4 1 50 44 4 5.5


Summary of computational transaction
Raw Inputview raw input (R code)
Raw Outputview raw output of R engine
Computing time5 seconds
R Server'Sir Maurice George Kendall' @ kendall.wessa.net

\begin{tabular}{lllllllll}
\hline
Summary of computational transaction \tabularnewline
Raw Input & view raw input (R code)  \tabularnewline
Raw Output & view raw output of R engine  \tabularnewline
Computing time & 5 seconds \tabularnewline
R Server & 'Sir Maurice George Kendall' @ kendall.wessa.net \tabularnewline
\hline
\end{tabular}
%Source: https://freestatistics.org/blog/index.php?pk=268509&T=0

[TABLE]
[ROW][C]Summary of computational transaction[/C][/ROW]
[ROW][C]Raw Input[/C][C]view raw input (R code) [/C][/ROW]
[ROW][C]Raw Output[/C][C]view raw output of R engine [/C][/ROW]
[ROW][C]Computing time[/C][C]5 seconds[/C][/ROW]
[ROW][C]R Server[/C][C]'Sir Maurice George Kendall' @ kendall.wessa.net[/C][/ROW]
[/TABLE]
Source: https://freestatistics.org/blog/index.php?pk=268509&T=0

Globally Unique Identifier (entire table): ba.freestatistics.org/blog/index.php?pk=268509&T=0

As an alternative you can also use a QR Code:  

The GUIDs for individual cells are displayed in the table below:

Summary of computational transaction
Raw Inputview raw input (R code)
Raw Outputview raw output of R engine
Computing time5 seconds
R Server'Sir Maurice George Kendall' @ kendall.wessa.net


Multiple Linear Regression - Estimated Regression Equation
Ex[t] = + 6.15699 + 0.0425008AMS.I[t] -0.062475AMS.E[t] -0.0144101AMS.A[t] + 11.0779gender[t] -0.0315752AMS_I_NIEUW_Gender[t] -0.154091AMS_E_NIEUW_Gender[t] -0.414509AMS_A_NIEUW_Gender[t] + e[t]

\begin{tabular}{lllllllll}
\hline
Multiple Linear Regression - Estimated Regression Equation \tabularnewline
Ex[t] =  +  6.15699 +  0.0425008AMS.I[t] -0.062475AMS.E[t] -0.0144101AMS.A[t] +  11.0779gender[t] -0.0315752AMS_I_NIEUW_Gender[t] -0.154091AMS_E_NIEUW_Gender[t] -0.414509AMS_A_NIEUW_Gender[t]  + e[t] \tabularnewline
\hline
\end{tabular}
%Source: https://freestatistics.org/blog/index.php?pk=268509&T=1

[TABLE]
[ROW][C]Multiple Linear Regression - Estimated Regression Equation[/C][/ROW]
[ROW][C]Ex[t] =  +  6.15699 +  0.0425008AMS.I[t] -0.062475AMS.E[t] -0.0144101AMS.A[t] +  11.0779gender[t] -0.0315752AMS_I_NIEUW_Gender[t] -0.154091AMS_E_NIEUW_Gender[t] -0.414509AMS_A_NIEUW_Gender[t]  + e[t][/C][/ROW]
[/TABLE]
Source: https://freestatistics.org/blog/index.php?pk=268509&T=1

Globally Unique Identifier (entire table): ba.freestatistics.org/blog/index.php?pk=268509&T=1

As an alternative you can also use a QR Code:  

The GUIDs for individual cells are displayed in the table below:

Multiple Linear Regression - Estimated Regression Equation
Ex[t] = + 6.15699 + 0.0425008AMS.I[t] -0.062475AMS.E[t] -0.0144101AMS.A[t] + 11.0779gender[t] -0.0315752AMS_I_NIEUW_Gender[t] -0.154091AMS_E_NIEUW_Gender[t] -0.414509AMS_A_NIEUW_Gender[t] + e[t]


Multiple Linear Regression - Ordinary Least Squares
VariableParameterS.D.T-STATH0: parameter = 02-tail p-value1-tail p-value
(Intercept)6.156996.925780.8890.378840.18942
AMS.I0.04250080.05206840.81620.4187550.209378
AMS.E-0.0624750.0934354-0.66860.5072160.253608
AMS.A-0.01441010.181714-0.07930.9371520.468576
gender11.07798.478311.3070.1981310.0990657
AMS_I_NIEUW_Gender-0.03157520.0784647-0.40240.6893290.344664
AMS_E_NIEUW_Gender-0.1540910.165279-0.93230.3562640.178132
AMS_A_NIEUW_Gender-0.4145090.305931-1.3550.1823620.0911809

\begin{tabular}{lllllllll}
\hline
Multiple Linear Regression - Ordinary Least Squares \tabularnewline
Variable & Parameter & S.D. & T-STATH0: parameter = 0 & 2-tail p-value & 1-tail p-value \tabularnewline
(Intercept) & 6.15699 & 6.92578 & 0.889 & 0.37884 & 0.18942 \tabularnewline
AMS.I & 0.0425008 & 0.0520684 & 0.8162 & 0.418755 & 0.209378 \tabularnewline
AMS.E & -0.062475 & 0.0934354 & -0.6686 & 0.507216 & 0.253608 \tabularnewline
AMS.A & -0.0144101 & 0.181714 & -0.0793 & 0.937152 & 0.468576 \tabularnewline
gender & 11.0779 & 8.47831 & 1.307 & 0.198131 & 0.0990657 \tabularnewline
AMS_I_NIEUW_Gender & -0.0315752 & 0.0784647 & -0.4024 & 0.689329 & 0.344664 \tabularnewline
AMS_E_NIEUW_Gender & -0.154091 & 0.165279 & -0.9323 & 0.356264 & 0.178132 \tabularnewline
AMS_A_NIEUW_Gender & -0.414509 & 0.305931 & -1.355 & 0.182362 & 0.0911809 \tabularnewline
\hline
\end{tabular}
%Source: https://freestatistics.org/blog/index.php?pk=268509&T=2

[TABLE]
[ROW][C]Multiple Linear Regression - Ordinary Least Squares[/C][/ROW]
[ROW][C]Variable[/C][C]Parameter[/C][C]S.D.[/C][C]T-STATH0: parameter = 0[/C][C]2-tail p-value[/C][C]1-tail p-value[/C][/ROW]
[ROW][C](Intercept)[/C][C]6.15699[/C][C]6.92578[/C][C]0.889[/C][C]0.37884[/C][C]0.18942[/C][/ROW]
[ROW][C]AMS.I[/C][C]0.0425008[/C][C]0.0520684[/C][C]0.8162[/C][C]0.418755[/C][C]0.209378[/C][/ROW]
[ROW][C]AMS.E[/C][C]-0.062475[/C][C]0.0934354[/C][C]-0.6686[/C][C]0.507216[/C][C]0.253608[/C][/ROW]
[ROW][C]AMS.A[/C][C]-0.0144101[/C][C]0.181714[/C][C]-0.0793[/C][C]0.937152[/C][C]0.468576[/C][/ROW]
[ROW][C]gender[/C][C]11.0779[/C][C]8.47831[/C][C]1.307[/C][C]0.198131[/C][C]0.0990657[/C][/ROW]
[ROW][C]AMS_I_NIEUW_Gender[/C][C]-0.0315752[/C][C]0.0784647[/C][C]-0.4024[/C][C]0.689329[/C][C]0.344664[/C][/ROW]
[ROW][C]AMS_E_NIEUW_Gender[/C][C]-0.154091[/C][C]0.165279[/C][C]-0.9323[/C][C]0.356264[/C][C]0.178132[/C][/ROW]
[ROW][C]AMS_A_NIEUW_Gender[/C][C]-0.414509[/C][C]0.305931[/C][C]-1.355[/C][C]0.182362[/C][C]0.0911809[/C][/ROW]
[/TABLE]
Source: https://freestatistics.org/blog/index.php?pk=268509&T=2

Globally Unique Identifier (entire table): ba.freestatistics.org/blog/index.php?pk=268509&T=2

As an alternative you can also use a QR Code:  

The GUIDs for individual cells are displayed in the table below:

Multiple Linear Regression - Ordinary Least Squares
VariableParameterS.D.T-STATH0: parameter = 02-tail p-value1-tail p-value
(Intercept)6.156996.925780.8890.378840.18942
AMS.I0.04250080.05206840.81620.4187550.209378
AMS.E-0.0624750.0934354-0.66860.5072160.253608
AMS.A-0.01441010.181714-0.07930.9371520.468576
gender11.07798.478311.3070.1981310.0990657
AMS_I_NIEUW_Gender-0.03157520.0784647-0.40240.6893290.344664
AMS_E_NIEUW_Gender-0.1540910.165279-0.93230.3562640.178132
AMS_A_NIEUW_Gender-0.4145090.305931-1.3550.1823620.0911809


Multiple Linear Regression - Regression Statistics
Multiple R0.362626
R-squared0.131498
Adjusted R-squared-0.0066729
F-TEST (value)0.951705
F-TEST (DF numerator)7
F-TEST (DF denominator)44
p-value0.477629
Multiple Linear Regression - Residual Statistics
Residual Standard Deviation2.33382
Sum Squared Residuals239.656

\begin{tabular}{lllllllll}
\hline
Multiple Linear Regression - Regression Statistics \tabularnewline
Multiple R & 0.362626 \tabularnewline
R-squared & 0.131498 \tabularnewline
Adjusted R-squared & -0.0066729 \tabularnewline
F-TEST (value) & 0.951705 \tabularnewline
F-TEST (DF numerator) & 7 \tabularnewline
F-TEST (DF denominator) & 44 \tabularnewline
p-value & 0.477629 \tabularnewline
Multiple Linear Regression - Residual Statistics \tabularnewline
Residual Standard Deviation & 2.33382 \tabularnewline
Sum Squared Residuals & 239.656 \tabularnewline
\hline
\end{tabular}
%Source: https://freestatistics.org/blog/index.php?pk=268509&T=3

[TABLE]
[ROW][C]Multiple Linear Regression - Regression Statistics[/C][/ROW]
[ROW][C]Multiple R[/C][C]0.362626[/C][/ROW]
[ROW][C]R-squared[/C][C]0.131498[/C][/ROW]
[ROW][C]Adjusted R-squared[/C][C]-0.0066729[/C][/ROW]
[ROW][C]F-TEST (value)[/C][C]0.951705[/C][/ROW]
[ROW][C]F-TEST (DF numerator)[/C][C]7[/C][/ROW]
[ROW][C]F-TEST (DF denominator)[/C][C]44[/C][/ROW]
[ROW][C]p-value[/C][C]0.477629[/C][/ROW]
[ROW][C]Multiple Linear Regression - Residual Statistics[/C][/ROW]
[ROW][C]Residual Standard Deviation[/C][C]2.33382[/C][/ROW]
[ROW][C]Sum Squared Residuals[/C][C]239.656[/C][/ROW]
[/TABLE]
Source: https://freestatistics.org/blog/index.php?pk=268509&T=3

Globally Unique Identifier (entire table): ba.freestatistics.org/blog/index.php?pk=268509&T=3

As an alternative you can also use a QR Code:  

The GUIDs for individual cells are displayed in the table below:

Multiple Linear Regression - Regression Statistics
Multiple R0.362626
R-squared0.131498
Adjusted R-squared-0.0066729
F-TEST (value)0.951705
F-TEST (DF numerator)7
F-TEST (DF denominator)44
p-value0.477629
Multiple Linear Regression - Residual Statistics
Residual Standard Deviation2.33382
Sum Squared Residuals239.656


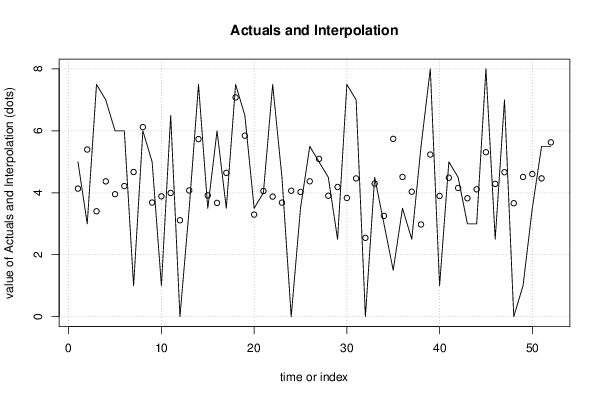
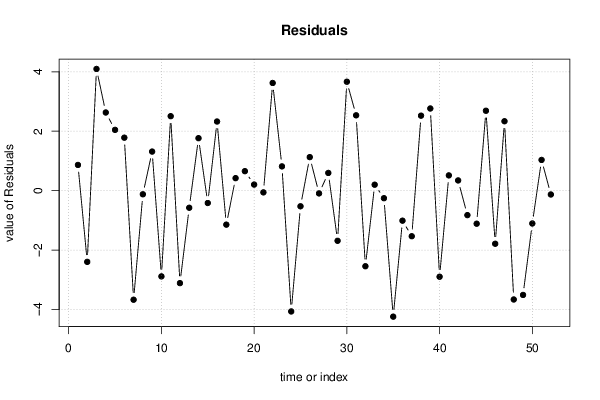
Multiple Linear Regression - Actuals, Interpolation, and Residuals
Time or IndexActualsInterpolationForecastResidualsPrediction Error
154.135330.864671
235.39711-2.39711
37.53.403784.09622
474.369462.63054
563.95452.0455
664.216981.78302
714.67177-3.67177
866.1226-0.122604
953.685291.31471
1013.88649-2.88649
116.53.993572.50643
1203.11303-3.11303
133.54.07596-0.575962
147.55.734411.76559
153.53.91676-0.416765
1663.673482.32652
173.54.64443-1.14443
187.57.079480.420518
196.55.845250.654746
203.53.296080.203922
2144.05854-0.0585398
227.53.876223.62378
234.53.683690.81631
2404.06625-4.06625
253.54.0269-0.526897
265.54.371911.12809
2755.0933-0.0933003
284.53.903850.596149
292.54.18786-1.68786
307.53.833723.66628
3174.464662.53534
3202.545-2.545
334.54.299780.200218
3433.2544-0.2544
351.55.74173-4.24173
363.54.51118-1.01118
372.54.03461-1.53461
385.52.976642.52336
3985.235052.76495
4013.89832-2.89832
4154.486680.51332
424.54.15630.343697
4333.82442-0.824419
4434.11301-1.11301
4585.310972.68903
462.54.28774-1.78774
4774.664412.33559
4803.66372-3.66372
4914.51164-3.51164
503.54.60595-1.10595
515.54.466131.03387
525.55.62965-0.129649

\begin{tabular}{lllllllll}
\hline
Multiple Linear Regression - Actuals, Interpolation, and Residuals \tabularnewline
Time or Index & Actuals & InterpolationForecast & ResidualsPrediction Error \tabularnewline
1 & 5 & 4.13533 & 0.864671 \tabularnewline
2 & 3 & 5.39711 & -2.39711 \tabularnewline
3 & 7.5 & 3.40378 & 4.09622 \tabularnewline
4 & 7 & 4.36946 & 2.63054 \tabularnewline
5 & 6 & 3.9545 & 2.0455 \tabularnewline
6 & 6 & 4.21698 & 1.78302 \tabularnewline
7 & 1 & 4.67177 & -3.67177 \tabularnewline
8 & 6 & 6.1226 & -0.122604 \tabularnewline
9 & 5 & 3.68529 & 1.31471 \tabularnewline
10 & 1 & 3.88649 & -2.88649 \tabularnewline
11 & 6.5 & 3.99357 & 2.50643 \tabularnewline
12 & 0 & 3.11303 & -3.11303 \tabularnewline
13 & 3.5 & 4.07596 & -0.575962 \tabularnewline
14 & 7.5 & 5.73441 & 1.76559 \tabularnewline
15 & 3.5 & 3.91676 & -0.416765 \tabularnewline
16 & 6 & 3.67348 & 2.32652 \tabularnewline
17 & 3.5 & 4.64443 & -1.14443 \tabularnewline
18 & 7.5 & 7.07948 & 0.420518 \tabularnewline
19 & 6.5 & 5.84525 & 0.654746 \tabularnewline
20 & 3.5 & 3.29608 & 0.203922 \tabularnewline
21 & 4 & 4.05854 & -0.0585398 \tabularnewline
22 & 7.5 & 3.87622 & 3.62378 \tabularnewline
23 & 4.5 & 3.68369 & 0.81631 \tabularnewline
24 & 0 & 4.06625 & -4.06625 \tabularnewline
25 & 3.5 & 4.0269 & -0.526897 \tabularnewline
26 & 5.5 & 4.37191 & 1.12809 \tabularnewline
27 & 5 & 5.0933 & -0.0933003 \tabularnewline
28 & 4.5 & 3.90385 & 0.596149 \tabularnewline
29 & 2.5 & 4.18786 & -1.68786 \tabularnewline
30 & 7.5 & 3.83372 & 3.66628 \tabularnewline
31 & 7 & 4.46466 & 2.53534 \tabularnewline
32 & 0 & 2.545 & -2.545 \tabularnewline
33 & 4.5 & 4.29978 & 0.200218 \tabularnewline
34 & 3 & 3.2544 & -0.2544 \tabularnewline
35 & 1.5 & 5.74173 & -4.24173 \tabularnewline
36 & 3.5 & 4.51118 & -1.01118 \tabularnewline
37 & 2.5 & 4.03461 & -1.53461 \tabularnewline
38 & 5.5 & 2.97664 & 2.52336 \tabularnewline
39 & 8 & 5.23505 & 2.76495 \tabularnewline
40 & 1 & 3.89832 & -2.89832 \tabularnewline
41 & 5 & 4.48668 & 0.51332 \tabularnewline
42 & 4.5 & 4.1563 & 0.343697 \tabularnewline
43 & 3 & 3.82442 & -0.824419 \tabularnewline
44 & 3 & 4.11301 & -1.11301 \tabularnewline
45 & 8 & 5.31097 & 2.68903 \tabularnewline
46 & 2.5 & 4.28774 & -1.78774 \tabularnewline
47 & 7 & 4.66441 & 2.33559 \tabularnewline
48 & 0 & 3.66372 & -3.66372 \tabularnewline
49 & 1 & 4.51164 & -3.51164 \tabularnewline
50 & 3.5 & 4.60595 & -1.10595 \tabularnewline
51 & 5.5 & 4.46613 & 1.03387 \tabularnewline
52 & 5.5 & 5.62965 & -0.129649 \tabularnewline
\hline
\end{tabular}
%Source: https://freestatistics.org/blog/index.php?pk=268509&T=4

[TABLE]
[ROW][C]Multiple Linear Regression - Actuals, Interpolation, and Residuals[/C][/ROW]
[ROW][C]Time or Index[/C][C]Actuals[/C][C]InterpolationForecast[/C][C]ResidualsPrediction Error[/C][/ROW]
[ROW][C]1[/C][C]5[/C][C]4.13533[/C][C]0.864671[/C][/ROW]
[ROW][C]2[/C][C]3[/C][C]5.39711[/C][C]-2.39711[/C][/ROW]
[ROW][C]3[/C][C]7.5[/C][C]3.40378[/C][C]4.09622[/C][/ROW]
[ROW][C]4[/C][C]7[/C][C]4.36946[/C][C]2.63054[/C][/ROW]
[ROW][C]5[/C][C]6[/C][C]3.9545[/C][C]2.0455[/C][/ROW]
[ROW][C]6[/C][C]6[/C][C]4.21698[/C][C]1.78302[/C][/ROW]
[ROW][C]7[/C][C]1[/C][C]4.67177[/C][C]-3.67177[/C][/ROW]
[ROW][C]8[/C][C]6[/C][C]6.1226[/C][C]-0.122604[/C][/ROW]
[ROW][C]9[/C][C]5[/C][C]3.68529[/C][C]1.31471[/C][/ROW]
[ROW][C]10[/C][C]1[/C][C]3.88649[/C][C]-2.88649[/C][/ROW]
[ROW][C]11[/C][C]6.5[/C][C]3.99357[/C][C]2.50643[/C][/ROW]
[ROW][C]12[/C][C]0[/C][C]3.11303[/C][C]-3.11303[/C][/ROW]
[ROW][C]13[/C][C]3.5[/C][C]4.07596[/C][C]-0.575962[/C][/ROW]
[ROW][C]14[/C][C]7.5[/C][C]5.73441[/C][C]1.76559[/C][/ROW]
[ROW][C]15[/C][C]3.5[/C][C]3.91676[/C][C]-0.416765[/C][/ROW]
[ROW][C]16[/C][C]6[/C][C]3.67348[/C][C]2.32652[/C][/ROW]
[ROW][C]17[/C][C]3.5[/C][C]4.64443[/C][C]-1.14443[/C][/ROW]
[ROW][C]18[/C][C]7.5[/C][C]7.07948[/C][C]0.420518[/C][/ROW]
[ROW][C]19[/C][C]6.5[/C][C]5.84525[/C][C]0.654746[/C][/ROW]
[ROW][C]20[/C][C]3.5[/C][C]3.29608[/C][C]0.203922[/C][/ROW]
[ROW][C]21[/C][C]4[/C][C]4.05854[/C][C]-0.0585398[/C][/ROW]
[ROW][C]22[/C][C]7.5[/C][C]3.87622[/C][C]3.62378[/C][/ROW]
[ROW][C]23[/C][C]4.5[/C][C]3.68369[/C][C]0.81631[/C][/ROW]
[ROW][C]24[/C][C]0[/C][C]4.06625[/C][C]-4.06625[/C][/ROW]
[ROW][C]25[/C][C]3.5[/C][C]4.0269[/C][C]-0.526897[/C][/ROW]
[ROW][C]26[/C][C]5.5[/C][C]4.37191[/C][C]1.12809[/C][/ROW]
[ROW][C]27[/C][C]5[/C][C]5.0933[/C][C]-0.0933003[/C][/ROW]
[ROW][C]28[/C][C]4.5[/C][C]3.90385[/C][C]0.596149[/C][/ROW]
[ROW][C]29[/C][C]2.5[/C][C]4.18786[/C][C]-1.68786[/C][/ROW]
[ROW][C]30[/C][C]7.5[/C][C]3.83372[/C][C]3.66628[/C][/ROW]
[ROW][C]31[/C][C]7[/C][C]4.46466[/C][C]2.53534[/C][/ROW]
[ROW][C]32[/C][C]0[/C][C]2.545[/C][C]-2.545[/C][/ROW]
[ROW][C]33[/C][C]4.5[/C][C]4.29978[/C][C]0.200218[/C][/ROW]
[ROW][C]34[/C][C]3[/C][C]3.2544[/C][C]-0.2544[/C][/ROW]
[ROW][C]35[/C][C]1.5[/C][C]5.74173[/C][C]-4.24173[/C][/ROW]
[ROW][C]36[/C][C]3.5[/C][C]4.51118[/C][C]-1.01118[/C][/ROW]
[ROW][C]37[/C][C]2.5[/C][C]4.03461[/C][C]-1.53461[/C][/ROW]
[ROW][C]38[/C][C]5.5[/C][C]2.97664[/C][C]2.52336[/C][/ROW]
[ROW][C]39[/C][C]8[/C][C]5.23505[/C][C]2.76495[/C][/ROW]
[ROW][C]40[/C][C]1[/C][C]3.89832[/C][C]-2.89832[/C][/ROW]
[ROW][C]41[/C][C]5[/C][C]4.48668[/C][C]0.51332[/C][/ROW]
[ROW][C]42[/C][C]4.5[/C][C]4.1563[/C][C]0.343697[/C][/ROW]
[ROW][C]43[/C][C]3[/C][C]3.82442[/C][C]-0.824419[/C][/ROW]
[ROW][C]44[/C][C]3[/C][C]4.11301[/C][C]-1.11301[/C][/ROW]
[ROW][C]45[/C][C]8[/C][C]5.31097[/C][C]2.68903[/C][/ROW]
[ROW][C]46[/C][C]2.5[/C][C]4.28774[/C][C]-1.78774[/C][/ROW]
[ROW][C]47[/C][C]7[/C][C]4.66441[/C][C]2.33559[/C][/ROW]
[ROW][C]48[/C][C]0[/C][C]3.66372[/C][C]-3.66372[/C][/ROW]
[ROW][C]49[/C][C]1[/C][C]4.51164[/C][C]-3.51164[/C][/ROW]
[ROW][C]50[/C][C]3.5[/C][C]4.60595[/C][C]-1.10595[/C][/ROW]
[ROW][C]51[/C][C]5.5[/C][C]4.46613[/C][C]1.03387[/C][/ROW]
[ROW][C]52[/C][C]5.5[/C][C]5.62965[/C][C]-0.129649[/C][/ROW]
[/TABLE]
Source: https://freestatistics.org/blog/index.php?pk=268509&T=4

Globally Unique Identifier (entire table): ba.freestatistics.org/blog/index.php?pk=268509&T=4

As an alternative you can also use a QR Code:  

The GUIDs for individual cells are displayed in the table below:

Multiple Linear Regression - Actuals, Interpolation, and Residuals
Time or IndexActualsInterpolationForecastResidualsPrediction Error
154.135330.864671
235.39711-2.39711
37.53.403784.09622
474.369462.63054
563.95452.0455
664.216981.78302
714.67177-3.67177
866.1226-0.122604
953.685291.31471
1013.88649-2.88649
116.53.993572.50643
1203.11303-3.11303
133.54.07596-0.575962
147.55.734411.76559
153.53.91676-0.416765
1663.673482.32652
173.54.64443-1.14443
187.57.079480.420518
196.55.845250.654746
203.53.296080.203922
2144.05854-0.0585398
227.53.876223.62378
234.53.683690.81631
2404.06625-4.06625
253.54.0269-0.526897
265.54.371911.12809
2755.0933-0.0933003
284.53.903850.596149
292.54.18786-1.68786
307.53.833723.66628
3174.464662.53534
3202.545-2.545
334.54.299780.200218
3433.2544-0.2544
351.55.74173-4.24173
363.54.51118-1.01118
372.54.03461-1.53461
385.52.976642.52336
3985.235052.76495
4013.89832-2.89832
4154.486680.51332
424.54.15630.343697
4333.82442-0.824419
4434.11301-1.11301
4585.310972.68903
462.54.28774-1.78774
4774.664412.33559
4803.66372-3.66372
4914.51164-3.51164
503.54.60595-1.10595
515.54.466131.03387
525.55.62965-0.129649


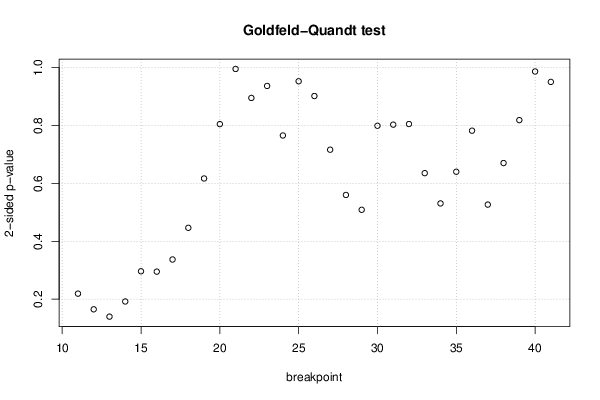
Goldfeld-Quandt test for Heteroskedasticity
p-valuesAlternative Hypothesis
breakpoint indexgreater2-sidedless
110.8905170.2189650.109483
120.9175110.1649780.082489
130.9302140.1395720.0697858
140.9040170.1919650.0959826
150.8518060.2963870.148194
160.8524740.2950530.147526
170.8315020.3369960.168498
180.7767930.4464140.223207
190.6916090.6167810.308391
200.5976970.8046060.402303
210.4975380.9950750.502462
220.5524970.8950060.447503
230.4681750.936350.531825
240.6173420.7653160.382658
250.5237320.9525360.476268
260.4507890.9015770.549211
270.358080.7161610.64192
280.2799250.5598510.720075
290.2543190.5086370.745681
300.3993890.7987770.600611
310.4013250.802650.598675
320.402410.8048210.59759
330.3176060.6352120.682394
340.2653090.5306190.734691
350.6800070.6399850.319993
360.6090950.781810.390905
370.7367120.5265760.263288
380.6649780.6700440.335022
390.590830.818340.40917
400.4931540.9863080.506846
410.5248670.9502650.475133

\begin{tabular}{lllllllll}
\hline
Goldfeld-Quandt test for Heteroskedasticity \tabularnewline
p-values & Alternative Hypothesis \tabularnewline
breakpoint index & greater & 2-sided & less \tabularnewline
11 & 0.890517 & 0.218965 & 0.109483 \tabularnewline
12 & 0.917511 & 0.164978 & 0.082489 \tabularnewline
13 & 0.930214 & 0.139572 & 0.0697858 \tabularnewline
14 & 0.904017 & 0.191965 & 0.0959826 \tabularnewline
15 & 0.851806 & 0.296387 & 0.148194 \tabularnewline
16 & 0.852474 & 0.295053 & 0.147526 \tabularnewline
17 & 0.831502 & 0.336996 & 0.168498 \tabularnewline
18 & 0.776793 & 0.446414 & 0.223207 \tabularnewline
19 & 0.691609 & 0.616781 & 0.308391 \tabularnewline
20 & 0.597697 & 0.804606 & 0.402303 \tabularnewline
21 & 0.497538 & 0.995075 & 0.502462 \tabularnewline
22 & 0.552497 & 0.895006 & 0.447503 \tabularnewline
23 & 0.468175 & 0.93635 & 0.531825 \tabularnewline
24 & 0.617342 & 0.765316 & 0.382658 \tabularnewline
25 & 0.523732 & 0.952536 & 0.476268 \tabularnewline
26 & 0.450789 & 0.901577 & 0.549211 \tabularnewline
27 & 0.35808 & 0.716161 & 0.64192 \tabularnewline
28 & 0.279925 & 0.559851 & 0.720075 \tabularnewline
29 & 0.254319 & 0.508637 & 0.745681 \tabularnewline
30 & 0.399389 & 0.798777 & 0.600611 \tabularnewline
31 & 0.401325 & 0.80265 & 0.598675 \tabularnewline
32 & 0.40241 & 0.804821 & 0.59759 \tabularnewline
33 & 0.317606 & 0.635212 & 0.682394 \tabularnewline
34 & 0.265309 & 0.530619 & 0.734691 \tabularnewline
35 & 0.680007 & 0.639985 & 0.319993 \tabularnewline
36 & 0.609095 & 0.78181 & 0.390905 \tabularnewline
37 & 0.736712 & 0.526576 & 0.263288 \tabularnewline
38 & 0.664978 & 0.670044 & 0.335022 \tabularnewline
39 & 0.59083 & 0.81834 & 0.40917 \tabularnewline
40 & 0.493154 & 0.986308 & 0.506846 \tabularnewline
41 & 0.524867 & 0.950265 & 0.475133 \tabularnewline
\hline
\end{tabular}
%Source: https://freestatistics.org/blog/index.php?pk=268509&T=5

[TABLE]
[ROW][C]Goldfeld-Quandt test for Heteroskedasticity[/C][/ROW]
[ROW][C]p-values[/C][C]Alternative Hypothesis[/C][/ROW]
[ROW][C]breakpoint index[/C][C]greater[/C][C]2-sided[/C][C]less[/C][/ROW]
[ROW][C]11[/C][C]0.890517[/C][C]0.218965[/C][C]0.109483[/C][/ROW]
[ROW][C]12[/C][C]0.917511[/C][C]0.164978[/C][C]0.082489[/C][/ROW]
[ROW][C]13[/C][C]0.930214[/C][C]0.139572[/C][C]0.0697858[/C][/ROW]
[ROW][C]14[/C][C]0.904017[/C][C]0.191965[/C][C]0.0959826[/C][/ROW]
[ROW][C]15[/C][C]0.851806[/C][C]0.296387[/C][C]0.148194[/C][/ROW]
[ROW][C]16[/C][C]0.852474[/C][C]0.295053[/C][C]0.147526[/C][/ROW]
[ROW][C]17[/C][C]0.831502[/C][C]0.336996[/C][C]0.168498[/C][/ROW]
[ROW][C]18[/C][C]0.776793[/C][C]0.446414[/C][C]0.223207[/C][/ROW]
[ROW][C]19[/C][C]0.691609[/C][C]0.616781[/C][C]0.308391[/C][/ROW]
[ROW][C]20[/C][C]0.597697[/C][C]0.804606[/C][C]0.402303[/C][/ROW]
[ROW][C]21[/C][C]0.497538[/C][C]0.995075[/C][C]0.502462[/C][/ROW]
[ROW][C]22[/C][C]0.552497[/C][C]0.895006[/C][C]0.447503[/C][/ROW]
[ROW][C]23[/C][C]0.468175[/C][C]0.93635[/C][C]0.531825[/C][/ROW]
[ROW][C]24[/C][C]0.617342[/C][C]0.765316[/C][C]0.382658[/C][/ROW]
[ROW][C]25[/C][C]0.523732[/C][C]0.952536[/C][C]0.476268[/C][/ROW]
[ROW][C]26[/C][C]0.450789[/C][C]0.901577[/C][C]0.549211[/C][/ROW]
[ROW][C]27[/C][C]0.35808[/C][C]0.716161[/C][C]0.64192[/C][/ROW]
[ROW][C]28[/C][C]0.279925[/C][C]0.559851[/C][C]0.720075[/C][/ROW]
[ROW][C]29[/C][C]0.254319[/C][C]0.508637[/C][C]0.745681[/C][/ROW]
[ROW][C]30[/C][C]0.399389[/C][C]0.798777[/C][C]0.600611[/C][/ROW]
[ROW][C]31[/C][C]0.401325[/C][C]0.80265[/C][C]0.598675[/C][/ROW]
[ROW][C]32[/C][C]0.40241[/C][C]0.804821[/C][C]0.59759[/C][/ROW]
[ROW][C]33[/C][C]0.317606[/C][C]0.635212[/C][C]0.682394[/C][/ROW]
[ROW][C]34[/C][C]0.265309[/C][C]0.530619[/C][C]0.734691[/C][/ROW]
[ROW][C]35[/C][C]0.680007[/C][C]0.639985[/C][C]0.319993[/C][/ROW]
[ROW][C]36[/C][C]0.609095[/C][C]0.78181[/C][C]0.390905[/C][/ROW]
[ROW][C]37[/C][C]0.736712[/C][C]0.526576[/C][C]0.263288[/C][/ROW]
[ROW][C]38[/C][C]0.664978[/C][C]0.670044[/C][C]0.335022[/C][/ROW]
[ROW][C]39[/C][C]0.59083[/C][C]0.81834[/C][C]0.40917[/C][/ROW]
[ROW][C]40[/C][C]0.493154[/C][C]0.986308[/C][C]0.506846[/C][/ROW]
[ROW][C]41[/C][C]0.524867[/C][C]0.950265[/C][C]0.475133[/C][/ROW]
[/TABLE]
Source: https://freestatistics.org/blog/index.php?pk=268509&T=5

Globally Unique Identifier (entire table): ba.freestatistics.org/blog/index.php?pk=268509&T=5

As an alternative you can also use a QR Code:  

The GUIDs for individual cells are displayed in the table below:

Goldfeld-Quandt test for Heteroskedasticity
p-valuesAlternative Hypothesis
breakpoint indexgreater2-sidedless
110.8905170.2189650.109483
120.9175110.1649780.082489
130.9302140.1395720.0697858
140.9040170.1919650.0959826
150.8518060.2963870.148194
160.8524740.2950530.147526
170.8315020.3369960.168498
180.7767930.4464140.223207
190.6916090.6167810.308391
200.5976970.8046060.402303
210.4975380.9950750.502462
220.5524970.8950060.447503
230.4681750.936350.531825
240.6173420.7653160.382658
250.5237320.9525360.476268
260.4507890.9015770.549211
270.358080.7161610.64192
280.2799250.5598510.720075
290.2543190.5086370.745681
300.3993890.7987770.600611
310.4013250.802650.598675
320.402410.8048210.59759
330.3176060.6352120.682394
340.2653090.5306190.734691
350.6800070.6399850.319993
360.6090950.781810.390905
370.7367120.5265760.263288
380.6649780.6700440.335022
390.590830.818340.40917
400.4931540.9863080.506846
410.5248670.9502650.475133


Meta Analysis of Goldfeld-Quandt test for Heteroskedasticity
Description# significant tests% significant testsOK/NOK
1% type I error level00OK
5% type I error level00OK
10% type I error level00OK

\begin{tabular}{lllllllll}
\hline
Meta Analysis of Goldfeld-Quandt test for Heteroskedasticity \tabularnewline
Description & # significant tests & % significant tests & OK/NOK \tabularnewline
1% type I error level & 0 & 0 & OK \tabularnewline
5% type I error level & 0 & 0 & OK \tabularnewline
10% type I error level & 0 & 0 & OK \tabularnewline
\hline
\end{tabular}
%Source: https://freestatistics.org/blog/index.php?pk=268509&T=6

[TABLE]
[ROW][C]Meta Analysis of Goldfeld-Quandt test for Heteroskedasticity[/C][/ROW]
[ROW][C]Description[/C][C]# significant tests[/C][C]% significant tests[/C][C]OK/NOK[/C][/ROW]
[ROW][C]1% type I error level[/C][C]0[/C][C]0[/C][C]OK[/C][/ROW]
[ROW][C]5% type I error level[/C][C]0[/C][C]0[/C][C]OK[/C][/ROW]
[ROW][C]10% type I error level[/C][C]0[/C][C]0[/C][C]OK[/C][/ROW]
[/TABLE]
Source: https://freestatistics.org/blog/index.php?pk=268509&T=6

Globally Unique Identifier (entire table): ba.freestatistics.org/blog/index.php?pk=268509&T=6

As an alternative you can also use a QR Code:  

The GUIDs for individual cells are displayed in the table below:

Meta Analysis of Goldfeld-Quandt test for Heteroskedasticity
Description# significant tests% significant testsOK/NOK
1% type I error level00OK
5% type I error level00OK
10% type I error level00OK


Parameters (Session):
par1 = 8 ; par2 = Do not include Seasonal Dummies ; par3 = No Linear Trend ;
Parameters (R input):
par1 = 8 ; par2 = Do not include Seasonal Dummies ; par3 = No Linear Trend ;
R code (references can be found in the software module):
library(lattice)
library(lmtest)
n25 <- 25 #minimum number of obs. for Goldfeld-Quandt test
par1 <- as.numeric(par1)
x <- t(y)
k <- length(x[1,])
n <- length(x[,1])
x1 <- cbind(x[,par1], x[,1:k!=par1])
mycolnames <- c(colnames(x)[par1], colnames(x)[1:k!=par1])
colnames(x1) <- mycolnames #colnames(x)[par1]
x <- x1
if (par3 == 'First Differences'){
x2 <- array(0, dim=c(n-1,k), dimnames=list(1:(n-1), paste('(1-B)',colnames(x),sep='')))
for (i in 1:n-1) {
for (j in 1:k) {
x2[i,j] <- x[i+1,j] - x[i,j]
}
}
x <- x2
}
if (par2 == 'Include Monthly Dummies'){
x2 <- array(0, dim=c(n,11), dimnames=list(1:n, paste('M', seq(1:11), sep ='')))
for (i in 1:11){
x2[seq(i,n,12),i] <- 1
}
x <- cbind(x, x2)
}
if (par2 == 'Include Quarterly Dummies'){
x2 <- array(0, dim=c(n,3), dimnames=list(1:n, paste('Q', seq(1:3), sep ='')))
for (i in 1:3){
x2[seq(i,n,4),i] <- 1
}
x <- cbind(x, x2)
}
k <- length(x[1,])
if (par3 == 'Linear Trend'){
x <- cbind(x, c(1:n))
colnames(x)[k+1] <- 't'
}
x
k <- length(x[1,])
df <- as.data.frame(x)
(mylm <- lm(df))
(mysum <- summary(mylm))
if (n > n25) {
kp3 <- k + 3
nmkm3 <- n - k - 3
gqarr <- array(NA, dim=c(nmkm3-kp3+1,3))
numgqtests <- 0
numsignificant1 <- 0
numsignificant5 <- 0
numsignificant10 <- 0
for (mypoint in kp3:nmkm3) {
j <- 0
numgqtests <- numgqtests + 1
for (myalt in c('greater', 'two.sided', 'less')) {
j <- j + 1
gqarr[mypoint-kp3+1,j] <- gqtest(mylm, point=mypoint, alternative=myalt)$p.value
}
if (gqarr[mypoint-kp3+1,2] < 0.01) numsignificant1 <- numsignificant1 + 1
if (gqarr[mypoint-kp3+1,2] < 0.05) numsignificant5 <- numsignificant5 + 1
if (gqarr[mypoint-kp3+1,2] < 0.10) numsignificant10 <- numsignificant10 + 1
}
gqarr
}
bitmap(file='test0.png')
plot(x[,1], type='l', main='Actuals and Interpolation', ylab='value of Actuals and Interpolation (dots)', xlab='time or index')
points(x[,1]-mysum$resid)
grid()
dev.off()
bitmap(file='test1.png')
plot(mysum$resid, type='b', pch=19, main='Residuals', ylab='value of Residuals', xlab='time or index')
grid()
dev.off()
bitmap(file='test2.png')
hist(mysum$resid, main='Residual Histogram', xlab='values of Residuals')
grid()
dev.off()
bitmap(file='test3.png')
densityplot(~mysum$resid,col='black',main='Residual Density Plot', xlab='values of Residuals')
dev.off()
bitmap(file='test4.png')
qqnorm(mysum$resid, main='Residual Normal Q-Q Plot')
qqline(mysum$resid)
grid()
dev.off()
(myerror <- as.ts(mysum$resid))
bitmap(file='test5.png')
dum <- cbind(lag(myerror,k=1),myerror)
dum
dum1 <- dum[2:length(myerror),]
dum1
z <- as.data.frame(dum1)
z
plot(z,main=paste('Residual Lag plot, lowess, and regression line'), ylab='values of Residuals', xlab='lagged values of Residuals')
lines(lowess(z))
abline(lm(z))
grid()
dev.off()
bitmap(file='test6.png')
acf(mysum$resid, lag.max=length(mysum$resid)/2, main='Residual Autocorrelation Function')
grid()
dev.off()
bitmap(file='test7.png')
pacf(mysum$resid, lag.max=length(mysum$resid)/2, main='Residual Partial Autocorrelation Function')
grid()
dev.off()
bitmap(file='test8.png')
opar <- par(mfrow = c(2,2), oma = c(0, 0, 1.1, 0))
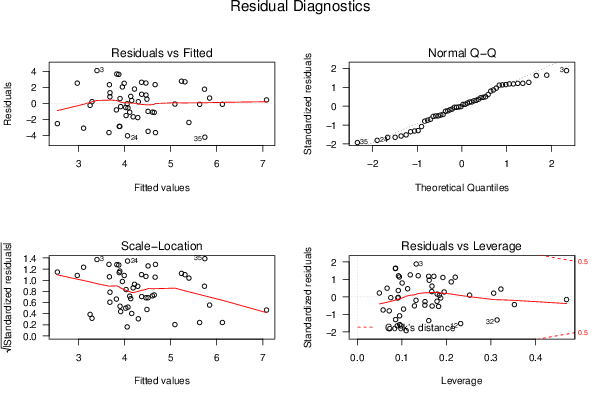
plot(mylm, las = 1, sub='Residual Diagnostics')
par(opar)
dev.off()
if (n > n25) {
bitmap(file='test9.png')
plot(kp3:nmkm3,gqarr[,2], main='Goldfeld-Quandt test',ylab='2-sided p-value',xlab='breakpoint')
grid()
dev.off()
}
load(file='createtable')
a<-table.start()
a<-table.row.start(a)
a<-table.element(a, 'Multiple Linear Regression - Estimated Regression Equation', 1, TRUE)
a<-table.row.end(a)
myeq <- colnames(x)[1]
myeq <- paste(myeq, '[t] = ', sep='')
for (i in 1:k){
if (mysum$coefficients[i,1] > 0) myeq <- paste(myeq, '+', '')
myeq <- paste(myeq, signif(mysum$coefficients[i,1],6), sep=' ')
if (rownames(mysum$coefficients)[i] != '(Intercept)') {
myeq <- paste(myeq, rownames(mysum$coefficients)[i], sep='')
if (rownames(mysum$coefficients)[i] != 't') myeq <- paste(myeq, '[t]', sep='')
}
}
myeq <- paste(myeq, ' + e[t]')
a<-table.row.start(a)
a<-table.element(a, myeq)
a<-table.row.end(a)
a<-table.end(a)
table.save(a,file='mytable1.tab')
a<-table.start()
a<-table.row.start(a)
a<-table.element(a,hyperlink('ols1.htm','Multiple Linear Regression - Ordinary Least Squares',''), 6, TRUE)
a<-table.row.end(a)
a<-table.row.start(a)
a<-table.element(a,'Variable',header=TRUE)
a<-table.element(a,'Parameter',header=TRUE)
a<-table.element(a,'S.D.',header=TRUE)
a<-table.element(a,'T-STAT
H0: parameter = 0',header=TRUE)
a<-table.element(a,'2-tail p-value',header=TRUE)
a<-table.element(a,'1-tail p-value',header=TRUE)
a<-table.row.end(a)
for (i in 1:k){
a<-table.row.start(a)
a<-table.element(a,rownames(mysum$coefficients)[i],header=TRUE)
a<-table.element(a,signif(mysum$coefficients[i,1],6))
a<-table.element(a, signif(mysum$coefficients[i,2],6))
a<-table.element(a, signif(mysum$coefficients[i,3],4))
a<-table.element(a, signif(mysum$coefficients[i,4],6))
a<-table.element(a, signif(mysum$coefficients[i,4]/2,6))
a<-table.row.end(a)
}
a<-table.end(a)
table.save(a,file='mytable2.tab')
a<-table.start()
a<-table.row.start(a)
a<-table.element(a, 'Multiple Linear Regression - Regression Statistics', 2, TRUE)
a<-table.row.end(a)
a<-table.row.start(a)
a<-table.element(a, 'Multiple R',1,TRUE)
a<-table.element(a, signif(sqrt(mysum$r.squared),6))
a<-table.row.end(a)
a<-table.row.start(a)
a<-table.element(a, 'R-squared',1,TRUE)
a<-table.element(a, signif(mysum$r.squared,6))
a<-table.row.end(a)
a<-table.row.start(a)
a<-table.element(a, 'Adjusted R-squared',1,TRUE)
a<-table.element(a, signif(mysum$adj.r.squared,6))
a<-table.row.end(a)
a<-table.row.start(a)
a<-table.element(a, 'F-TEST (value)',1,TRUE)
a<-table.element(a, signif(mysum$fstatistic[1],6))
a<-table.row.end(a)
a<-table.row.start(a)
a<-table.element(a, 'F-TEST (DF numerator)',1,TRUE)
a<-table.element(a, signif(mysum$fstatistic[2],6))
a<-table.row.end(a)
a<-table.row.start(a)
a<-table.element(a, 'F-TEST (DF denominator)',1,TRUE)
a<-table.element(a, signif(mysum$fstatistic[3],6))
a<-table.row.end(a)
a<-table.row.start(a)
a<-table.element(a, 'p-value',1,TRUE)
a<-table.element(a, signif(1-pf(mysum$fstatistic[1],mysum$fstatistic[2],mysum$fstatistic[3]),6))
a<-table.row.end(a)
a<-table.row.start(a)
a<-table.element(a, 'Multiple Linear Regression - Residual Statistics', 2, TRUE)
a<-table.row.end(a)
a<-table.row.start(a)
a<-table.element(a, 'Residual Standard Deviation',1,TRUE)
a<-table.element(a, signif(mysum$sigma,6))
a<-table.row.end(a)
a<-table.row.start(a)
a<-table.element(a, 'Sum Squared Residuals',1,TRUE)
a<-table.element(a, signif(sum(myerror*myerror),6))
a<-table.row.end(a)
a<-table.end(a)
table.save(a,file='mytable3.tab')
a<-table.start()
a<-table.row.start(a)
a<-table.element(a, 'Multiple Linear Regression - Actuals, Interpolation, and Residuals', 4, TRUE)
a<-table.row.end(a)
a<-table.row.start(a)
a<-table.element(a, 'Time or Index', 1, TRUE)
a<-table.element(a, 'Actuals', 1, TRUE)
a<-table.element(a, 'Interpolation
Forecast', 1, TRUE)
a<-table.element(a, 'Residuals
Prediction Error', 1, TRUE)
a<-table.row.end(a)
for (i in 1:n) {
a<-table.row.start(a)
a<-table.element(a,i, 1, TRUE)
a<-table.element(a,signif(x[i],6))
a<-table.element(a,signif(x[i]-mysum$resid[i],6))
a<-table.element(a,signif(mysum$resid[i],6))
a<-table.row.end(a)
}
a<-table.end(a)
table.save(a,file='mytable4.tab')
if (n > n25) {
a<-table.start()
a<-table.row.start(a)
a<-table.element(a,'Goldfeld-Quandt test for Heteroskedasticity',4,TRUE)
a<-table.row.end(a)
a<-table.row.start(a)
a<-table.element(a,'p-values',header=TRUE)
a<-table.element(a,'Alternative Hypothesis',3,header=TRUE)
a<-table.row.end(a)
a<-table.row.start(a)
a<-table.element(a,'breakpoint index',header=TRUE)
a<-table.element(a,'greater',header=TRUE)
a<-table.element(a,'2-sided',header=TRUE)
a<-table.element(a,'less',header=TRUE)
a<-table.row.end(a)
for (mypoint in kp3:nmkm3) {
a<-table.row.start(a)
a<-table.element(a,mypoint,header=TRUE)
a<-table.element(a,signif(gqarr[mypoint-kp3+1,1],6))
a<-table.element(a,signif(gqarr[mypoint-kp3+1,2],6))
a<-table.element(a,signif(gqarr[mypoint-kp3+1,3],6))
a<-table.row.end(a)
}
a<-table.end(a)
table.save(a,file='mytable5.tab')
a<-table.start()
a<-table.row.start(a)
a<-table.element(a,'Meta Analysis of Goldfeld-Quandt test for Heteroskedasticity',4,TRUE)
a<-table.row.end(a)
a<-table.row.start(a)
a<-table.element(a,'Description',header=TRUE)
a<-table.element(a,'# significant tests',header=TRUE)
a<-table.element(a,'% significant tests',header=TRUE)
a<-table.element(a,'OK/NOK',header=TRUE)
a<-table.row.end(a)
a<-table.row.start(a)
a<-table.element(a,'1% type I error level',header=TRUE)
a<-table.element(a,signif(numsignificant1,6))
a<-table.element(a,signif(numsignificant1/numgqtests,6))
if (numsignificant1/numgqtests < 0.01) dum <- 'OK' else dum <- 'NOK'
a<-table.element(a,dum)
a<-table.row.end(a)
a<-table.row.start(a)
a<-table.element(a,'5% type I error level',header=TRUE)
a<-table.element(a,signif(numsignificant5,6))
a<-table.element(a,signif(numsignificant5/numgqtests,6))
if (numsignificant5/numgqtests < 0.05) dum <- 'OK' else dum <- 'NOK'
a<-table.element(a,dum)
a<-table.row.end(a)
a<-table.row.start(a)
a<-table.element(a,'10% type I error level',header=TRUE)
a<-table.element(a,signif(numsignificant10,6))
a<-table.element(a,signif(numsignificant10/numgqtests,6))
if (numsignificant10/numgqtests < 0.1) dum <- 'OK' else dum <- 'NOK'
a<-table.element(a,dum)
a<-table.row.end(a)
a<-table.end(a)
table.save(a,file='mytable6.tab')
}