Free Statistics

of Irreproducible Research!

Author's title

Author*The author of this computation has been verified*
R Software Modulerwasp_multipleregression.wasp
Title produced by softwareMultiple Regression
Date of computationMon, 15 Dec 2014 15:26:22 +0000
Cite this page as followsStatistical Computations at FreeStatistics.org, Office for Research Development and Education, URL https://freestatistics.org/blog/index.php?v=date/2014/Dec/15/t14186573113nzr76hdqdnib8i.htm/, Retrieved Thu, 16 May 2024 10:38:36 +0000
Statistical Computations at FreeStatistics.org, Office for Research Development and Education, URL https://freestatistics.org/blog/index.php?pk=268633, Retrieved Thu, 16 May 2024 10:38:36 +0000
QR Codes:

Original text written by user:
IsPrivate?No (this computation is public)
User-defined keywords
Estimated Impact72
Family? (F = Feedback message, R = changed R code, M = changed R Module, P = changed Parameters, D = changed Data)
-     [Chi-Squared Test, McNemar Test, and Fisher Exact Test] [P chi AMSIBconfstat] [2014-12-15 09:53:08] [46c7ebd23dbdec306a09830d8b7528e7]
- RM D    [Multiple Regression] [P MR MOTsCESDT] [2014-12-15 15:26:22] [9772ee27deeac3d50cc1fb84835cd7d6] [Current]
Feedback Forum

Post a new message
Dataseries X:
26 50 4 13
57 62 4 16
37 54 5 11
67 71 4 10
43 54 4 9
52 65 9 8
52 73 8 26
43 52 11 10
84 84 4 10
67 42 4 8
49 66 6 13
70 65 4 11
52 78 8 8
58 73 4 12
68 75 4 24
43 66 4 5
56 70 4 14
74 81 6 9
65 71 4 8
63 69 8 17
58 71 5 18
57 72 4 16
63 68 9 23
53 70 4 9
64 67 4 10
53 76 4 8
29 70 7 10
54 60 12 19
58 72 7 11
43 69 5 16
51 71 8 12
53 62 5 11
54 70 4 11
61 58 7 13
47 76 4 14
39 52 4 8
48 59 4 11
50 68 4 11
35 76 4 13
68 67 4 15
49 59 7 16
67 76 4 12
43 60 4 12
62 63 4 7
57 70 4 8
54 66 12 20
61 64 4 16
56 70 5 11
41 75 15 26
43 61 5 9
53 60 10 15
66 73 8 21
58 61 4 20
46 66 5 20
51 59 9 15
51 64 4 10
37 78 4 17
59 53 6 10
42 67 7 19
66 66 4 8
53 71 4 9


Summary of computational transaction
Raw Inputview raw input (R code)
Raw Outputview raw output of R engine
Computing time5 seconds
R Server'Sir Ronald Aylmer Fisher' @ fisher.wessa.net

\begin{tabular}{lllllllll}
\hline
Summary of computational transaction \tabularnewline
Raw Input & view raw input (R code)  \tabularnewline
Raw Output & view raw output of R engine  \tabularnewline
Computing time & 5 seconds \tabularnewline
R Server & 'Sir Ronald Aylmer Fisher' @ fisher.wessa.net \tabularnewline
\hline
\end{tabular}
%Source: https://freestatistics.org/blog/index.php?pk=268633&T=0

[TABLE]
[ROW][C]Summary of computational transaction[/C][/ROW]
[ROW][C]Raw Input[/C][C]view raw input (R code) [/C][/ROW]
[ROW][C]Raw Output[/C][C]view raw output of R engine [/C][/ROW]
[ROW][C]Computing time[/C][C]5 seconds[/C][/ROW]
[ROW][C]R Server[/C][C]'Sir Ronald Aylmer Fisher' @ fisher.wessa.net[/C][/ROW]
[/TABLE]
Source: https://freestatistics.org/blog/index.php?pk=268633&T=0

Globally Unique Identifier (entire table): ba.freestatistics.org/blog/index.php?pk=268633&T=0

As an alternative you can also use a QR Code:  

The GUIDs for individual cells are displayed in the table below:

Summary of computational transaction
Raw Inputview raw input (R code)
Raw Outputview raw output of R engine
Computing time5 seconds
R Server'Sir Ronald Aylmer Fisher' @ fisher.wessa.net


Multiple Linear Regression - Estimated Regression Equation
CESDTOTS[t] = + 0.540707 -0.00381109AMS.IS[t] + 0.115621AMS.ES[t] + 0.900398AMS.AS[t] + e[t]

\begin{tabular}{lllllllll}
\hline
Multiple Linear Regression - Estimated Regression Equation \tabularnewline
CESDTOTS[t] =  +  0.540707 -0.00381109AMS.IS[t] +  0.115621AMS.ES[t] +  0.900398AMS.AS[t]  + e[t] \tabularnewline
\hline
\end{tabular}
%Source: https://freestatistics.org/blog/index.php?pk=268633&T=1

[TABLE]
[ROW][C]Multiple Linear Regression - Estimated Regression Equation[/C][/ROW]
[ROW][C]CESDTOTS[t] =  +  0.540707 -0.00381109AMS.IS[t] +  0.115621AMS.ES[t] +  0.900398AMS.AS[t]  + e[t][/C][/ROW]
[/TABLE]
Source: https://freestatistics.org/blog/index.php?pk=268633&T=1

Globally Unique Identifier (entire table): ba.freestatistics.org/blog/index.php?pk=268633&T=1

As an alternative you can also use a QR Code:  

The GUIDs for individual cells are displayed in the table below:

Multiple Linear Regression - Estimated Regression Equation
CESDTOTS[t] = + 0.540707 -0.00381109AMS.IS[t] + 0.115621AMS.ES[t] + 0.900398AMS.AS[t] + e[t]


Multiple Linear Regression - Ordinary Least Squares
VariableParameterS.D.T-STATH0: parameter = 02-tail p-value1-tail p-value
(Intercept)0.5407075.148580.1050.9167280.458364
AMS.IS-0.003811090.0538618-0.070760.9438390.47192
AMS.ES0.1156210.07249871.5950.1162860.058143
AMS.AS0.9003980.2260593.9830.0001952179.76083e-05

\begin{tabular}{lllllllll}
\hline
Multiple Linear Regression - Ordinary Least Squares \tabularnewline
Variable & Parameter & S.D. & T-STATH0: parameter = 0 & 2-tail p-value & 1-tail p-value \tabularnewline
(Intercept) & 0.540707 & 5.14858 & 0.105 & 0.916728 & 0.458364 \tabularnewline
AMS.IS & -0.00381109 & 0.0538618 & -0.07076 & 0.943839 & 0.47192 \tabularnewline
AMS.ES & 0.115621 & 0.0724987 & 1.595 & 0.116286 & 0.058143 \tabularnewline
AMS.AS & 0.900398 & 0.226059 & 3.983 & 0.000195217 & 9.76083e-05 \tabularnewline
\hline
\end{tabular}
%Source: https://freestatistics.org/blog/index.php?pk=268633&T=2

[TABLE]
[ROW][C]Multiple Linear Regression - Ordinary Least Squares[/C][/ROW]
[ROW][C]Variable[/C][C]Parameter[/C][C]S.D.[/C][C]T-STATH0: parameter = 0[/C][C]2-tail p-value[/C][C]1-tail p-value[/C][/ROW]
[ROW][C](Intercept)[/C][C]0.540707[/C][C]5.14858[/C][C]0.105[/C][C]0.916728[/C][C]0.458364[/C][/ROW]
[ROW][C]AMS.IS[/C][C]-0.00381109[/C][C]0.0538618[/C][C]-0.07076[/C][C]0.943839[/C][C]0.47192[/C][/ROW]
[ROW][C]AMS.ES[/C][C]0.115621[/C][C]0.0724987[/C][C]1.595[/C][C]0.116286[/C][C]0.058143[/C][/ROW]
[ROW][C]AMS.AS[/C][C]0.900398[/C][C]0.226059[/C][C]3.983[/C][C]0.000195217[/C][C]9.76083e-05[/C][/ROW]
[/TABLE]
Source: https://freestatistics.org/blog/index.php?pk=268633&T=2

Globally Unique Identifier (entire table): ba.freestatistics.org/blog/index.php?pk=268633&T=2

As an alternative you can also use a QR Code:  

The GUIDs for individual cells are displayed in the table below:

Multiple Linear Regression - Ordinary Least Squares
VariableParameterS.D.T-STATH0: parameter = 02-tail p-value1-tail p-value
(Intercept)0.5407075.148580.1050.9167280.458364
AMS.IS-0.003811090.0538618-0.070760.9438390.47192
AMS.ES0.1156210.07249871.5950.1162860.058143
AMS.AS0.9003980.2260593.9830.0001952179.76083e-05


Multiple Linear Regression - Regression Statistics
Multiple R0.494292
R-squared0.244324
Adjusted R-squared0.204552
F-TEST (value)6.14306
F-TEST (DF numerator)3
F-TEST (DF denominator)57
p-value0.00107967
Multiple Linear Regression - Residual Statistics
Residual Standard Deviation4.36273
Sum Squared Residuals1084.9

\begin{tabular}{lllllllll}
\hline
Multiple Linear Regression - Regression Statistics \tabularnewline
Multiple R & 0.494292 \tabularnewline
R-squared & 0.244324 \tabularnewline
Adjusted R-squared & 0.204552 \tabularnewline
F-TEST (value) & 6.14306 \tabularnewline
F-TEST (DF numerator) & 3 \tabularnewline
F-TEST (DF denominator) & 57 \tabularnewline
p-value & 0.00107967 \tabularnewline
Multiple Linear Regression - Residual Statistics \tabularnewline
Residual Standard Deviation & 4.36273 \tabularnewline
Sum Squared Residuals & 1084.9 \tabularnewline
\hline
\end{tabular}
%Source: https://freestatistics.org/blog/index.php?pk=268633&T=3

[TABLE]
[ROW][C]Multiple Linear Regression - Regression Statistics[/C][/ROW]
[ROW][C]Multiple R[/C][C]0.494292[/C][/ROW]
[ROW][C]R-squared[/C][C]0.244324[/C][/ROW]
[ROW][C]Adjusted R-squared[/C][C]0.204552[/C][/ROW]
[ROW][C]F-TEST (value)[/C][C]6.14306[/C][/ROW]
[ROW][C]F-TEST (DF numerator)[/C][C]3[/C][/ROW]
[ROW][C]F-TEST (DF denominator)[/C][C]57[/C][/ROW]
[ROW][C]p-value[/C][C]0.00107967[/C][/ROW]
[ROW][C]Multiple Linear Regression - Residual Statistics[/C][/ROW]
[ROW][C]Residual Standard Deviation[/C][C]4.36273[/C][/ROW]
[ROW][C]Sum Squared Residuals[/C][C]1084.9[/C][/ROW]
[/TABLE]
Source: https://freestatistics.org/blog/index.php?pk=268633&T=3

Globally Unique Identifier (entire table): ba.freestatistics.org/blog/index.php?pk=268633&T=3

As an alternative you can also use a QR Code:  

The GUIDs for individual cells are displayed in the table below:

Multiple Linear Regression - Regression Statistics
Multiple R0.494292
R-squared0.244324
Adjusted R-squared0.204552
F-TEST (value)6.14306
F-TEST (DF numerator)3
F-TEST (DF denominator)57
p-value0.00107967
Multiple Linear Regression - Residual Statistics
Residual Standard Deviation4.36273
Sum Squared Residuals1084.9


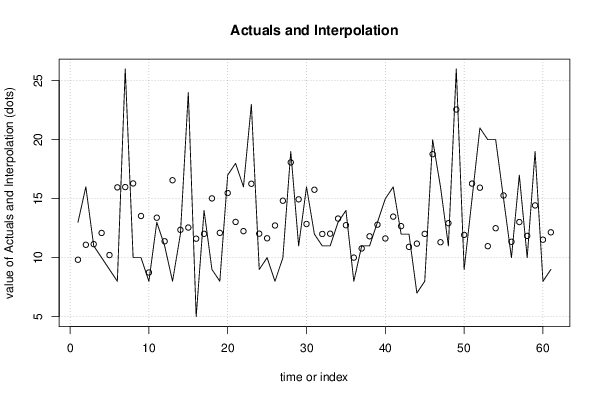
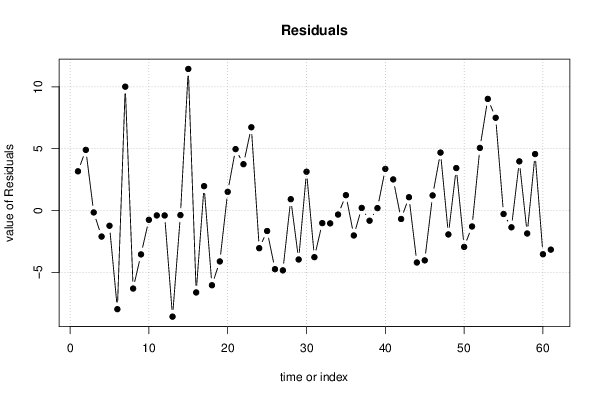
Multiple Linear Regression - Actuals, Interpolation, and Residuals
Time or IndexActualsInterpolationForecastResidualsPrediction Error
1139.824273.17573
21611.09364.90642
31111.1452-0.145233
41012.0961-2.09606
5910.222-1.22197
6815.9615-7.96149
72615.986110.0139
81016.2935-6.29351
91013.5344-3.53435
1088.74305-0.743048
111313.3874-0.387353
121111.3909-0.390903
13816.5642-8.56417
141212.3616-0.361607
152412.554711.4453
16511.6094-6.60942
171412.02241.97764
18915.0264-6.02639
19812.1037-4.10369
201715.48171.51834
211813.03084.96924
221612.24983.7502
232316.26646.73357
24912.0338-3.0338
251011.645-1.64501
26812.7275-4.72753
271014.8265-4.82646
281918.0770.923045
291114.9472-3.94718
301612.85673.14331
311215.7586-3.75863
321112.0092-1.00923
331112.03-1.02999
341313.317-0.317047
351412.75041.24961
36810.006-2.00597
371110.7810.21898
381111.814-0.813989
391312.79610.203875
401511.62983.37023
411613.47842.5216
421212.6742-0.674171
431210.91571.0843
44711.1901-4.19015
45812.0186-4.01855
462018.77071.22932
471611.30964.69042
481112.9228-1.92276
492622.5623.43799
50911.9317-2.93172
511516.28-1.27997
522115.93275.06729
532010.97429.02585
542012.49847.50161
551515.2716-0.271574
561011.3477-1.34769
571713.01973.98025
581011.8462-1.84617
591914.434.56995
60811.5218-3.52177
61912.1494-3.14942

\begin{tabular}{lllllllll}
\hline
Multiple Linear Regression - Actuals, Interpolation, and Residuals \tabularnewline
Time or Index & Actuals & InterpolationForecast & ResidualsPrediction Error \tabularnewline
1 & 13 & 9.82427 & 3.17573 \tabularnewline
2 & 16 & 11.0936 & 4.90642 \tabularnewline
3 & 11 & 11.1452 & -0.145233 \tabularnewline
4 & 10 & 12.0961 & -2.09606 \tabularnewline
5 & 9 & 10.222 & -1.22197 \tabularnewline
6 & 8 & 15.9615 & -7.96149 \tabularnewline
7 & 26 & 15.9861 & 10.0139 \tabularnewline
8 & 10 & 16.2935 & -6.29351 \tabularnewline
9 & 10 & 13.5344 & -3.53435 \tabularnewline
10 & 8 & 8.74305 & -0.743048 \tabularnewline
11 & 13 & 13.3874 & -0.387353 \tabularnewline
12 & 11 & 11.3909 & -0.390903 \tabularnewline
13 & 8 & 16.5642 & -8.56417 \tabularnewline
14 & 12 & 12.3616 & -0.361607 \tabularnewline
15 & 24 & 12.5547 & 11.4453 \tabularnewline
16 & 5 & 11.6094 & -6.60942 \tabularnewline
17 & 14 & 12.0224 & 1.97764 \tabularnewline
18 & 9 & 15.0264 & -6.02639 \tabularnewline
19 & 8 & 12.1037 & -4.10369 \tabularnewline
20 & 17 & 15.4817 & 1.51834 \tabularnewline
21 & 18 & 13.0308 & 4.96924 \tabularnewline
22 & 16 & 12.2498 & 3.7502 \tabularnewline
23 & 23 & 16.2664 & 6.73357 \tabularnewline
24 & 9 & 12.0338 & -3.0338 \tabularnewline
25 & 10 & 11.645 & -1.64501 \tabularnewline
26 & 8 & 12.7275 & -4.72753 \tabularnewline
27 & 10 & 14.8265 & -4.82646 \tabularnewline
28 & 19 & 18.077 & 0.923045 \tabularnewline
29 & 11 & 14.9472 & -3.94718 \tabularnewline
30 & 16 & 12.8567 & 3.14331 \tabularnewline
31 & 12 & 15.7586 & -3.75863 \tabularnewline
32 & 11 & 12.0092 & -1.00923 \tabularnewline
33 & 11 & 12.03 & -1.02999 \tabularnewline
34 & 13 & 13.317 & -0.317047 \tabularnewline
35 & 14 & 12.7504 & 1.24961 \tabularnewline
36 & 8 & 10.006 & -2.00597 \tabularnewline
37 & 11 & 10.781 & 0.21898 \tabularnewline
38 & 11 & 11.814 & -0.813989 \tabularnewline
39 & 13 & 12.7961 & 0.203875 \tabularnewline
40 & 15 & 11.6298 & 3.37023 \tabularnewline
41 & 16 & 13.4784 & 2.5216 \tabularnewline
42 & 12 & 12.6742 & -0.674171 \tabularnewline
43 & 12 & 10.9157 & 1.0843 \tabularnewline
44 & 7 & 11.1901 & -4.19015 \tabularnewline
45 & 8 & 12.0186 & -4.01855 \tabularnewline
46 & 20 & 18.7707 & 1.22932 \tabularnewline
47 & 16 & 11.3096 & 4.69042 \tabularnewline
48 & 11 & 12.9228 & -1.92276 \tabularnewline
49 & 26 & 22.562 & 3.43799 \tabularnewline
50 & 9 & 11.9317 & -2.93172 \tabularnewline
51 & 15 & 16.28 & -1.27997 \tabularnewline
52 & 21 & 15.9327 & 5.06729 \tabularnewline
53 & 20 & 10.9742 & 9.02585 \tabularnewline
54 & 20 & 12.4984 & 7.50161 \tabularnewline
55 & 15 & 15.2716 & -0.271574 \tabularnewline
56 & 10 & 11.3477 & -1.34769 \tabularnewline
57 & 17 & 13.0197 & 3.98025 \tabularnewline
58 & 10 & 11.8462 & -1.84617 \tabularnewline
59 & 19 & 14.43 & 4.56995 \tabularnewline
60 & 8 & 11.5218 & -3.52177 \tabularnewline
61 & 9 & 12.1494 & -3.14942 \tabularnewline
\hline
\end{tabular}
%Source: https://freestatistics.org/blog/index.php?pk=268633&T=4

[TABLE]
[ROW][C]Multiple Linear Regression - Actuals, Interpolation, and Residuals[/C][/ROW]
[ROW][C]Time or Index[/C][C]Actuals[/C][C]InterpolationForecast[/C][C]ResidualsPrediction Error[/C][/ROW]
[ROW][C]1[/C][C]13[/C][C]9.82427[/C][C]3.17573[/C][/ROW]
[ROW][C]2[/C][C]16[/C][C]11.0936[/C][C]4.90642[/C][/ROW]
[ROW][C]3[/C][C]11[/C][C]11.1452[/C][C]-0.145233[/C][/ROW]
[ROW][C]4[/C][C]10[/C][C]12.0961[/C][C]-2.09606[/C][/ROW]
[ROW][C]5[/C][C]9[/C][C]10.222[/C][C]-1.22197[/C][/ROW]
[ROW][C]6[/C][C]8[/C][C]15.9615[/C][C]-7.96149[/C][/ROW]
[ROW][C]7[/C][C]26[/C][C]15.9861[/C][C]10.0139[/C][/ROW]
[ROW][C]8[/C][C]10[/C][C]16.2935[/C][C]-6.29351[/C][/ROW]
[ROW][C]9[/C][C]10[/C][C]13.5344[/C][C]-3.53435[/C][/ROW]
[ROW][C]10[/C][C]8[/C][C]8.74305[/C][C]-0.743048[/C][/ROW]
[ROW][C]11[/C][C]13[/C][C]13.3874[/C][C]-0.387353[/C][/ROW]
[ROW][C]12[/C][C]11[/C][C]11.3909[/C][C]-0.390903[/C][/ROW]
[ROW][C]13[/C][C]8[/C][C]16.5642[/C][C]-8.56417[/C][/ROW]
[ROW][C]14[/C][C]12[/C][C]12.3616[/C][C]-0.361607[/C][/ROW]
[ROW][C]15[/C][C]24[/C][C]12.5547[/C][C]11.4453[/C][/ROW]
[ROW][C]16[/C][C]5[/C][C]11.6094[/C][C]-6.60942[/C][/ROW]
[ROW][C]17[/C][C]14[/C][C]12.0224[/C][C]1.97764[/C][/ROW]
[ROW][C]18[/C][C]9[/C][C]15.0264[/C][C]-6.02639[/C][/ROW]
[ROW][C]19[/C][C]8[/C][C]12.1037[/C][C]-4.10369[/C][/ROW]
[ROW][C]20[/C][C]17[/C][C]15.4817[/C][C]1.51834[/C][/ROW]
[ROW][C]21[/C][C]18[/C][C]13.0308[/C][C]4.96924[/C][/ROW]
[ROW][C]22[/C][C]16[/C][C]12.2498[/C][C]3.7502[/C][/ROW]
[ROW][C]23[/C][C]23[/C][C]16.2664[/C][C]6.73357[/C][/ROW]
[ROW][C]24[/C][C]9[/C][C]12.0338[/C][C]-3.0338[/C][/ROW]
[ROW][C]25[/C][C]10[/C][C]11.645[/C][C]-1.64501[/C][/ROW]
[ROW][C]26[/C][C]8[/C][C]12.7275[/C][C]-4.72753[/C][/ROW]
[ROW][C]27[/C][C]10[/C][C]14.8265[/C][C]-4.82646[/C][/ROW]
[ROW][C]28[/C][C]19[/C][C]18.077[/C][C]0.923045[/C][/ROW]
[ROW][C]29[/C][C]11[/C][C]14.9472[/C][C]-3.94718[/C][/ROW]
[ROW][C]30[/C][C]16[/C][C]12.8567[/C][C]3.14331[/C][/ROW]
[ROW][C]31[/C][C]12[/C][C]15.7586[/C][C]-3.75863[/C][/ROW]
[ROW][C]32[/C][C]11[/C][C]12.0092[/C][C]-1.00923[/C][/ROW]
[ROW][C]33[/C][C]11[/C][C]12.03[/C][C]-1.02999[/C][/ROW]
[ROW][C]34[/C][C]13[/C][C]13.317[/C][C]-0.317047[/C][/ROW]
[ROW][C]35[/C][C]14[/C][C]12.7504[/C][C]1.24961[/C][/ROW]
[ROW][C]36[/C][C]8[/C][C]10.006[/C][C]-2.00597[/C][/ROW]
[ROW][C]37[/C][C]11[/C][C]10.781[/C][C]0.21898[/C][/ROW]
[ROW][C]38[/C][C]11[/C][C]11.814[/C][C]-0.813989[/C][/ROW]
[ROW][C]39[/C][C]13[/C][C]12.7961[/C][C]0.203875[/C][/ROW]
[ROW][C]40[/C][C]15[/C][C]11.6298[/C][C]3.37023[/C][/ROW]
[ROW][C]41[/C][C]16[/C][C]13.4784[/C][C]2.5216[/C][/ROW]
[ROW][C]42[/C][C]12[/C][C]12.6742[/C][C]-0.674171[/C][/ROW]
[ROW][C]43[/C][C]12[/C][C]10.9157[/C][C]1.0843[/C][/ROW]
[ROW][C]44[/C][C]7[/C][C]11.1901[/C][C]-4.19015[/C][/ROW]
[ROW][C]45[/C][C]8[/C][C]12.0186[/C][C]-4.01855[/C][/ROW]
[ROW][C]46[/C][C]20[/C][C]18.7707[/C][C]1.22932[/C][/ROW]
[ROW][C]47[/C][C]16[/C][C]11.3096[/C][C]4.69042[/C][/ROW]
[ROW][C]48[/C][C]11[/C][C]12.9228[/C][C]-1.92276[/C][/ROW]
[ROW][C]49[/C][C]26[/C][C]22.562[/C][C]3.43799[/C][/ROW]
[ROW][C]50[/C][C]9[/C][C]11.9317[/C][C]-2.93172[/C][/ROW]
[ROW][C]51[/C][C]15[/C][C]16.28[/C][C]-1.27997[/C][/ROW]
[ROW][C]52[/C][C]21[/C][C]15.9327[/C][C]5.06729[/C][/ROW]
[ROW][C]53[/C][C]20[/C][C]10.9742[/C][C]9.02585[/C][/ROW]
[ROW][C]54[/C][C]20[/C][C]12.4984[/C][C]7.50161[/C][/ROW]
[ROW][C]55[/C][C]15[/C][C]15.2716[/C][C]-0.271574[/C][/ROW]
[ROW][C]56[/C][C]10[/C][C]11.3477[/C][C]-1.34769[/C][/ROW]
[ROW][C]57[/C][C]17[/C][C]13.0197[/C][C]3.98025[/C][/ROW]
[ROW][C]58[/C][C]10[/C][C]11.8462[/C][C]-1.84617[/C][/ROW]
[ROW][C]59[/C][C]19[/C][C]14.43[/C][C]4.56995[/C][/ROW]
[ROW][C]60[/C][C]8[/C][C]11.5218[/C][C]-3.52177[/C][/ROW]
[ROW][C]61[/C][C]9[/C][C]12.1494[/C][C]-3.14942[/C][/ROW]
[/TABLE]
Source: https://freestatistics.org/blog/index.php?pk=268633&T=4

Globally Unique Identifier (entire table): ba.freestatistics.org/blog/index.php?pk=268633&T=4

As an alternative you can also use a QR Code:  

The GUIDs for individual cells are displayed in the table below:

Multiple Linear Regression - Actuals, Interpolation, and Residuals
Time or IndexActualsInterpolationForecastResidualsPrediction Error
1139.824273.17573
21611.09364.90642
31111.1452-0.145233
41012.0961-2.09606
5910.222-1.22197
6815.9615-7.96149
72615.986110.0139
81016.2935-6.29351
91013.5344-3.53435
1088.74305-0.743048
111313.3874-0.387353
121111.3909-0.390903
13816.5642-8.56417
141212.3616-0.361607
152412.554711.4453
16511.6094-6.60942
171412.02241.97764
18915.0264-6.02639
19812.1037-4.10369
201715.48171.51834
211813.03084.96924
221612.24983.7502
232316.26646.73357
24912.0338-3.0338
251011.645-1.64501
26812.7275-4.72753
271014.8265-4.82646
281918.0770.923045
291114.9472-3.94718
301612.85673.14331
311215.7586-3.75863
321112.0092-1.00923
331112.03-1.02999
341313.317-0.317047
351412.75041.24961
36810.006-2.00597
371110.7810.21898
381111.814-0.813989
391312.79610.203875
401511.62983.37023
411613.47842.5216
421212.6742-0.674171
431210.91571.0843
44711.1901-4.19015
45812.0186-4.01855
462018.77071.22932
471611.30964.69042
481112.9228-1.92276
492622.5623.43799
50911.9317-2.93172
511516.28-1.27997
522115.93275.06729
532010.97429.02585
542012.49847.50161
551515.2716-0.271574
561011.3477-1.34769
571713.01973.98025
581011.8462-1.84617
591914.434.56995
60811.5218-3.52177
61912.1494-3.14942


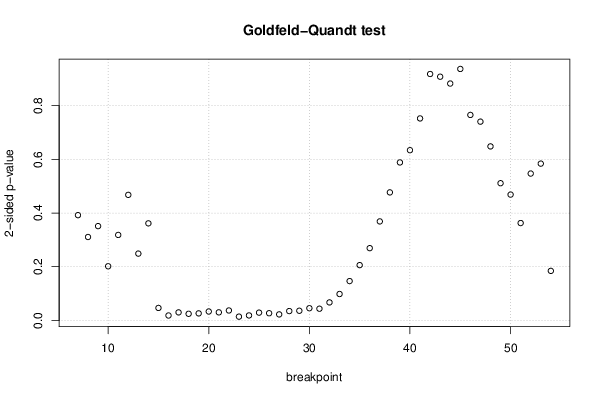
Goldfeld-Quandt test for Heteroskedasticity
p-valuesAlternative Hypothesis
breakpoint indexgreater2-sidedless
70.8039180.3921640.196082
80.8446420.3107160.155358
90.8243240.3513520.175676
100.8991360.2017280.100864
110.8408150.318370.159185
120.7661330.4677350.233867
130.8755680.2488640.124432
140.8191960.3616080.180804
150.9767930.04641420.0232071
160.9908760.0182490.0091245
170.985060.02988030.0149401
180.9877030.02459490.0122975
190.9869530.02609330.0130467
200.983450.03310.01655
210.9850070.02998550.0149927
220.9815360.0369270.0184635
230.993040.01391950.00695975
240.9907680.01846380.0092319
250.9855740.02885110.0144256
260.9866450.02671090.0133555
270.9888350.02232920.0111646
280.9826270.03474520.0173726
290.9820550.03589020.0179451
300.9773050.04539020.0226951
310.9782430.04351440.0217572
320.9665120.06697530.0334877
330.9508550.09829010.049145
340.9268070.1463860.0731929
350.8970250.2059490.102975
360.8654180.2691640.134582
370.8155920.3688160.184408
380.7614930.4770140.238507
390.7057260.5885480.294274
400.6828680.6342630.317132
410.6237240.7525520.376276
420.5409490.9181020.459051
430.4540130.9080270.545987
440.44130.8825990.5587
450.4684720.9369450.531528
460.3828060.7656120.617194
470.3702870.7405740.629713
480.3241910.6483830.675809
490.2555850.5111710.744415
500.2343680.4687360.765632
510.1813310.3626610.818669
520.2736040.5472090.726396
530.7079130.5841750.292087
540.9077630.1844730.0922367

\begin{tabular}{lllllllll}
\hline
Goldfeld-Quandt test for Heteroskedasticity \tabularnewline
p-values & Alternative Hypothesis \tabularnewline
breakpoint index & greater & 2-sided & less \tabularnewline
7 & 0.803918 & 0.392164 & 0.196082 \tabularnewline
8 & 0.844642 & 0.310716 & 0.155358 \tabularnewline
9 & 0.824324 & 0.351352 & 0.175676 \tabularnewline
10 & 0.899136 & 0.201728 & 0.100864 \tabularnewline
11 & 0.840815 & 0.31837 & 0.159185 \tabularnewline
12 & 0.766133 & 0.467735 & 0.233867 \tabularnewline
13 & 0.875568 & 0.248864 & 0.124432 \tabularnewline
14 & 0.819196 & 0.361608 & 0.180804 \tabularnewline
15 & 0.976793 & 0.0464142 & 0.0232071 \tabularnewline
16 & 0.990876 & 0.018249 & 0.0091245 \tabularnewline
17 & 0.98506 & 0.0298803 & 0.0149401 \tabularnewline
18 & 0.987703 & 0.0245949 & 0.0122975 \tabularnewline
19 & 0.986953 & 0.0260933 & 0.0130467 \tabularnewline
20 & 0.98345 & 0.0331 & 0.01655 \tabularnewline
21 & 0.985007 & 0.0299855 & 0.0149927 \tabularnewline
22 & 0.981536 & 0.036927 & 0.0184635 \tabularnewline
23 & 0.99304 & 0.0139195 & 0.00695975 \tabularnewline
24 & 0.990768 & 0.0184638 & 0.0092319 \tabularnewline
25 & 0.985574 & 0.0288511 & 0.0144256 \tabularnewline
26 & 0.986645 & 0.0267109 & 0.0133555 \tabularnewline
27 & 0.988835 & 0.0223292 & 0.0111646 \tabularnewline
28 & 0.982627 & 0.0347452 & 0.0173726 \tabularnewline
29 & 0.982055 & 0.0358902 & 0.0179451 \tabularnewline
30 & 0.977305 & 0.0453902 & 0.0226951 \tabularnewline
31 & 0.978243 & 0.0435144 & 0.0217572 \tabularnewline
32 & 0.966512 & 0.0669753 & 0.0334877 \tabularnewline
33 & 0.950855 & 0.0982901 & 0.049145 \tabularnewline
34 & 0.926807 & 0.146386 & 0.0731929 \tabularnewline
35 & 0.897025 & 0.205949 & 0.102975 \tabularnewline
36 & 0.865418 & 0.269164 & 0.134582 \tabularnewline
37 & 0.815592 & 0.368816 & 0.184408 \tabularnewline
38 & 0.761493 & 0.477014 & 0.238507 \tabularnewline
39 & 0.705726 & 0.588548 & 0.294274 \tabularnewline
40 & 0.682868 & 0.634263 & 0.317132 \tabularnewline
41 & 0.623724 & 0.752552 & 0.376276 \tabularnewline
42 & 0.540949 & 0.918102 & 0.459051 \tabularnewline
43 & 0.454013 & 0.908027 & 0.545987 \tabularnewline
44 & 0.4413 & 0.882599 & 0.5587 \tabularnewline
45 & 0.468472 & 0.936945 & 0.531528 \tabularnewline
46 & 0.382806 & 0.765612 & 0.617194 \tabularnewline
47 & 0.370287 & 0.740574 & 0.629713 \tabularnewline
48 & 0.324191 & 0.648383 & 0.675809 \tabularnewline
49 & 0.255585 & 0.511171 & 0.744415 \tabularnewline
50 & 0.234368 & 0.468736 & 0.765632 \tabularnewline
51 & 0.181331 & 0.362661 & 0.818669 \tabularnewline
52 & 0.273604 & 0.547209 & 0.726396 \tabularnewline
53 & 0.707913 & 0.584175 & 0.292087 \tabularnewline
54 & 0.907763 & 0.184473 & 0.0922367 \tabularnewline
\hline
\end{tabular}
%Source: https://freestatistics.org/blog/index.php?pk=268633&T=5

[TABLE]
[ROW][C]Goldfeld-Quandt test for Heteroskedasticity[/C][/ROW]
[ROW][C]p-values[/C][C]Alternative Hypothesis[/C][/ROW]
[ROW][C]breakpoint index[/C][C]greater[/C][C]2-sided[/C][C]less[/C][/ROW]
[ROW][C]7[/C][C]0.803918[/C][C]0.392164[/C][C]0.196082[/C][/ROW]
[ROW][C]8[/C][C]0.844642[/C][C]0.310716[/C][C]0.155358[/C][/ROW]
[ROW][C]9[/C][C]0.824324[/C][C]0.351352[/C][C]0.175676[/C][/ROW]
[ROW][C]10[/C][C]0.899136[/C][C]0.201728[/C][C]0.100864[/C][/ROW]
[ROW][C]11[/C][C]0.840815[/C][C]0.31837[/C][C]0.159185[/C][/ROW]
[ROW][C]12[/C][C]0.766133[/C][C]0.467735[/C][C]0.233867[/C][/ROW]
[ROW][C]13[/C][C]0.875568[/C][C]0.248864[/C][C]0.124432[/C][/ROW]
[ROW][C]14[/C][C]0.819196[/C][C]0.361608[/C][C]0.180804[/C][/ROW]
[ROW][C]15[/C][C]0.976793[/C][C]0.0464142[/C][C]0.0232071[/C][/ROW]
[ROW][C]16[/C][C]0.990876[/C][C]0.018249[/C][C]0.0091245[/C][/ROW]
[ROW][C]17[/C][C]0.98506[/C][C]0.0298803[/C][C]0.0149401[/C][/ROW]
[ROW][C]18[/C][C]0.987703[/C][C]0.0245949[/C][C]0.0122975[/C][/ROW]
[ROW][C]19[/C][C]0.986953[/C][C]0.0260933[/C][C]0.0130467[/C][/ROW]
[ROW][C]20[/C][C]0.98345[/C][C]0.0331[/C][C]0.01655[/C][/ROW]
[ROW][C]21[/C][C]0.985007[/C][C]0.0299855[/C][C]0.0149927[/C][/ROW]
[ROW][C]22[/C][C]0.981536[/C][C]0.036927[/C][C]0.0184635[/C][/ROW]
[ROW][C]23[/C][C]0.99304[/C][C]0.0139195[/C][C]0.00695975[/C][/ROW]
[ROW][C]24[/C][C]0.990768[/C][C]0.0184638[/C][C]0.0092319[/C][/ROW]
[ROW][C]25[/C][C]0.985574[/C][C]0.0288511[/C][C]0.0144256[/C][/ROW]
[ROW][C]26[/C][C]0.986645[/C][C]0.0267109[/C][C]0.0133555[/C][/ROW]
[ROW][C]27[/C][C]0.988835[/C][C]0.0223292[/C][C]0.0111646[/C][/ROW]
[ROW][C]28[/C][C]0.982627[/C][C]0.0347452[/C][C]0.0173726[/C][/ROW]
[ROW][C]29[/C][C]0.982055[/C][C]0.0358902[/C][C]0.0179451[/C][/ROW]
[ROW][C]30[/C][C]0.977305[/C][C]0.0453902[/C][C]0.0226951[/C][/ROW]
[ROW][C]31[/C][C]0.978243[/C][C]0.0435144[/C][C]0.0217572[/C][/ROW]
[ROW][C]32[/C][C]0.966512[/C][C]0.0669753[/C][C]0.0334877[/C][/ROW]
[ROW][C]33[/C][C]0.950855[/C][C]0.0982901[/C][C]0.049145[/C][/ROW]
[ROW][C]34[/C][C]0.926807[/C][C]0.146386[/C][C]0.0731929[/C][/ROW]
[ROW][C]35[/C][C]0.897025[/C][C]0.205949[/C][C]0.102975[/C][/ROW]
[ROW][C]36[/C][C]0.865418[/C][C]0.269164[/C][C]0.134582[/C][/ROW]
[ROW][C]37[/C][C]0.815592[/C][C]0.368816[/C][C]0.184408[/C][/ROW]
[ROW][C]38[/C][C]0.761493[/C][C]0.477014[/C][C]0.238507[/C][/ROW]
[ROW][C]39[/C][C]0.705726[/C][C]0.588548[/C][C]0.294274[/C][/ROW]
[ROW][C]40[/C][C]0.682868[/C][C]0.634263[/C][C]0.317132[/C][/ROW]
[ROW][C]41[/C][C]0.623724[/C][C]0.752552[/C][C]0.376276[/C][/ROW]
[ROW][C]42[/C][C]0.540949[/C][C]0.918102[/C][C]0.459051[/C][/ROW]
[ROW][C]43[/C][C]0.454013[/C][C]0.908027[/C][C]0.545987[/C][/ROW]
[ROW][C]44[/C][C]0.4413[/C][C]0.882599[/C][C]0.5587[/C][/ROW]
[ROW][C]45[/C][C]0.468472[/C][C]0.936945[/C][C]0.531528[/C][/ROW]
[ROW][C]46[/C][C]0.382806[/C][C]0.765612[/C][C]0.617194[/C][/ROW]
[ROW][C]47[/C][C]0.370287[/C][C]0.740574[/C][C]0.629713[/C][/ROW]
[ROW][C]48[/C][C]0.324191[/C][C]0.648383[/C][C]0.675809[/C][/ROW]
[ROW][C]49[/C][C]0.255585[/C][C]0.511171[/C][C]0.744415[/C][/ROW]
[ROW][C]50[/C][C]0.234368[/C][C]0.468736[/C][C]0.765632[/C][/ROW]
[ROW][C]51[/C][C]0.181331[/C][C]0.362661[/C][C]0.818669[/C][/ROW]
[ROW][C]52[/C][C]0.273604[/C][C]0.547209[/C][C]0.726396[/C][/ROW]
[ROW][C]53[/C][C]0.707913[/C][C]0.584175[/C][C]0.292087[/C][/ROW]
[ROW][C]54[/C][C]0.907763[/C][C]0.184473[/C][C]0.0922367[/C][/ROW]
[/TABLE]
Source: https://freestatistics.org/blog/index.php?pk=268633&T=5

Globally Unique Identifier (entire table): ba.freestatistics.org/blog/index.php?pk=268633&T=5

As an alternative you can also use a QR Code:  

The GUIDs for individual cells are displayed in the table below:

Goldfeld-Quandt test for Heteroskedasticity
p-valuesAlternative Hypothesis
breakpoint indexgreater2-sidedless
70.8039180.3921640.196082
80.8446420.3107160.155358
90.8243240.3513520.175676
100.8991360.2017280.100864
110.8408150.318370.159185
120.7661330.4677350.233867
130.8755680.2488640.124432
140.8191960.3616080.180804
150.9767930.04641420.0232071
160.9908760.0182490.0091245
170.985060.02988030.0149401
180.9877030.02459490.0122975
190.9869530.02609330.0130467
200.983450.03310.01655
210.9850070.02998550.0149927
220.9815360.0369270.0184635
230.993040.01391950.00695975
240.9907680.01846380.0092319
250.9855740.02885110.0144256
260.9866450.02671090.0133555
270.9888350.02232920.0111646
280.9826270.03474520.0173726
290.9820550.03589020.0179451
300.9773050.04539020.0226951
310.9782430.04351440.0217572
320.9665120.06697530.0334877
330.9508550.09829010.049145
340.9268070.1463860.0731929
350.8970250.2059490.102975
360.8654180.2691640.134582
370.8155920.3688160.184408
380.7614930.4770140.238507
390.7057260.5885480.294274
400.6828680.6342630.317132
410.6237240.7525520.376276
420.5409490.9181020.459051
430.4540130.9080270.545987
440.44130.8825990.5587
450.4684720.9369450.531528
460.3828060.7656120.617194
470.3702870.7405740.629713
480.3241910.6483830.675809
490.2555850.5111710.744415
500.2343680.4687360.765632
510.1813310.3626610.818669
520.2736040.5472090.726396
530.7079130.5841750.292087
540.9077630.1844730.0922367


Meta Analysis of Goldfeld-Quandt test for Heteroskedasticity
Description# significant tests% significant testsOK/NOK
1% type I error level00OK
5% type I error level170.354167NOK
10% type I error level190.395833NOK

\begin{tabular}{lllllllll}
\hline
Meta Analysis of Goldfeld-Quandt test for Heteroskedasticity \tabularnewline
Description & # significant tests & % significant tests & OK/NOK \tabularnewline
1% type I error level & 0 & 0 & OK \tabularnewline
5% type I error level & 17 & 0.354167 & NOK \tabularnewline
10% type I error level & 19 & 0.395833 & NOK \tabularnewline
\hline
\end{tabular}
%Source: https://freestatistics.org/blog/index.php?pk=268633&T=6

[TABLE]
[ROW][C]Meta Analysis of Goldfeld-Quandt test for Heteroskedasticity[/C][/ROW]
[ROW][C]Description[/C][C]# significant tests[/C][C]% significant tests[/C][C]OK/NOK[/C][/ROW]
[ROW][C]1% type I error level[/C][C]0[/C][C]0[/C][C]OK[/C][/ROW]
[ROW][C]5% type I error level[/C][C]17[/C][C]0.354167[/C][C]NOK[/C][/ROW]
[ROW][C]10% type I error level[/C][C]19[/C][C]0.395833[/C][C]NOK[/C][/ROW]
[/TABLE]
Source: https://freestatistics.org/blog/index.php?pk=268633&T=6

Globally Unique Identifier (entire table): ba.freestatistics.org/blog/index.php?pk=268633&T=6

As an alternative you can also use a QR Code:  

The GUIDs for individual cells are displayed in the table below:

Meta Analysis of Goldfeld-Quandt test for Heteroskedasticity
Description# significant tests% significant testsOK/NOK
1% type I error level00OK
5% type I error level170.354167NOK
10% type I error level190.395833NOK


Parameters (Session):
par1 = 1 ; par2 = 2 ; par3 = Pearson Chi-Squared ;
Parameters (R input):
par1 = 4 ; par2 = Do not include Seasonal Dummies ; par3 = No Linear Trend ;
R code (references can be found in the software module):
library(lattice)
library(lmtest)
n25 <- 25 #minimum number of obs. for Goldfeld-Quandt test
par1 <- as.numeric(par1)
x <- t(y)
k <- length(x[1,])
n <- length(x[,1])
x1 <- cbind(x[,par1], x[,1:k!=par1])
mycolnames <- c(colnames(x)[par1], colnames(x)[1:k!=par1])
colnames(x1) <- mycolnames #colnames(x)[par1]
x <- x1
if (par3 == 'First Differences'){
x2 <- array(0, dim=c(n-1,k), dimnames=list(1:(n-1), paste('(1-B)',colnames(x),sep='')))
for (i in 1:n-1) {
for (j in 1:k) {
x2[i,j] <- x[i+1,j] - x[i,j]
}
}
x <- x2
}
if (par2 == 'Include Monthly Dummies'){
x2 <- array(0, dim=c(n,11), dimnames=list(1:n, paste('M', seq(1:11), sep ='')))
for (i in 1:11){
x2[seq(i,n,12),i] <- 1
}
x <- cbind(x, x2)
}
if (par2 == 'Include Quarterly Dummies'){
x2 <- array(0, dim=c(n,3), dimnames=list(1:n, paste('Q', seq(1:3), sep ='')))
for (i in 1:3){
x2[seq(i,n,4),i] <- 1
}
x <- cbind(x, x2)
}
k <- length(x[1,])
if (par3 == 'Linear Trend'){
x <- cbind(x, c(1:n))
colnames(x)[k+1] <- 't'
}
x
k <- length(x[1,])
df <- as.data.frame(x)
(mylm <- lm(df))
(mysum <- summary(mylm))
if (n > n25) {
kp3 <- k + 3
nmkm3 <- n - k - 3
gqarr <- array(NA, dim=c(nmkm3-kp3+1,3))
numgqtests <- 0
numsignificant1 <- 0
numsignificant5 <- 0
numsignificant10 <- 0
for (mypoint in kp3:nmkm3) {
j <- 0
numgqtests <- numgqtests + 1
for (myalt in c('greater', 'two.sided', 'less')) {
j <- j + 1
gqarr[mypoint-kp3+1,j] <- gqtest(mylm, point=mypoint, alternative=myalt)$p.value
}
if (gqarr[mypoint-kp3+1,2] < 0.01) numsignificant1 <- numsignificant1 + 1
if (gqarr[mypoint-kp3+1,2] < 0.05) numsignificant5 <- numsignificant5 + 1
if (gqarr[mypoint-kp3+1,2] < 0.10) numsignificant10 <- numsignificant10 + 1
}
gqarr
}
bitmap(file='test0.png')
plot(x[,1], type='l', main='Actuals and Interpolation', ylab='value of Actuals and Interpolation (dots)', xlab='time or index')
points(x[,1]-mysum$resid)
grid()
dev.off()
bitmap(file='test1.png')
plot(mysum$resid, type='b', pch=19, main='Residuals', ylab='value of Residuals', xlab='time or index')
grid()
dev.off()
bitmap(file='test2.png')
hist(mysum$resid, main='Residual Histogram', xlab='values of Residuals')
grid()
dev.off()
bitmap(file='test3.png')
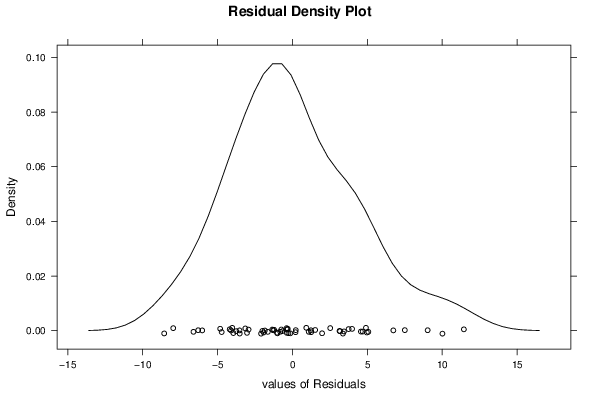
densityplot(~mysum$resid,col='black',main='Residual Density Plot', xlab='values of Residuals')
dev.off()
bitmap(file='test4.png')
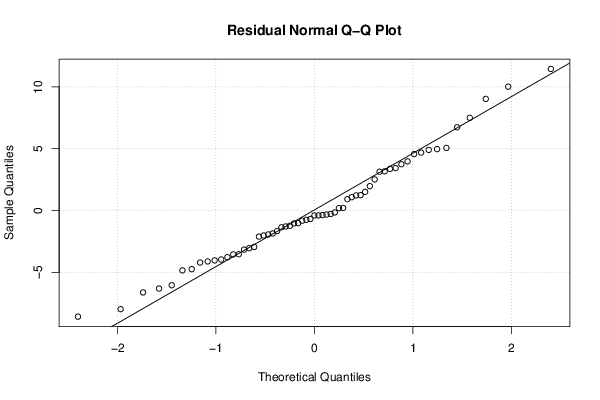
qqnorm(mysum$resid, main='Residual Normal Q-Q Plot')
qqline(mysum$resid)
grid()
dev.off()
(myerror <- as.ts(mysum$resid))
bitmap(file='test5.png')
dum <- cbind(lag(myerror,k=1),myerror)
dum
dum1 <- dum[2:length(myerror),]
dum1
z <- as.data.frame(dum1)
z
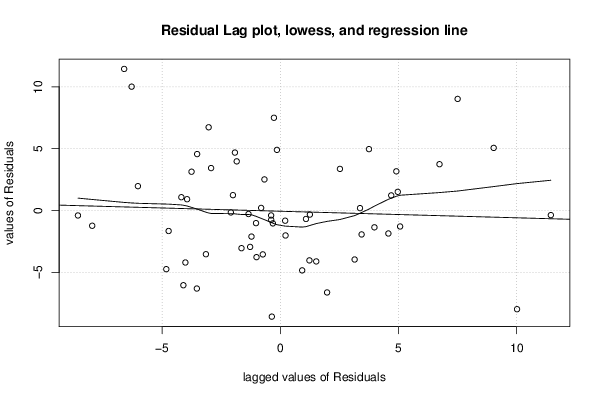
plot(z,main=paste('Residual Lag plot, lowess, and regression line'), ylab='values of Residuals', xlab='lagged values of Residuals')
lines(lowess(z))
abline(lm(z))
grid()
dev.off()
bitmap(file='test6.png')
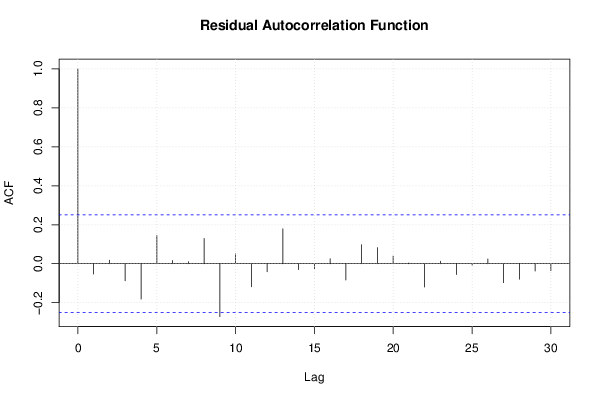
acf(mysum$resid, lag.max=length(mysum$resid)/2, main='Residual Autocorrelation Function')
grid()
dev.off()
bitmap(file='test7.png')
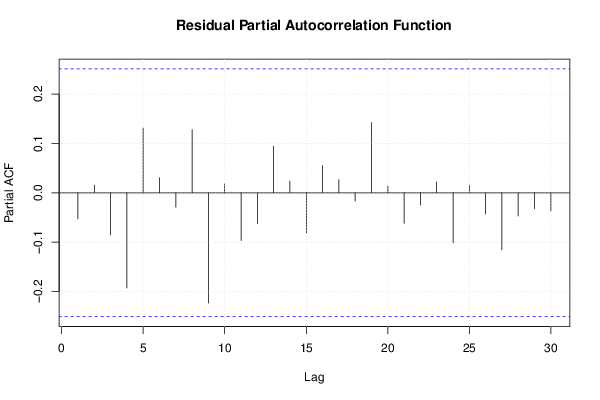
pacf(mysum$resid, lag.max=length(mysum$resid)/2, main='Residual Partial Autocorrelation Function')
grid()
dev.off()
bitmap(file='test8.png')
opar <- par(mfrow = c(2,2), oma = c(0, 0, 1.1, 0))
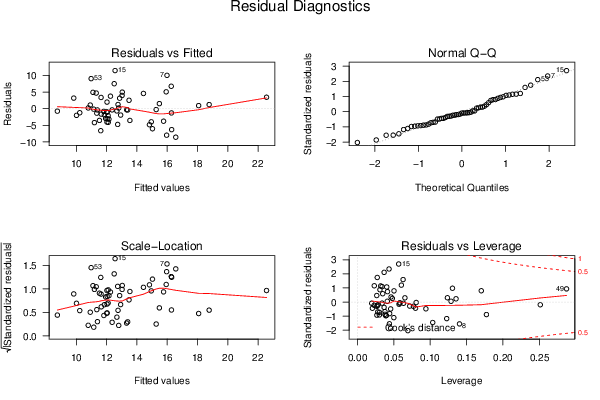
plot(mylm, las = 1, sub='Residual Diagnostics')
par(opar)
dev.off()
if (n > n25) {
bitmap(file='test9.png')
plot(kp3:nmkm3,gqarr[,2], main='Goldfeld-Quandt test',ylab='2-sided p-value',xlab='breakpoint')
grid()
dev.off()
}
load(file='createtable')
a<-table.start()
a<-table.row.start(a)
a<-table.element(a, 'Multiple Linear Regression - Estimated Regression Equation', 1, TRUE)
a<-table.row.end(a)
myeq <- colnames(x)[1]
myeq <- paste(myeq, '[t] = ', sep='')
for (i in 1:k){
if (mysum$coefficients[i,1] > 0) myeq <- paste(myeq, '+', '')
myeq <- paste(myeq, signif(mysum$coefficients[i,1],6), sep=' ')
if (rownames(mysum$coefficients)[i] != '(Intercept)') {
myeq <- paste(myeq, rownames(mysum$coefficients)[i], sep='')
if (rownames(mysum$coefficients)[i] != 't') myeq <- paste(myeq, '[t]', sep='')
}
}
myeq <- paste(myeq, ' + e[t]')
a<-table.row.start(a)
a<-table.element(a, myeq)
a<-table.row.end(a)
a<-table.end(a)
table.save(a,file='mytable1.tab')
a<-table.start()
a<-table.row.start(a)
a<-table.element(a,hyperlink('ols1.htm','Multiple Linear Regression - Ordinary Least Squares',''), 6, TRUE)
a<-table.row.end(a)
a<-table.row.start(a)
a<-table.element(a,'Variable',header=TRUE)
a<-table.element(a,'Parameter',header=TRUE)
a<-table.element(a,'S.D.',header=TRUE)
a<-table.element(a,'T-STAT
H0: parameter = 0',header=TRUE)
a<-table.element(a,'2-tail p-value',header=TRUE)
a<-table.element(a,'1-tail p-value',header=TRUE)
a<-table.row.end(a)
for (i in 1:k){
a<-table.row.start(a)
a<-table.element(a,rownames(mysum$coefficients)[i],header=TRUE)
a<-table.element(a,signif(mysum$coefficients[i,1],6))
a<-table.element(a, signif(mysum$coefficients[i,2],6))
a<-table.element(a, signif(mysum$coefficients[i,3],4))
a<-table.element(a, signif(mysum$coefficients[i,4],6))
a<-table.element(a, signif(mysum$coefficients[i,4]/2,6))
a<-table.row.end(a)
}
a<-table.end(a)
table.save(a,file='mytable2.tab')
a<-table.start()
a<-table.row.start(a)
a<-table.element(a, 'Multiple Linear Regression - Regression Statistics', 2, TRUE)
a<-table.row.end(a)
a<-table.row.start(a)
a<-table.element(a, 'Multiple R',1,TRUE)
a<-table.element(a, signif(sqrt(mysum$r.squared),6))
a<-table.row.end(a)
a<-table.row.start(a)
a<-table.element(a, 'R-squared',1,TRUE)
a<-table.element(a, signif(mysum$r.squared,6))
a<-table.row.end(a)
a<-table.row.start(a)
a<-table.element(a, 'Adjusted R-squared',1,TRUE)
a<-table.element(a, signif(mysum$adj.r.squared,6))
a<-table.row.end(a)
a<-table.row.start(a)
a<-table.element(a, 'F-TEST (value)',1,TRUE)
a<-table.element(a, signif(mysum$fstatistic[1],6))
a<-table.row.end(a)
a<-table.row.start(a)
a<-table.element(a, 'F-TEST (DF numerator)',1,TRUE)
a<-table.element(a, signif(mysum$fstatistic[2],6))
a<-table.row.end(a)
a<-table.row.start(a)
a<-table.element(a, 'F-TEST (DF denominator)',1,TRUE)
a<-table.element(a, signif(mysum$fstatistic[3],6))
a<-table.row.end(a)
a<-table.row.start(a)
a<-table.element(a, 'p-value',1,TRUE)
a<-table.element(a, signif(1-pf(mysum$fstatistic[1],mysum$fstatistic[2],mysum$fstatistic[3]),6))
a<-table.row.end(a)
a<-table.row.start(a)
a<-table.element(a, 'Multiple Linear Regression - Residual Statistics', 2, TRUE)
a<-table.row.end(a)
a<-table.row.start(a)
a<-table.element(a, 'Residual Standard Deviation',1,TRUE)
a<-table.element(a, signif(mysum$sigma,6))
a<-table.row.end(a)
a<-table.row.start(a)
a<-table.element(a, 'Sum Squared Residuals',1,TRUE)
a<-table.element(a, signif(sum(myerror*myerror),6))
a<-table.row.end(a)
a<-table.end(a)
table.save(a,file='mytable3.tab')
a<-table.start()
a<-table.row.start(a)
a<-table.element(a, 'Multiple Linear Regression - Actuals, Interpolation, and Residuals', 4, TRUE)
a<-table.row.end(a)
a<-table.row.start(a)
a<-table.element(a, 'Time or Index', 1, TRUE)
a<-table.element(a, 'Actuals', 1, TRUE)
a<-table.element(a, 'Interpolation
Forecast', 1, TRUE)
a<-table.element(a, 'Residuals
Prediction Error', 1, TRUE)
a<-table.row.end(a)
for (i in 1:n) {
a<-table.row.start(a)
a<-table.element(a,i, 1, TRUE)
a<-table.element(a,signif(x[i],6))
a<-table.element(a,signif(x[i]-mysum$resid[i],6))
a<-table.element(a,signif(mysum$resid[i],6))
a<-table.row.end(a)
}
a<-table.end(a)
table.save(a,file='mytable4.tab')
if (n > n25) {
a<-table.start()
a<-table.row.start(a)
a<-table.element(a,'Goldfeld-Quandt test for Heteroskedasticity',4,TRUE)
a<-table.row.end(a)
a<-table.row.start(a)
a<-table.element(a,'p-values',header=TRUE)
a<-table.element(a,'Alternative Hypothesis',3,header=TRUE)
a<-table.row.end(a)
a<-table.row.start(a)
a<-table.element(a,'breakpoint index',header=TRUE)
a<-table.element(a,'greater',header=TRUE)
a<-table.element(a,'2-sided',header=TRUE)
a<-table.element(a,'less',header=TRUE)
a<-table.row.end(a)
for (mypoint in kp3:nmkm3) {
a<-table.row.start(a)
a<-table.element(a,mypoint,header=TRUE)
a<-table.element(a,signif(gqarr[mypoint-kp3+1,1],6))
a<-table.element(a,signif(gqarr[mypoint-kp3+1,2],6))
a<-table.element(a,signif(gqarr[mypoint-kp3+1,3],6))
a<-table.row.end(a)
}
a<-table.end(a)
table.save(a,file='mytable5.tab')
a<-table.start()
a<-table.row.start(a)
a<-table.element(a,'Meta Analysis of Goldfeld-Quandt test for Heteroskedasticity',4,TRUE)
a<-table.row.end(a)
a<-table.row.start(a)
a<-table.element(a,'Description',header=TRUE)
a<-table.element(a,'# significant tests',header=TRUE)
a<-table.element(a,'% significant tests',header=TRUE)
a<-table.element(a,'OK/NOK',header=TRUE)
a<-table.row.end(a)
a<-table.row.start(a)
a<-table.element(a,'1% type I error level',header=TRUE)
a<-table.element(a,signif(numsignificant1,6))
a<-table.element(a,signif(numsignificant1/numgqtests,6))
if (numsignificant1/numgqtests < 0.01) dum <- 'OK' else dum <- 'NOK'
a<-table.element(a,dum)
a<-table.row.end(a)
a<-table.row.start(a)
a<-table.element(a,'5% type I error level',header=TRUE)
a<-table.element(a,signif(numsignificant5,6))
a<-table.element(a,signif(numsignificant5/numgqtests,6))
if (numsignificant5/numgqtests < 0.05) dum <- 'OK' else dum <- 'NOK'
a<-table.element(a,dum)
a<-table.row.end(a)
a<-table.row.start(a)
a<-table.element(a,'10% type I error level',header=TRUE)
a<-table.element(a,signif(numsignificant10,6))
a<-table.element(a,signif(numsignificant10/numgqtests,6))
if (numsignificant10/numgqtests < 0.1) dum <- 'OK' else dum <- 'NOK'
a<-table.element(a,dum)
a<-table.row.end(a)
a<-table.end(a)
table.save(a,file='mytable6.tab')
}