Free Statistics

of Irreproducible Research!

Author's title

Author*The author of this computation has been verified*
R Software Modulerwasp_meanversusmedian.wasp
Title produced by softwareMean versus Median
Date of computationTue, 16 Dec 2014 08:22:09 +0000
Cite this page as followsStatistical Computations at FreeStatistics.org, Office for Research Development and Education, URL https://freestatistics.org/blog/index.php?v=date/2014/Dec/16/t1418718173cb2vlogzyaciiy7.htm/, Retrieved Thu, 16 May 2024 11:09:20 +0000
Statistical Computations at FreeStatistics.org, Office for Research Development and Education, URL https://freestatistics.org/blog/index.php?pk=269162, Retrieved Thu, 16 May 2024 11:09:20 +0000
QR Codes:

Original text written by user:
IsPrivate?No (this computation is public)
User-defined keywords
Estimated Impact84
Family? (F = Feedback message, R = changed R code, M = changed R Module, P = changed Parameters, D = changed Data)
-       [Mean versus Median] [] [2014-12-16 08:22:09] [c7f962214140f976f2c4b1bb2571d9df] [Current]
Feedback Forum

Post a new message
Dataseries X:
1146
278
108
78
42
35
43
45
27
47
26
29
53
24
43
54
66
94
120
156
180
182
222
170
194
210
226
202
213
251
258
274
253
290
281
313
323
374
397
451
510
555
577
685
743
810
930
1075
1125
1239
1372
1549
1658
1920
2015
2276
2260
2637
2655
2950
3120
3290
3469
3635
3835
4157
4315
4351
4244
4309
4266
4492
4973
5747
6354
6541
7035
7684
8338
9352
10097
11189
11542
12090
12313
12717
13240
13270
13161
12810
11963
10756
9163
6601
4552
3368
3035
2686
2261
1699
1186
795
527
319
178
232


Summary of computational transaction
Raw Inputview raw input (R code)
Raw Outputview raw output of R engine
Computing time1 seconds
R Server'Sir Ronald Aylmer Fisher' @ fisher.wessa.net

\begin{tabular}{lllllllll}
\hline
Summary of computational transaction \tabularnewline
Raw Input & view raw input (R code)  \tabularnewline
Raw Output & view raw output of R engine  \tabularnewline
Computing time & 1 seconds \tabularnewline
R Server & 'Sir Ronald Aylmer Fisher' @ fisher.wessa.net \tabularnewline
\hline
\end{tabular}
%Source: https://freestatistics.org/blog/index.php?pk=269162&T=0

[TABLE]
[ROW][C]Summary of computational transaction[/C][/ROW]
[ROW][C]Raw Input[/C][C]view raw input (R code) [/C][/ROW]
[ROW][C]Raw Output[/C][C]view raw output of R engine [/C][/ROW]
[ROW][C]Computing time[/C][C]1 seconds[/C][/ROW]
[ROW][C]R Server[/C][C]'Sir Ronald Aylmer Fisher' @ fisher.wessa.net[/C][/ROW]
[/TABLE]
Source: https://freestatistics.org/blog/index.php?pk=269162&T=0

Globally Unique Identifier (entire table): ba.freestatistics.org/blog/index.php?pk=269162&T=0

As an alternative you can also use a QR Code:  

The GUIDs for individual cells are displayed in the table below:

Summary of computational transaction
Raw Inputview raw input (R code)
Raw Outputview raw output of R engine
Computing time1 seconds
R Server'Sir Ronald Aylmer Fisher' @ fisher.wessa.net


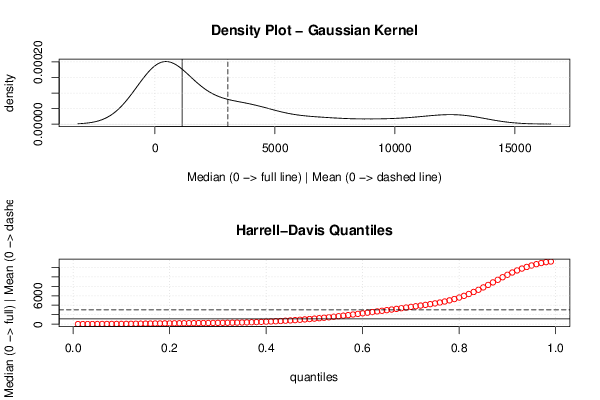
Median versus Mean
mean3043.16981132075
median1135.5

\begin{tabular}{lllllllll}
\hline
Median versus Mean \tabularnewline
mean & 3043.16981132075 \tabularnewline
median & 1135.5 \tabularnewline
\hline
\end{tabular}
%Source: https://freestatistics.org/blog/index.php?pk=269162&T=1

[TABLE]
[ROW][C]Median versus Mean[/C][/ROW]
[ROW][C]mean[/C][C]3043.16981132075[/C][/ROW]
[ROW][C]median[/C][C]1135.5[/C][/ROW]
[/TABLE]
Source: https://freestatistics.org/blog/index.php?pk=269162&T=1

Globally Unique Identifier (entire table): ba.freestatistics.org/blog/index.php?pk=269162&T=1

As an alternative you can also use a QR Code:  

The GUIDs for individual cells are displayed in the table below:

Median versus Mean
mean3043.16981132075
median1135.5


Parameters (Session):
Parameters (R input):
R code (references can be found in the software module):
library(Hmisc)
m <- mean(x)
e <- median(x)
bitmap(file='test1.png')
op <- par(mfrow=c(2,1))
mydensity1 <- density(x,kernel='gaussian',na.rm=TRUE)
plot(mydensity1,main='Density Plot - Gaussian Kernel',xlab='Median (0 -> full line) | Mean (0 -> dashed line)',ylab='density')
abline(v=e,lty=1)
abline(v=m,lty=5)
grid()
myseq <- seq(0.01, 0.99, 0.01)
hd <- hdquantile(x, probs = myseq, se = TRUE, na.rm = FALSE, names = TRUE, weights=FALSE)
plot(myseq,hd,col=2,main='Harrell-Davis Quantiles',xlab='quantiles',ylab='Median (0 -> full) | Mean (0 -> dashed)')
abline(h=m,lty=5)
abline(h=e,lty=1)
grid()
par(op)
dev.off()
load(file='createtable')
a<-table.start()
a<-table.row.start(a)
a<-table.element(a,'Median versus Mean',2,TRUE)
a<-table.row.end(a)
a<-table.row.start(a)
a<-table.element(a,'mean',header=TRUE)
a<-table.element(a,mean(x))
a<-table.row.end(a)
a<-table.row.start(a)
a<-table.element(a,'median',header=TRUE)
a<-table.element(a,median(x))
a<-table.row.end(a)
a<-table.end(a)
table.save(a,file='mytable.tab')