Free Statistics

of Irreproducible Research!

Author's title

Author*The author of this computation has been verified*
R Software Modulerwasp_bootstrapplot1.wasp
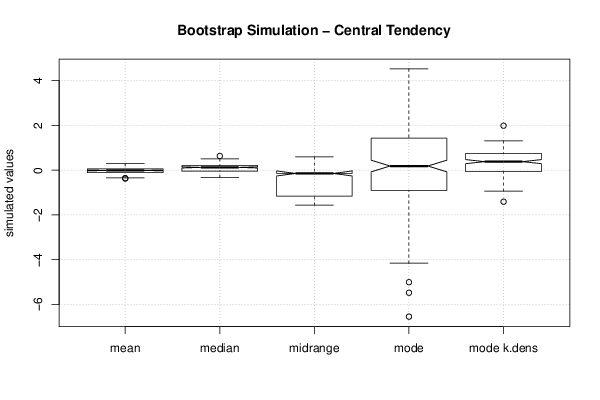
Title produced by softwareBootstrap Plot - Central Tendency
Date of computationTue, 16 Dec 2014 12:54:33 +0000
Cite this page as followsStatistical Computations at FreeStatistics.org, Office for Research Development and Education, URL https://freestatistics.org/blog/index.php?v=date/2014/Dec/16/t1418734526quf5x4zm8hv5eua.htm/, Retrieved Thu, 16 May 2024 12:59:34 +0000
Statistical Computations at FreeStatistics.org, Office for Research Development and Education, URL https://freestatistics.org/blog/index.php?pk=269444, Retrieved Thu, 16 May 2024 12:59:34 +0000
QR Codes:

Original text written by user:
IsPrivate?No (this computation is public)
User-defined keywords
Estimated Impact87
Family? (F = Feedback message, R = changed R code, M = changed R Module, P = changed Parameters, D = changed Data)
-     [Bootstrap Plot - Central Tendency] [] [2014-11-04 10:49:59] [32b17a345b130fdf5cc88718ed94a974]
- RM    [Bootstrap Plot - Central Tendency] [] [2014-11-12 16:28:30] [d253a55552bf9917a397def3be261e30]
- RM D      [Bootstrap Plot - Central Tendency] [] [2014-12-16 12:54:33] [08b6b59c0a3564dc58beca6de73ddb7e] [Current]
Feedback Forum

Post a new message
Dataseries X:
-0.1469710
1.5830900
1.1670700
-4.1542100
-3.7058700
-0.8197810
2.7022700
2.8222700
-0.5724150
-3.7332500
-0.3418470
-5.1926000
1.6722200
-1.3865000
-0.4632600
2.1134200
-0.4479020
-0.9676930
-2.0132900
0.3849600
-3.6080100
3.7368400
-3.2616900
0.8116330
0.6384840
-4.0311100
2.7155400
3.1635700
-1.6710700
0.2833540
-1.0897400
0.4738540
-0.8935220
-1.8771500
1.7121500
1.5672600
-0.5388800
2.5802200
-2.4884900
-0.4564840
-3.9000300
0.3420700
1.0181800
-1.0526600
3.8396300
-1.6848600
2.1434400
-1.7609500
3.1536600
3.2513800
1.0282500
-0.5454290
0.1558760
0.5265740
3.2740200
0.4295650
-5.4763300
4.6372000
0.6179470
2.5905900
-3.4968800
1.3590300
-1.2293700
2.1549500
-3.2260500
0.7991860
-1.7377600
-2.2213200
2.6513800
1.2927500
-0.7667860
1.1405900
-0.9239030
3.6508600
1.5705200
0.7432940
2.0903300
0.8736610
0.6997810
-2.1424200
-0.0564500
2.9576500
0.4061010
-4.9760300
-1.0373500
0.7185350
2.2364600
2.5745700
-1.3133700
1.6882300
3.7939400
-4.4406000
-1.9757300
-0.9033150
-1.8871000
-1.6367100
-3.5937100
2.3435300
3.8914400
-2.2893800
1.9492300
0.1405680
-0.6146320
-1.3659300
4.1839900
-1.6423300
3.9381200
-5.0062700
-1.7332300
-1.1485000
0.8380950
1.8237700
-6.6155000
0.2276780
3.0523900
2.4406900
-1.6472200
0.9701100
-1.3244600
1.8048300
-2.5559300
1.6267100
1.9313200
4.5256500
-2.7540500
-0.4804740
1.4061500
-0.2756620
2.5260800
1.1110800
1.2483700
-1.0963200
1.0957500
1.0850800
0.0563077
-0.1159690
3.1408300
-1.7419100
1.8563600
1.0768300
-0.5458270
2.7614800
0.4947900
3.3641600
0.1214970
0.7767980
-0.3227130
-0.0719316
-0.2103140
2.3042200
-5.8960900
0.8181080
2.5417400
-0.3146130
1.5533800
-0.7409780
1.5798100
1.1969700
-2.1789200
-2.4070000
1.2903500
1.8511800
-0.5306850
6.6602100
0.9914080
-0.1450720
1.6281500
1.5537200
-0.1446750
-3.1103400
1.3088700
2.3668800
-2.0577100
-0.2213930
-0.1757570
2.5137900
-1.2575300
2.6128100
-1.4059600
-3.5367600
-2.5848100
-2.1487300
2.7492600
-0.1950720
-2.6255200
0.2873740
2.6797300
-2.1973800
-2.0484600
-0.1215270
-2.7371400
1.0124900
-3.2653500
3.3494400
-0.7180680
1.0222300
-1.8208800
0.1970850
1.2141800
0.7057170
1.1938900
0.3947220
-1.5562500
-0.0717165
-0.4103590
1.2766700
-1.1808000
0.2021960
2.6887400
1.8403200
-1.1711700
0.3766960
-2.3948600
-0.2509800
-0.5062930
-0.5092980
1.2829100
2.1316800
-1.7587300
-0.6947030
2.7661900
-4.1193700
-1.0987100
2.4093000
2.7069400
2.8698600
2.5714600
2.0366000
3.0401800
3.2789600
3.4920100
2.2265500
-0.2899450
-2.5261100
-2.4016900
-6.5449600
-0.1244550
-0.8042300
-0.9033990
-0.7200880
-1.2209800
-1.8470700
0.5569150
1.6330400
-2.4651300
-0.6356530
-0.0078678
0.7908300
0.6171880
-0.4723630
-2.2497300
-1.6900600
0.1259800
0.7694810
-2.2567900
0.5756260
-4.7251900
-4.9830700
-2.5430300
-6.9501400
-0.7725480
-2.2965600
-3.3030500
1.0090100
1.6942000
0.0183332
-0.2810740
1.4381500
1.5892100
-1.5850500
0.6527800
-0.8622290
0.8329680
1.5124600
0.1711500
-0.1293030
0.8857890
-2.6893000


Summary of computational transaction
Raw Inputview raw input (R code)
Raw Outputview raw output of R engine
Computing time6 seconds
R Server'Sir Ronald Aylmer Fisher' @ fisher.wessa.net

\begin{tabular}{lllllllll}
\hline
Summary of computational transaction \tabularnewline
Raw Input & view raw input (R code)  \tabularnewline
Raw Output & view raw output of R engine  \tabularnewline
Computing time & 6 seconds \tabularnewline
R Server & 'Sir Ronald Aylmer Fisher' @ fisher.wessa.net \tabularnewline
\hline
\end{tabular}
%Source: https://freestatistics.org/blog/index.php?pk=269444&T=0

[TABLE]
[ROW][C]Summary of computational transaction[/C][/ROW]
[ROW][C]Raw Input[/C][C]view raw input (R code) [/C][/ROW]
[ROW][C]Raw Output[/C][C]view raw output of R engine [/C][/ROW]
[ROW][C]Computing time[/C][C]6 seconds[/C][/ROW]
[ROW][C]R Server[/C][C]'Sir Ronald Aylmer Fisher' @ fisher.wessa.net[/C][/ROW]
[/TABLE]
Source: https://freestatistics.org/blog/index.php?pk=269444&T=0

Globally Unique Identifier (entire table): ba.freestatistics.org/blog/index.php?pk=269444&T=0

As an alternative you can also use a QR Code:  

The GUIDs for individual cells are displayed in the table below:

Summary of computational transaction
Raw Inputview raw input (R code)
Raw Outputview raw output of R engine
Computing time6 seconds
R Server'Sir Ronald Aylmer Fisher' @ fisher.wessa.net


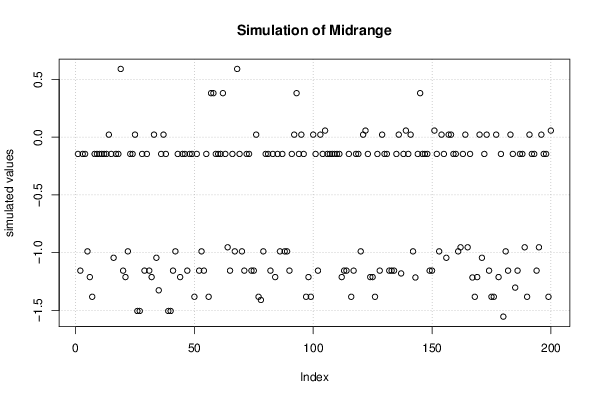
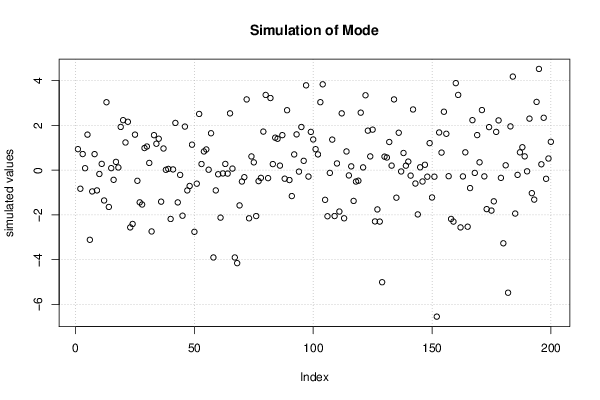
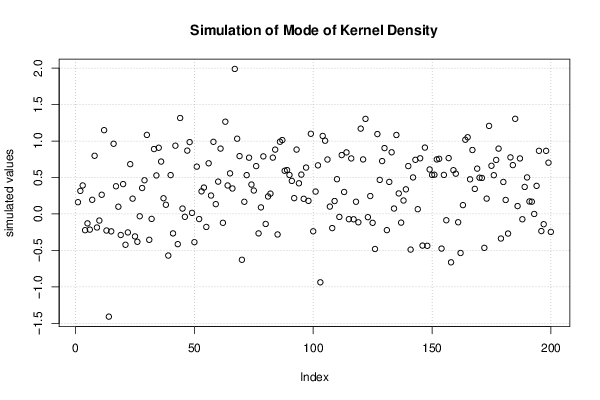
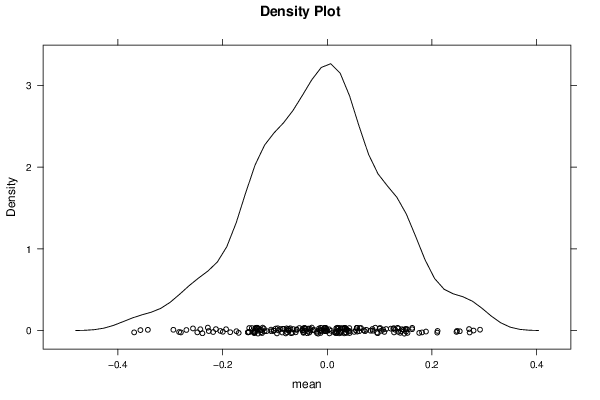
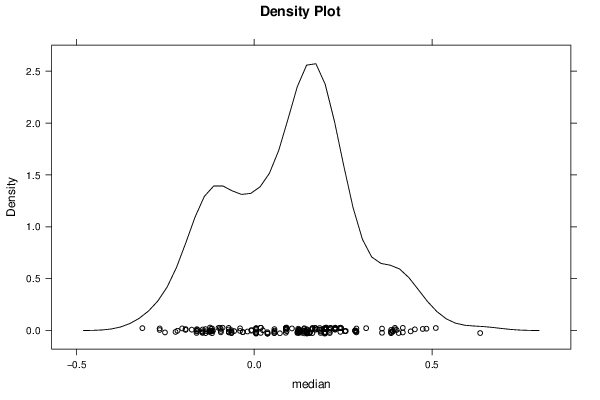
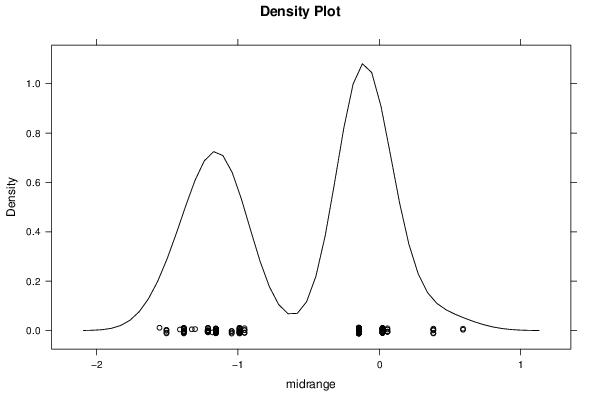
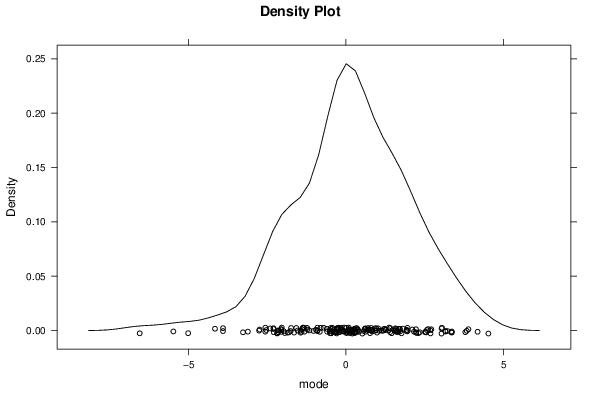
Estimation Results of Bootstrap
statisticP1P5Q1EstimateQ3P95P99S.D.IQR
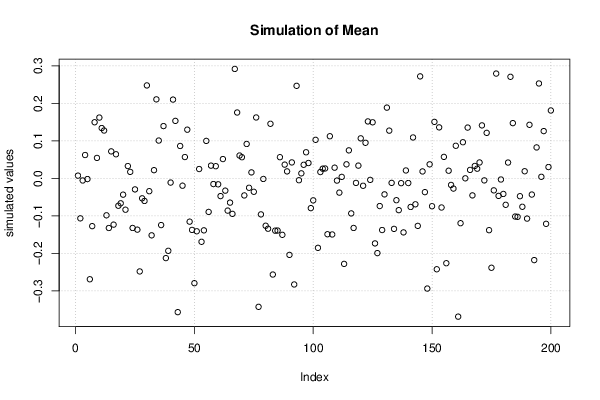
mean-0.34277-0.23863-0.102041.7986e-070.0581490.181380.272090.127930.16019
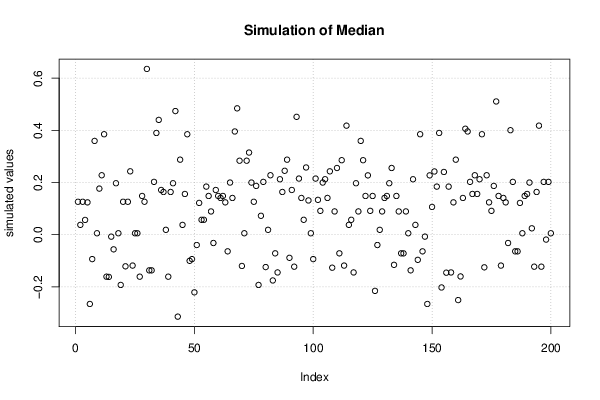
median-0.26603-0.16287-0.03990.123740.20220.395770.484590.177160.2421
midrange-1.506-1.3831-1.1565-0.14497-0.144970.0576250.384160.575131.0115
mode-5.011-2.565-0.90341.7986e-071.41833.16363.89441.83922.3217
mode k.dens-0.66568-0.43777-0.0678210.277010.748171.08491.30520.507480.81599

\begin{tabular}{lllllllll}
\hline
Estimation Results of Bootstrap \tabularnewline
statistic & P1 & P5 & Q1 & Estimate & Q3 & P95 & P99 & S.D. & IQR \tabularnewline
mean & -0.34277 & -0.23863 & -0.10204 & 1.7986e-07 & 0.058149 & 0.18138 & 0.27209 & 0.12793 & 0.16019 \tabularnewline
median & -0.26603 & -0.16287 & -0.0399 & 0.12374 & 0.2022 & 0.39577 & 0.48459 & 0.17716 & 0.2421 \tabularnewline
midrange & -1.506 & -1.3831 & -1.1565 & -0.14497 & -0.14497 & 0.057625 & 0.38416 & 0.57513 & 1.0115 \tabularnewline
mode & -5.011 & -2.565 & -0.9034 & 1.7986e-07 & 1.4183 & 3.1636 & 3.8944 & 1.8392 & 2.3217 \tabularnewline
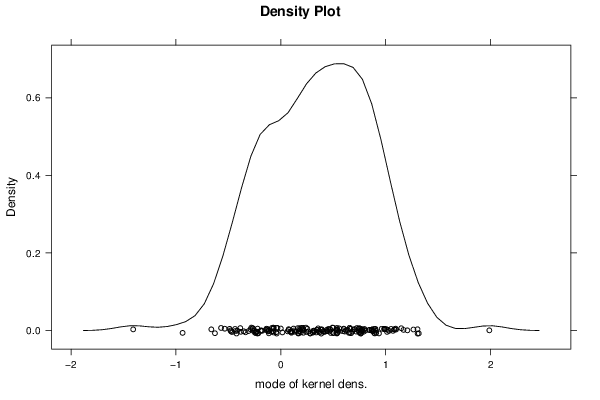
mode k.dens & -0.66568 & -0.43777 & -0.067821 & 0.27701 & 0.74817 & 1.0849 & 1.3052 & 0.50748 & 0.81599 \tabularnewline
\hline
\end{tabular}
%Source: https://freestatistics.org/blog/index.php?pk=269444&T=1

[TABLE]
[ROW][C]Estimation Results of Bootstrap[/C][/ROW]
[ROW][C]statistic[/C][C]P1[/C][C]P5[/C][C]Q1[/C][C]Estimate[/C][C]Q3[/C][C]P95[/C][C]P99[/C][C]S.D.[/C][C]IQR[/C][/ROW]
[ROW][C]mean[/C][C]-0.34277[/C][C]-0.23863[/C][C]-0.10204[/C][C]1.7986e-07[/C][C]0.058149[/C][C]0.18138[/C][C]0.27209[/C][C]0.12793[/C][C]0.16019[/C][/ROW]
[ROW][C]median[/C][C]-0.26603[/C][C]-0.16287[/C][C]-0.0399[/C][C]0.12374[/C][C]0.2022[/C][C]0.39577[/C][C]0.48459[/C][C]0.17716[/C][C]0.2421[/C][/ROW]
[ROW][C]midrange[/C][C]-1.506[/C][C]-1.3831[/C][C]-1.1565[/C][C]-0.14497[/C][C]-0.14497[/C][C]0.057625[/C][C]0.38416[/C][C]0.57513[/C][C]1.0115[/C][/ROW]
[ROW][C]mode[/C][C]-5.011[/C][C]-2.565[/C][C]-0.9034[/C][C]1.7986e-07[/C][C]1.4183[/C][C]3.1636[/C][C]3.8944[/C][C]1.8392[/C][C]2.3217[/C][/ROW]
[ROW][C]mode k.dens[/C][C]-0.66568[/C][C]-0.43777[/C][C]-0.067821[/C][C]0.27701[/C][C]0.74817[/C][C]1.0849[/C][C]1.3052[/C][C]0.50748[/C][C]0.81599[/C][/ROW]
[/TABLE]
Source: https://freestatistics.org/blog/index.php?pk=269444&T=1

Globally Unique Identifier (entire table): ba.freestatistics.org/blog/index.php?pk=269444&T=1

As an alternative you can also use a QR Code:  

The GUIDs for individual cells are displayed in the table below:

Estimation Results of Bootstrap
statisticP1P5Q1EstimateQ3P95P99S.D.IQR
mean-0.34277-0.23863-0.102041.7986e-070.0581490.181380.272090.127930.16019
median-0.26603-0.16287-0.03990.123740.20220.395770.484590.177160.2421
midrange-1.506-1.3831-1.1565-0.14497-0.144970.0576250.384160.575131.0115
mode-5.011-2.565-0.90341.7986e-071.41833.16363.89441.83922.3217
mode k.dens-0.66568-0.43777-0.0678210.277010.748171.08491.30520.507480.81599


Parameters (Session):
par1 = 200 ; par2 = 5 ; par3 = 0 ; par4 = P1 P5 Q1 Q3 P95 P99 ;
Parameters (R input):
par1 = 200 ; par2 = 5 ; par3 = 0 ; par4 = P1 P5 Q1 Q3 P95 P99 ;
R code (references can be found in the software module):
par4 <- 'P1 P5 Q1 Q3 P95 P99'
par3 <- '0'
par2 <- '5'
par1 <- '1000'
par1 <- as.numeric(par1)
par2 <- as.numeric(par2)
if (par3 == '0') bw <- NULL
if (par3 != '0') bw <- as.numeric(par3)
if (par1 < 10) par1 = 10
if (par1 > 5000) par1 = 5000
library(modeest)
library(lattice)
library(boot)
boot.stat <- function(s,i)
{
s.mean <- mean(s[i])
s.median <- median(s[i])
s.midrange <- (max(s[i]) + min(s[i])) / 2
s.mode <- mlv(s[i], method='mfv')$M
s.kernelmode <- mlv(s[i], method='kernel', bw=bw)$M
c(s.mean, s.median, s.midrange, s.mode, s.kernelmode)
}
(r <- boot(x,boot.stat, R=par1, stype='i'))
bitmap(file='plot1.png')
plot(r$t[,1],type='p',ylab='simulated values',main='Simulation of Mean')
grid()
dev.off()
bitmap(file='plot2.png')
plot(r$t[,2],type='p',ylab='simulated values',main='Simulation of Median')
grid()
dev.off()
bitmap(file='plot3.png')
plot(r$t[,3],type='p',ylab='simulated values',main='Simulation of Midrange')
grid()
dev.off()
bitmap(file='plot7.png')
plot(r$t[,4],type='p',ylab='simulated values',main='Simulation of Mode')
grid()
dev.off()
bitmap(file='plot8.png')
plot(r$t[,5],type='p',ylab='simulated values',main='Simulation of Mode of Kernel Density')
grid()
dev.off()
bitmap(file='plot4.png')
densityplot(~r$t[,1],col='black',main='Density Plot',xlab='mean')
dev.off()
bitmap(file='plot5.png')
densityplot(~r$t[,2],col='black',main='Density Plot',xlab='median')
dev.off()
bitmap(file='plot6.png')
densityplot(~r$t[,3],col='black',main='Density Plot',xlab='midrange')
dev.off()
bitmap(file='plot9.png')
densityplot(~r$t[,4],col='black',main='Density Plot',xlab='mode')
dev.off()
bitmap(file='plot10.png')
densityplot(~r$t[,5],col='black',main='Density Plot',xlab='mode of kernel dens.')
dev.off()
z <- data.frame(cbind(r$t[,1],r$t[,2],r$t[,3],r$t[,4],r$t[,5]))
colnames(z) <- list('mean','median','midrange','mode','mode k.dens')
bitmap(file='plot11.png')
boxplot(z,notch=TRUE,ylab='simulated values',main='Bootstrap Simulation - Central Tendency')
grid()
dev.off()
load(file='createtable')
a<-table.start()
a<-table.row.start(a)
a<-table.element(a,'Estimation Results of Bootstrap',10,TRUE)
a<-table.row.end(a)
if (par4 == 'P1 P5 Q1 Q3 P95 P99') {
myq.1 <- 0.01
myq.2 <- 0.05
myq.3 <- 0.95
myq.4 <- 0.99
myl.1 <- 'P1'
myl.2 <- 'P5'
myl.3 <- 'P95'
myl.4 <- 'P99'
}
if (par4 == 'P0.5 P2.5 Q1 Q3 P97.5 P99.5') {
myq.1 <- 0.005
myq.2 <- 0.025
myq.3 <- 0.975
myq.4 <- 0.995
myl.1 <- 'P0.5'
myl.2 <- 'P2.5'
myl.3 <- 'P97.5'
myl.4 <- 'P99.5'
}
if (par4 == 'P10 P20 Q1 Q3 P80 P90') {
myq.1 <- 0.10
myq.2 <- 0.20
myq.3 <- 0.80
myq.4 <- 0.90
myl.1 <- 'P10'
myl.2 <- 'P20'
myl.3 <- 'P80'
myl.4 <- 'P90'
}
a<-table.row.start(a)
a<-table.element(a,'statistic',header=TRUE)
a<-table.element(a,myl.1,header=TRUE)
a<-table.element(a,myl.2,header=TRUE)
a<-table.element(a,'Q1',header=TRUE)
a<-table.element(a,'Estimate',header=TRUE)
a<-table.element(a,'Q3',header=TRUE)
a<-table.element(a,myl.3,header=TRUE)
a<-table.element(a,myl.4,header=TRUE)
a<-table.element(a,'S.D.',header=TRUE)
a<-table.element(a,'IQR',header=TRUE)
a<-table.row.end(a)
a<-table.row.start(a)
a<-table.element(a,'mean',header=TRUE)
q1 <- quantile(r$t[,1],0.25)[[1]]
q3 <- quantile(r$t[,1],0.75)[[1]]
p01 <- quantile(r$t[,1],myq.1)[[1]]
p05 <- quantile(r$t[,1],myq.2)[[1]]
p95 <- quantile(r$t[,1],myq.3)[[1]]
p99 <- quantile(r$t[,1],myq.4)[[1]]
a<-table.element(a,signif(p01,par2))
a<-table.element(a,signif(p05,par2))
a<-table.element(a,signif(q1,par2))
a<-table.element(a,signif(r$t0[1],par2))
a<-table.element(a,signif(q3,par2))
a<-table.element(a,signif(p95,par2))
a<-table.element(a,signif(p99,par2))
a<-table.element( a,signif( sqrt(var(r$t[,1])),par2 ) )
a<-table.element(a,signif(q3-q1,par2))
a<-table.row.end(a)
a<-table.row.start(a)
a<-table.element(a,'median',header=TRUE)
q1 <- quantile(r$t[,2],0.25)[[1]]
q3 <- quantile(r$t[,2],0.75)[[1]]
p01 <- quantile(r$t[,2],myq.1)[[1]]
p05 <- quantile(r$t[,2],myq.2)[[1]]
p95 <- quantile(r$t[,2],myq.3)[[1]]
p99 <- quantile(r$t[,2],myq.4)[[1]]
a<-table.element(a,signif(p01,par2))
a<-table.element(a,signif(p05,par2))
a<-table.element(a,signif(q1,par2))
a<-table.element(a,signif(r$t0[2],par2))
a<-table.element(a,signif(q3,par2))
a<-table.element(a,signif(p95,par2))
a<-table.element(a,signif(p99,par2))
a<-table.element(a,signif(sqrt(var(r$t[,2])),par2))
a<-table.element(a,signif(q3-q1,par2))
a<-table.row.end(a)
a<-table.row.start(a)
a<-table.element(a,'midrange',header=TRUE)
q1 <- quantile(r$t[,3],0.25)[[1]]
q3 <- quantile(r$t[,3],0.75)[[1]]
p01 <- quantile(r$t[,3],myq.1)[[1]]
p05 <- quantile(r$t[,3],myq.2)[[1]]
p95 <- quantile(r$t[,3],myq.3)[[1]]
p99 <- quantile(r$t[,3],myq.4)[[1]]
a<-table.element(a,signif(p01,par2))
a<-table.element(a,signif(p05,par2))
a<-table.element(a,signif(q1,par2))
a<-table.element(a,signif(r$t0[3],par2))
a<-table.element(a,signif(q3,par2))
a<-table.element(a,signif(p95,par2))
a<-table.element(a,signif(p99,par2))
a<-table.element(a,signif(sqrt(var(r$t[,3])),par2))
a<-table.element(a,signif(q3-q1,par2))
a<-table.row.end(a)
a<-table.row.start(a)
a<-table.element(a,'mode',header=TRUE)
q1 <- quantile(r$t[,4],0.25)[[1]]
q3 <- quantile(r$t[,4],0.75)[[1]]
p01 <- quantile(r$t[,4],myq.1)[[1]]
p05 <- quantile(r$t[,4],myq.2)[[1]]
p95 <- quantile(r$t[,4],myq.3)[[1]]
p99 <- quantile(r$t[,4],myq.4)[[1]]
a<-table.element(a,signif(p01,par2))
a<-table.element(a,signif(p05,par2))
a<-table.element(a,signif(q1,par2))
a<-table.element(a,signif(r$t0[4],par2))
a<-table.element(a,signif(q3,par2))
a<-table.element(a,signif(p95,par2))
a<-table.element(a,signif(p99,par2))
a<-table.element(a,signif(sqrt(var(r$t[,4])),par2))
a<-table.element(a,signif(q3-q1,par2))
a<-table.row.end(a)
a<-table.row.start(a)
a<-table.element(a,'mode k.dens',header=TRUE)
q1 <- quantile(r$t[,5],0.25)[[1]]
q3 <- quantile(r$t[,5],0.75)[[1]]
p01 <- quantile(r$t[,5],myq.1)[[1]]
p05 <- quantile(r$t[,5],myq.2)[[1]]
p95 <- quantile(r$t[,5],myq.3)[[1]]
p99 <- quantile(r$t[,5],myq.4)[[1]]
a<-table.element(a,signif(p01,par2))
a<-table.element(a,signif(p05,par2))
a<-table.element(a,signif(q1,par2))
a<-table.element(a,signif(r$t0[5],par2))
a<-table.element(a,signif(q3,par2))
a<-table.element(a,signif(p95,par2))
a<-table.element(a,signif(p99,par2))
a<-table.element(a,signif(sqrt(var(r$t[,5])),par2))
a<-table.element(a,signif(q3-q1,par2))
a<-table.row.end(a)
a<-table.end(a)
table.save(a,file='mytable.tab')