Free Statistics

of Irreproducible Research!

Author's title

Author*The author of this computation has been verified*
R Software Modulerwasp_multipleregression.wasp
Title produced by softwareMultiple Regression
Date of computationTue, 16 Dec 2014 13:43:22 +0000
Cite this page as followsStatistical Computations at FreeStatistics.org, Office for Research Development and Education, URL https://freestatistics.org/blog/index.php?v=date/2014/Dec/16/t1418737596bpj0ooqph689e4z.htm/, Retrieved Thu, 16 May 2024 16:09:45 +0000
Statistical Computations at FreeStatistics.org, Office for Research Development and Education, URL https://freestatistics.org/blog/index.php?pk=269549, Retrieved Thu, 16 May 2024 16:09:45 +0000
QR Codes:

Original text written by user:
IsPrivate?No (this computation is public)
User-defined keywords
Estimated Impact74
Family? (F = Feedback message, R = changed R code, M = changed R Module, P = changed Parameters, D = changed Data)
-       [Multiple Regression] [] [2014-12-16 13:43:22] [4897fbbb7461c8caec7645a3718e7cbe] [Current]
Feedback Forum

Post a new message
Dataseries X:
26 50 7.5
37 54 6.5
67 71 1.0
43 54 1.0
52 65 5.5
52 73 8.5
43 52 6.5
84 84 4.5
67 42 2.0
49 66 5.0
70 65 0.5
58 73 5.0
68 75 2.5
62 72 5.0
43 66 5.5
56 70 3.5
74 81 4.0
63 69 6.5
58 71 4.5
63 68 5.5
53 70 4.0
57 68 7.5
64 67 4.0
53 76 5.5
29 70 2.5
54 60 5.5
58 72 3.5
51 71 4.5
54 70 4.5
56 64 6.0
47 76 5.0
50 68 6.5
35 76 5.0
30 65 6.0
68 67 4.5
56 75 5.0
43 60 5.0
67 73 6.5
62 63 7.0
57 70 4.5
54 66 8.5
61 64 3.5
56 70 6.0
41 75 1.5
53 60 3.5
46 66 7.5
51 59 5.0
37 78 6.5
42 67 6.5
38 59 6.5
66 66 7.0
53 71 1.5
49 66 4.0
49 72 4.5
59 71 0.0
40 59 3.5
63 78 4.5
34 65 0.0
32 65 3.0
67 71 3.5
61 72 3.0
60 66 1.0


Summary of computational transaction
Raw Inputview raw input (R code)
Raw Outputview raw output of R engine
Computing time5 seconds
R Server'Gwilym Jenkins' @ jenkins.wessa.net

\begin{tabular}{lllllllll}
\hline
Summary of computational transaction \tabularnewline
Raw Input & view raw input (R code)  \tabularnewline
Raw Output & view raw output of R engine  \tabularnewline
Computing time & 5 seconds \tabularnewline
R Server & 'Gwilym Jenkins' @ jenkins.wessa.net \tabularnewline
\hline
\end{tabular}
%Source: https://freestatistics.org/blog/index.php?pk=269549&T=0

[TABLE]
[ROW][C]Summary of computational transaction[/C][/ROW]
[ROW][C]Raw Input[/C][C]view raw input (R code) [/C][/ROW]
[ROW][C]Raw Output[/C][C]view raw output of R engine [/C][/ROW]
[ROW][C]Computing time[/C][C]5 seconds[/C][/ROW]
[ROW][C]R Server[/C][C]'Gwilym Jenkins' @ jenkins.wessa.net[/C][/ROW]
[/TABLE]
Source: https://freestatistics.org/blog/index.php?pk=269549&T=0

Globally Unique Identifier (entire table): ba.freestatistics.org/blog/index.php?pk=269549&T=0

As an alternative you can also use a QR Code:  

The GUIDs for individual cells are displayed in the table below:

Summary of computational transaction
Raw Inputview raw input (R code)
Raw Outputview raw output of R engine
Computing time5 seconds
R Server'Gwilym Jenkins' @ jenkins.wessa.net


Multiple Linear Regression - Estimated Regression Equation
Ex[t] = + 5.72938 -0.0241138AMS.I[t] + 0.00182349AMS.E[t] + e[t]

\begin{tabular}{lllllllll}
\hline
Multiple Linear Regression - Estimated Regression Equation \tabularnewline
Ex[t] =  +  5.72938 -0.0241138AMS.I[t] +  0.00182349AMS.E[t]  + e[t] \tabularnewline
\hline
\end{tabular}
%Source: https://freestatistics.org/blog/index.php?pk=269549&T=1

[TABLE]
[ROW][C]Multiple Linear Regression - Estimated Regression Equation[/C][/ROW]
[ROW][C]Ex[t] =  +  5.72938 -0.0241138AMS.I[t] +  0.00182349AMS.E[t]  + e[t][/C][/ROW]
[/TABLE]
Source: https://freestatistics.org/blog/index.php?pk=269549&T=1

Globally Unique Identifier (entire table): ba.freestatistics.org/blog/index.php?pk=269549&T=1

As an alternative you can also use a QR Code:  

The GUIDs for individual cells are displayed in the table below:

Multiple Linear Regression - Estimated Regression Equation
Ex[t] = + 5.72938 -0.0241138AMS.I[t] + 0.00182349AMS.E[t] + e[t]


Multiple Linear Regression - Ordinary Least Squares
VariableParameterS.D.T-STATH0: parameter = 02-tail p-value1-tail p-value
(Intercept)5.729382.42882.3590.02165810.0108291
AMS.I-0.02411380.0234022-1.030.3070240.153512
AMS.E0.001823490.03755590.048550.9614390.480719

\begin{tabular}{lllllllll}
\hline
Multiple Linear Regression - Ordinary Least Squares \tabularnewline
Variable & Parameter & S.D. & T-STATH0: parameter = 0 & 2-tail p-value & 1-tail p-value \tabularnewline
(Intercept) & 5.72938 & 2.4288 & 2.359 & 0.0216581 & 0.0108291 \tabularnewline
AMS.I & -0.0241138 & 0.0234022 & -1.03 & 0.307024 & 0.153512 \tabularnewline
AMS.E & 0.00182349 & 0.0375559 & 0.04855 & 0.961439 & 0.480719 \tabularnewline
\hline
\end{tabular}
%Source: https://freestatistics.org/blog/index.php?pk=269549&T=2

[TABLE]
[ROW][C]Multiple Linear Regression - Ordinary Least Squares[/C][/ROW]
[ROW][C]Variable[/C][C]Parameter[/C][C]S.D.[/C][C]T-STATH0: parameter = 0[/C][C]2-tail p-value[/C][C]1-tail p-value[/C][/ROW]
[ROW][C](Intercept)[/C][C]5.72938[/C][C]2.4288[/C][C]2.359[/C][C]0.0216581[/C][C]0.0108291[/C][/ROW]
[ROW][C]AMS.I[/C][C]-0.0241138[/C][C]0.0234022[/C][C]-1.03[/C][C]0.307024[/C][C]0.153512[/C][/ROW]
[ROW][C]AMS.E[/C][C]0.00182349[/C][C]0.0375559[/C][C]0.04855[/C][C]0.961439[/C][C]0.480719[/C][/ROW]
[/TABLE]
Source: https://freestatistics.org/blog/index.php?pk=269549&T=2

Globally Unique Identifier (entire table): ba.freestatistics.org/blog/index.php?pk=269549&T=2

As an alternative you can also use a QR Code:  

The GUIDs for individual cells are displayed in the table below:

Multiple Linear Regression - Ordinary Least Squares
VariableParameterS.D.T-STATH0: parameter = 02-tail p-value1-tail p-value
(Intercept)5.729382.42882.3590.02165810.0108291
AMS.I-0.02411380.0234022-1.030.3070240.153512
AMS.E0.001823490.03755590.048550.9614390.480719


Multiple Linear Regression - Regression Statistics
Multiple R0.139171
R-squared0.0193685
Adjusted R-squared-0.0138733
F-TEST (value)0.582655
F-TEST (DF numerator)2
F-TEST (DF denominator)59
p-value0.561594
Multiple Linear Regression - Residual Statistics
Residual Standard Deviation2.05437
Sum Squared Residuals249.005

\begin{tabular}{lllllllll}
\hline
Multiple Linear Regression - Regression Statistics \tabularnewline
Multiple R & 0.139171 \tabularnewline
R-squared & 0.0193685 \tabularnewline
Adjusted R-squared & -0.0138733 \tabularnewline
F-TEST (value) & 0.582655 \tabularnewline
F-TEST (DF numerator) & 2 \tabularnewline
F-TEST (DF denominator) & 59 \tabularnewline
p-value & 0.561594 \tabularnewline
Multiple Linear Regression - Residual Statistics \tabularnewline
Residual Standard Deviation & 2.05437 \tabularnewline
Sum Squared Residuals & 249.005 \tabularnewline
\hline
\end{tabular}
%Source: https://freestatistics.org/blog/index.php?pk=269549&T=3

[TABLE]
[ROW][C]Multiple Linear Regression - Regression Statistics[/C][/ROW]
[ROW][C]Multiple R[/C][C]0.139171[/C][/ROW]
[ROW][C]R-squared[/C][C]0.0193685[/C][/ROW]
[ROW][C]Adjusted R-squared[/C][C]-0.0138733[/C][/ROW]
[ROW][C]F-TEST (value)[/C][C]0.582655[/C][/ROW]
[ROW][C]F-TEST (DF numerator)[/C][C]2[/C][/ROW]
[ROW][C]F-TEST (DF denominator)[/C][C]59[/C][/ROW]
[ROW][C]p-value[/C][C]0.561594[/C][/ROW]
[ROW][C]Multiple Linear Regression - Residual Statistics[/C][/ROW]
[ROW][C]Residual Standard Deviation[/C][C]2.05437[/C][/ROW]
[ROW][C]Sum Squared Residuals[/C][C]249.005[/C][/ROW]
[/TABLE]
Source: https://freestatistics.org/blog/index.php?pk=269549&T=3

Globally Unique Identifier (entire table): ba.freestatistics.org/blog/index.php?pk=269549&T=3

As an alternative you can also use a QR Code:  

The GUIDs for individual cells are displayed in the table below:

Multiple Linear Regression - Regression Statistics
Multiple R0.139171
R-squared0.0193685
Adjusted R-squared-0.0138733
F-TEST (value)0.582655
F-TEST (DF numerator)2
F-TEST (DF denominator)59
p-value0.561594
Multiple Linear Regression - Residual Statistics
Residual Standard Deviation2.05437
Sum Squared Residuals249.005


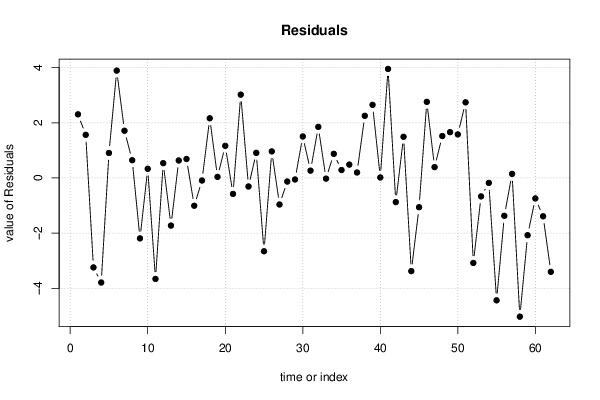
Multiple Linear Regression - Actuals, Interpolation, and Residuals
Time or IndexActualsInterpolationForecastResidualsPrediction Error
17.55.19362.3064
26.54.935641.56436
314.24323-3.24323
414.79096-3.79096
55.54.593990.906008
68.54.608583.89142
76.54.787311.71269
84.53.8570.643004
924.19034-2.19034
1054.668160.331843
110.54.15994-3.65994
1254.46390.536103
132.54.22641-1.72641
1454.365620.634382
155.54.812840.68716
163.54.50665-1.00665
1744.09266-0.092664
186.54.336032.16397
194.54.460250.0397498
205.54.334211.16579
2144.579-0.578996
227.54.478893.02111
2344.30827-0.308273
245.54.589940.910063
252.55.15773-2.65773
265.54.536650.963353
273.54.46207-0.962074
284.54.62905-0.129047
294.54.55488-0.054882
3064.495711.50429
3154.734620.26538
326.54.647691.85231
3355.02399-0.0239854
3465.12450.875504
354.54.211820.288182
3654.515770.484228
3754.80190.198101
386.54.246872.25313
3974.349212.65079
404.54.482540.0174595
418.54.547593.95241
423.54.37514-0.875144
4364.506651.49335
441.54.87748-3.37748
453.54.56076-1.06076
467.54.74052.7595
4754.607170.392835
486.54.97941.5206
496.54.838781.66122
506.54.920641.57936
5174.258222.74178
521.54.58082-3.08082
5344.66816-0.668157
544.54.6791-0.179098
5504.43614-4.43614
563.54.87242-1.37242
574.54.352450.147554
5805.02804-5.02804
5935.07627-2.07627
603.54.24323-0.743226
6134.38973-1.38973
6214.40291-3.40291

\begin{tabular}{lllllllll}
\hline
Multiple Linear Regression - Actuals, Interpolation, and Residuals \tabularnewline
Time or Index & Actuals & InterpolationForecast & ResidualsPrediction Error \tabularnewline
1 & 7.5 & 5.1936 & 2.3064 \tabularnewline
2 & 6.5 & 4.93564 & 1.56436 \tabularnewline
3 & 1 & 4.24323 & -3.24323 \tabularnewline
4 & 1 & 4.79096 & -3.79096 \tabularnewline
5 & 5.5 & 4.59399 & 0.906008 \tabularnewline
6 & 8.5 & 4.60858 & 3.89142 \tabularnewline
7 & 6.5 & 4.78731 & 1.71269 \tabularnewline
8 & 4.5 & 3.857 & 0.643004 \tabularnewline
9 & 2 & 4.19034 & -2.19034 \tabularnewline
10 & 5 & 4.66816 & 0.331843 \tabularnewline
11 & 0.5 & 4.15994 & -3.65994 \tabularnewline
12 & 5 & 4.4639 & 0.536103 \tabularnewline
13 & 2.5 & 4.22641 & -1.72641 \tabularnewline
14 & 5 & 4.36562 & 0.634382 \tabularnewline
15 & 5.5 & 4.81284 & 0.68716 \tabularnewline
16 & 3.5 & 4.50665 & -1.00665 \tabularnewline
17 & 4 & 4.09266 & -0.092664 \tabularnewline
18 & 6.5 & 4.33603 & 2.16397 \tabularnewline
19 & 4.5 & 4.46025 & 0.0397498 \tabularnewline
20 & 5.5 & 4.33421 & 1.16579 \tabularnewline
21 & 4 & 4.579 & -0.578996 \tabularnewline
22 & 7.5 & 4.47889 & 3.02111 \tabularnewline
23 & 4 & 4.30827 & -0.308273 \tabularnewline
24 & 5.5 & 4.58994 & 0.910063 \tabularnewline
25 & 2.5 & 5.15773 & -2.65773 \tabularnewline
26 & 5.5 & 4.53665 & 0.963353 \tabularnewline
27 & 3.5 & 4.46207 & -0.962074 \tabularnewline
28 & 4.5 & 4.62905 & -0.129047 \tabularnewline
29 & 4.5 & 4.55488 & -0.054882 \tabularnewline
30 & 6 & 4.49571 & 1.50429 \tabularnewline
31 & 5 & 4.73462 & 0.26538 \tabularnewline
32 & 6.5 & 4.64769 & 1.85231 \tabularnewline
33 & 5 & 5.02399 & -0.0239854 \tabularnewline
34 & 6 & 5.1245 & 0.875504 \tabularnewline
35 & 4.5 & 4.21182 & 0.288182 \tabularnewline
36 & 5 & 4.51577 & 0.484228 \tabularnewline
37 & 5 & 4.8019 & 0.198101 \tabularnewline
38 & 6.5 & 4.24687 & 2.25313 \tabularnewline
39 & 7 & 4.34921 & 2.65079 \tabularnewline
40 & 4.5 & 4.48254 & 0.0174595 \tabularnewline
41 & 8.5 & 4.54759 & 3.95241 \tabularnewline
42 & 3.5 & 4.37514 & -0.875144 \tabularnewline
43 & 6 & 4.50665 & 1.49335 \tabularnewline
44 & 1.5 & 4.87748 & -3.37748 \tabularnewline
45 & 3.5 & 4.56076 & -1.06076 \tabularnewline
46 & 7.5 & 4.7405 & 2.7595 \tabularnewline
47 & 5 & 4.60717 & 0.392835 \tabularnewline
48 & 6.5 & 4.9794 & 1.5206 \tabularnewline
49 & 6.5 & 4.83878 & 1.66122 \tabularnewline
50 & 6.5 & 4.92064 & 1.57936 \tabularnewline
51 & 7 & 4.25822 & 2.74178 \tabularnewline
52 & 1.5 & 4.58082 & -3.08082 \tabularnewline
53 & 4 & 4.66816 & -0.668157 \tabularnewline
54 & 4.5 & 4.6791 & -0.179098 \tabularnewline
55 & 0 & 4.43614 & -4.43614 \tabularnewline
56 & 3.5 & 4.87242 & -1.37242 \tabularnewline
57 & 4.5 & 4.35245 & 0.147554 \tabularnewline
58 & 0 & 5.02804 & -5.02804 \tabularnewline
59 & 3 & 5.07627 & -2.07627 \tabularnewline
60 & 3.5 & 4.24323 & -0.743226 \tabularnewline
61 & 3 & 4.38973 & -1.38973 \tabularnewline
62 & 1 & 4.40291 & -3.40291 \tabularnewline
\hline
\end{tabular}
%Source: https://freestatistics.org/blog/index.php?pk=269549&T=4

[TABLE]
[ROW][C]Multiple Linear Regression - Actuals, Interpolation, and Residuals[/C][/ROW]
[ROW][C]Time or Index[/C][C]Actuals[/C][C]InterpolationForecast[/C][C]ResidualsPrediction Error[/C][/ROW]
[ROW][C]1[/C][C]7.5[/C][C]5.1936[/C][C]2.3064[/C][/ROW]
[ROW][C]2[/C][C]6.5[/C][C]4.93564[/C][C]1.56436[/C][/ROW]
[ROW][C]3[/C][C]1[/C][C]4.24323[/C][C]-3.24323[/C][/ROW]
[ROW][C]4[/C][C]1[/C][C]4.79096[/C][C]-3.79096[/C][/ROW]
[ROW][C]5[/C][C]5.5[/C][C]4.59399[/C][C]0.906008[/C][/ROW]
[ROW][C]6[/C][C]8.5[/C][C]4.60858[/C][C]3.89142[/C][/ROW]
[ROW][C]7[/C][C]6.5[/C][C]4.78731[/C][C]1.71269[/C][/ROW]
[ROW][C]8[/C][C]4.5[/C][C]3.857[/C][C]0.643004[/C][/ROW]
[ROW][C]9[/C][C]2[/C][C]4.19034[/C][C]-2.19034[/C][/ROW]
[ROW][C]10[/C][C]5[/C][C]4.66816[/C][C]0.331843[/C][/ROW]
[ROW][C]11[/C][C]0.5[/C][C]4.15994[/C][C]-3.65994[/C][/ROW]
[ROW][C]12[/C][C]5[/C][C]4.4639[/C][C]0.536103[/C][/ROW]
[ROW][C]13[/C][C]2.5[/C][C]4.22641[/C][C]-1.72641[/C][/ROW]
[ROW][C]14[/C][C]5[/C][C]4.36562[/C][C]0.634382[/C][/ROW]
[ROW][C]15[/C][C]5.5[/C][C]4.81284[/C][C]0.68716[/C][/ROW]
[ROW][C]16[/C][C]3.5[/C][C]4.50665[/C][C]-1.00665[/C][/ROW]
[ROW][C]17[/C][C]4[/C][C]4.09266[/C][C]-0.092664[/C][/ROW]
[ROW][C]18[/C][C]6.5[/C][C]4.33603[/C][C]2.16397[/C][/ROW]
[ROW][C]19[/C][C]4.5[/C][C]4.46025[/C][C]0.0397498[/C][/ROW]
[ROW][C]20[/C][C]5.5[/C][C]4.33421[/C][C]1.16579[/C][/ROW]
[ROW][C]21[/C][C]4[/C][C]4.579[/C][C]-0.578996[/C][/ROW]
[ROW][C]22[/C][C]7.5[/C][C]4.47889[/C][C]3.02111[/C][/ROW]
[ROW][C]23[/C][C]4[/C][C]4.30827[/C][C]-0.308273[/C][/ROW]
[ROW][C]24[/C][C]5.5[/C][C]4.58994[/C][C]0.910063[/C][/ROW]
[ROW][C]25[/C][C]2.5[/C][C]5.15773[/C][C]-2.65773[/C][/ROW]
[ROW][C]26[/C][C]5.5[/C][C]4.53665[/C][C]0.963353[/C][/ROW]
[ROW][C]27[/C][C]3.5[/C][C]4.46207[/C][C]-0.962074[/C][/ROW]
[ROW][C]28[/C][C]4.5[/C][C]4.62905[/C][C]-0.129047[/C][/ROW]
[ROW][C]29[/C][C]4.5[/C][C]4.55488[/C][C]-0.054882[/C][/ROW]
[ROW][C]30[/C][C]6[/C][C]4.49571[/C][C]1.50429[/C][/ROW]
[ROW][C]31[/C][C]5[/C][C]4.73462[/C][C]0.26538[/C][/ROW]
[ROW][C]32[/C][C]6.5[/C][C]4.64769[/C][C]1.85231[/C][/ROW]
[ROW][C]33[/C][C]5[/C][C]5.02399[/C][C]-0.0239854[/C][/ROW]
[ROW][C]34[/C][C]6[/C][C]5.1245[/C][C]0.875504[/C][/ROW]
[ROW][C]35[/C][C]4.5[/C][C]4.21182[/C][C]0.288182[/C][/ROW]
[ROW][C]36[/C][C]5[/C][C]4.51577[/C][C]0.484228[/C][/ROW]
[ROW][C]37[/C][C]5[/C][C]4.8019[/C][C]0.198101[/C][/ROW]
[ROW][C]38[/C][C]6.5[/C][C]4.24687[/C][C]2.25313[/C][/ROW]
[ROW][C]39[/C][C]7[/C][C]4.34921[/C][C]2.65079[/C][/ROW]
[ROW][C]40[/C][C]4.5[/C][C]4.48254[/C][C]0.0174595[/C][/ROW]
[ROW][C]41[/C][C]8.5[/C][C]4.54759[/C][C]3.95241[/C][/ROW]
[ROW][C]42[/C][C]3.5[/C][C]4.37514[/C][C]-0.875144[/C][/ROW]
[ROW][C]43[/C][C]6[/C][C]4.50665[/C][C]1.49335[/C][/ROW]
[ROW][C]44[/C][C]1.5[/C][C]4.87748[/C][C]-3.37748[/C][/ROW]
[ROW][C]45[/C][C]3.5[/C][C]4.56076[/C][C]-1.06076[/C][/ROW]
[ROW][C]46[/C][C]7.5[/C][C]4.7405[/C][C]2.7595[/C][/ROW]
[ROW][C]47[/C][C]5[/C][C]4.60717[/C][C]0.392835[/C][/ROW]
[ROW][C]48[/C][C]6.5[/C][C]4.9794[/C][C]1.5206[/C][/ROW]
[ROW][C]49[/C][C]6.5[/C][C]4.83878[/C][C]1.66122[/C][/ROW]
[ROW][C]50[/C][C]6.5[/C][C]4.92064[/C][C]1.57936[/C][/ROW]
[ROW][C]51[/C][C]7[/C][C]4.25822[/C][C]2.74178[/C][/ROW]
[ROW][C]52[/C][C]1.5[/C][C]4.58082[/C][C]-3.08082[/C][/ROW]
[ROW][C]53[/C][C]4[/C][C]4.66816[/C][C]-0.668157[/C][/ROW]
[ROW][C]54[/C][C]4.5[/C][C]4.6791[/C][C]-0.179098[/C][/ROW]
[ROW][C]55[/C][C]0[/C][C]4.43614[/C][C]-4.43614[/C][/ROW]
[ROW][C]56[/C][C]3.5[/C][C]4.87242[/C][C]-1.37242[/C][/ROW]
[ROW][C]57[/C][C]4.5[/C][C]4.35245[/C][C]0.147554[/C][/ROW]
[ROW][C]58[/C][C]0[/C][C]5.02804[/C][C]-5.02804[/C][/ROW]
[ROW][C]59[/C][C]3[/C][C]5.07627[/C][C]-2.07627[/C][/ROW]
[ROW][C]60[/C][C]3.5[/C][C]4.24323[/C][C]-0.743226[/C][/ROW]
[ROW][C]61[/C][C]3[/C][C]4.38973[/C][C]-1.38973[/C][/ROW]
[ROW][C]62[/C][C]1[/C][C]4.40291[/C][C]-3.40291[/C][/ROW]
[/TABLE]
Source: https://freestatistics.org/blog/index.php?pk=269549&T=4

Globally Unique Identifier (entire table): ba.freestatistics.org/blog/index.php?pk=269549&T=4

As an alternative you can also use a QR Code:  

The GUIDs for individual cells are displayed in the table below:

Multiple Linear Regression - Actuals, Interpolation, and Residuals
Time or IndexActualsInterpolationForecastResidualsPrediction Error
17.55.19362.3064
26.54.935641.56436
314.24323-3.24323
414.79096-3.79096
55.54.593990.906008
68.54.608583.89142
76.54.787311.71269
84.53.8570.643004
924.19034-2.19034
1054.668160.331843
110.54.15994-3.65994
1254.46390.536103
132.54.22641-1.72641
1454.365620.634382
155.54.812840.68716
163.54.50665-1.00665
1744.09266-0.092664
186.54.336032.16397
194.54.460250.0397498
205.54.334211.16579
2144.579-0.578996
227.54.478893.02111
2344.30827-0.308273
245.54.589940.910063
252.55.15773-2.65773
265.54.536650.963353
273.54.46207-0.962074
284.54.62905-0.129047
294.54.55488-0.054882
3064.495711.50429
3154.734620.26538
326.54.647691.85231
3355.02399-0.0239854
3465.12450.875504
354.54.211820.288182
3654.515770.484228
3754.80190.198101
386.54.246872.25313
3974.349212.65079
404.54.482540.0174595
418.54.547593.95241
423.54.37514-0.875144
4364.506651.49335
441.54.87748-3.37748
453.54.56076-1.06076
467.54.74052.7595
4754.607170.392835
486.54.97941.5206
496.54.838781.66122
506.54.920641.57936
5174.258222.74178
521.54.58082-3.08082
5344.66816-0.668157
544.54.6791-0.179098
5504.43614-4.43614
563.54.87242-1.37242
574.54.352450.147554
5805.02804-5.02804
5935.07627-2.07627
603.54.24323-0.743226
6134.38973-1.38973
6214.40291-3.40291


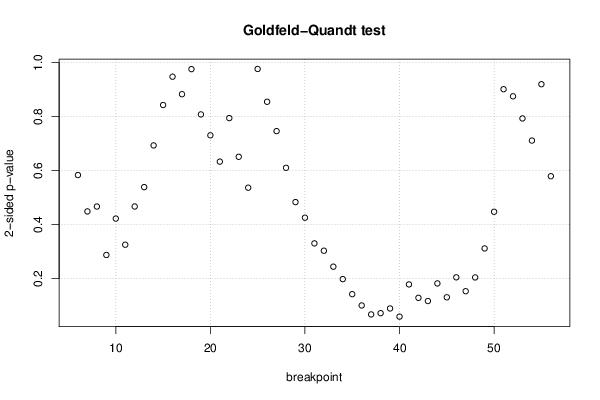
Goldfeld-Quandt test for Heteroskedasticity
p-valuesAlternative Hypothesis
breakpoint indexgreater2-sidedless
60.2917440.5834890.708256
70.7756850.448630.224315
80.7665680.4668640.233432
90.8564620.2870770.143538
100.7889460.4221070.211054
110.837410.325180.16259
120.7665530.4668950.233447
130.7306390.5387220.269361
140.6533360.6933270.346664
150.5784440.8431120.421556
160.5259060.9481880.474094
170.4416330.8832660.558367
180.4880880.9761770.511912
190.4041730.8083460.595827
200.3654430.7308850.634557
210.3166570.6333140.683343
220.3973340.7946680.602666
230.3256070.6512140.674393
240.2682950.536590.731705
250.4884570.9769140.511543
260.427620.8552390.57238
270.373220.746440.62678
280.3051480.6102950.694852
290.2416280.4832550.758372
300.2126930.4253860.787307
310.1650780.3301560.834922
320.1514380.3028770.848562
330.1218850.2437710.878115
340.09882430.1976490.901176
350.07090290.1418060.929097
360.04998320.09996630.950017
370.03337120.06674240.966629
380.03568530.07137060.964315
390.04437970.08875940.95562
400.02922660.05845320.970773
410.08898250.1779650.911018
420.06411260.1282250.935887
430.0581880.1163760.941812
440.09084550.1816910.909154
450.06516070.1303210.934839
460.1021530.2043060.897847
470.07638070.1527610.923619
480.1019510.2039020.898049
490.15570.31140.8443
500.2236630.4473260.776337
510.4508760.9017510.549124
520.4377620.8755250.562238
530.3967040.7934080.603296
540.3557010.7114010.644299
550.5398760.9202480.460124
560.7104110.5791770.289589

\begin{tabular}{lllllllll}
\hline
Goldfeld-Quandt test for Heteroskedasticity \tabularnewline
p-values & Alternative Hypothesis \tabularnewline
breakpoint index & greater & 2-sided & less \tabularnewline
6 & 0.291744 & 0.583489 & 0.708256 \tabularnewline
7 & 0.775685 & 0.44863 & 0.224315 \tabularnewline
8 & 0.766568 & 0.466864 & 0.233432 \tabularnewline
9 & 0.856462 & 0.287077 & 0.143538 \tabularnewline
10 & 0.788946 & 0.422107 & 0.211054 \tabularnewline
11 & 0.83741 & 0.32518 & 0.16259 \tabularnewline
12 & 0.766553 & 0.466895 & 0.233447 \tabularnewline
13 & 0.730639 & 0.538722 & 0.269361 \tabularnewline
14 & 0.653336 & 0.693327 & 0.346664 \tabularnewline
15 & 0.578444 & 0.843112 & 0.421556 \tabularnewline
16 & 0.525906 & 0.948188 & 0.474094 \tabularnewline
17 & 0.441633 & 0.883266 & 0.558367 \tabularnewline
18 & 0.488088 & 0.976177 & 0.511912 \tabularnewline
19 & 0.404173 & 0.808346 & 0.595827 \tabularnewline
20 & 0.365443 & 0.730885 & 0.634557 \tabularnewline
21 & 0.316657 & 0.633314 & 0.683343 \tabularnewline
22 & 0.397334 & 0.794668 & 0.602666 \tabularnewline
23 & 0.325607 & 0.651214 & 0.674393 \tabularnewline
24 & 0.268295 & 0.53659 & 0.731705 \tabularnewline
25 & 0.488457 & 0.976914 & 0.511543 \tabularnewline
26 & 0.42762 & 0.855239 & 0.57238 \tabularnewline
27 & 0.37322 & 0.74644 & 0.62678 \tabularnewline
28 & 0.305148 & 0.610295 & 0.694852 \tabularnewline
29 & 0.241628 & 0.483255 & 0.758372 \tabularnewline
30 & 0.212693 & 0.425386 & 0.787307 \tabularnewline
31 & 0.165078 & 0.330156 & 0.834922 \tabularnewline
32 & 0.151438 & 0.302877 & 0.848562 \tabularnewline
33 & 0.121885 & 0.243771 & 0.878115 \tabularnewline
34 & 0.0988243 & 0.197649 & 0.901176 \tabularnewline
35 & 0.0709029 & 0.141806 & 0.929097 \tabularnewline
36 & 0.0499832 & 0.0999663 & 0.950017 \tabularnewline
37 & 0.0333712 & 0.0667424 & 0.966629 \tabularnewline
38 & 0.0356853 & 0.0713706 & 0.964315 \tabularnewline
39 & 0.0443797 & 0.0887594 & 0.95562 \tabularnewline
40 & 0.0292266 & 0.0584532 & 0.970773 \tabularnewline
41 & 0.0889825 & 0.177965 & 0.911018 \tabularnewline
42 & 0.0641126 & 0.128225 & 0.935887 \tabularnewline
43 & 0.058188 & 0.116376 & 0.941812 \tabularnewline
44 & 0.0908455 & 0.181691 & 0.909154 \tabularnewline
45 & 0.0651607 & 0.130321 & 0.934839 \tabularnewline
46 & 0.102153 & 0.204306 & 0.897847 \tabularnewline
47 & 0.0763807 & 0.152761 & 0.923619 \tabularnewline
48 & 0.101951 & 0.203902 & 0.898049 \tabularnewline
49 & 0.1557 & 0.3114 & 0.8443 \tabularnewline
50 & 0.223663 & 0.447326 & 0.776337 \tabularnewline
51 & 0.450876 & 0.901751 & 0.549124 \tabularnewline
52 & 0.437762 & 0.875525 & 0.562238 \tabularnewline
53 & 0.396704 & 0.793408 & 0.603296 \tabularnewline
54 & 0.355701 & 0.711401 & 0.644299 \tabularnewline
55 & 0.539876 & 0.920248 & 0.460124 \tabularnewline
56 & 0.710411 & 0.579177 & 0.289589 \tabularnewline
\hline
\end{tabular}
%Source: https://freestatistics.org/blog/index.php?pk=269549&T=5

[TABLE]
[ROW][C]Goldfeld-Quandt test for Heteroskedasticity[/C][/ROW]
[ROW][C]p-values[/C][C]Alternative Hypothesis[/C][/ROW]
[ROW][C]breakpoint index[/C][C]greater[/C][C]2-sided[/C][C]less[/C][/ROW]
[ROW][C]6[/C][C]0.291744[/C][C]0.583489[/C][C]0.708256[/C][/ROW]
[ROW][C]7[/C][C]0.775685[/C][C]0.44863[/C][C]0.224315[/C][/ROW]
[ROW][C]8[/C][C]0.766568[/C][C]0.466864[/C][C]0.233432[/C][/ROW]
[ROW][C]9[/C][C]0.856462[/C][C]0.287077[/C][C]0.143538[/C][/ROW]
[ROW][C]10[/C][C]0.788946[/C][C]0.422107[/C][C]0.211054[/C][/ROW]
[ROW][C]11[/C][C]0.83741[/C][C]0.32518[/C][C]0.16259[/C][/ROW]
[ROW][C]12[/C][C]0.766553[/C][C]0.466895[/C][C]0.233447[/C][/ROW]
[ROW][C]13[/C][C]0.730639[/C][C]0.538722[/C][C]0.269361[/C][/ROW]
[ROW][C]14[/C][C]0.653336[/C][C]0.693327[/C][C]0.346664[/C][/ROW]
[ROW][C]15[/C][C]0.578444[/C][C]0.843112[/C][C]0.421556[/C][/ROW]
[ROW][C]16[/C][C]0.525906[/C][C]0.948188[/C][C]0.474094[/C][/ROW]
[ROW][C]17[/C][C]0.441633[/C][C]0.883266[/C][C]0.558367[/C][/ROW]
[ROW][C]18[/C][C]0.488088[/C][C]0.976177[/C][C]0.511912[/C][/ROW]
[ROW][C]19[/C][C]0.404173[/C][C]0.808346[/C][C]0.595827[/C][/ROW]
[ROW][C]20[/C][C]0.365443[/C][C]0.730885[/C][C]0.634557[/C][/ROW]
[ROW][C]21[/C][C]0.316657[/C][C]0.633314[/C][C]0.683343[/C][/ROW]
[ROW][C]22[/C][C]0.397334[/C][C]0.794668[/C][C]0.602666[/C][/ROW]
[ROW][C]23[/C][C]0.325607[/C][C]0.651214[/C][C]0.674393[/C][/ROW]
[ROW][C]24[/C][C]0.268295[/C][C]0.53659[/C][C]0.731705[/C][/ROW]
[ROW][C]25[/C][C]0.488457[/C][C]0.976914[/C][C]0.511543[/C][/ROW]
[ROW][C]26[/C][C]0.42762[/C][C]0.855239[/C][C]0.57238[/C][/ROW]
[ROW][C]27[/C][C]0.37322[/C][C]0.74644[/C][C]0.62678[/C][/ROW]
[ROW][C]28[/C][C]0.305148[/C][C]0.610295[/C][C]0.694852[/C][/ROW]
[ROW][C]29[/C][C]0.241628[/C][C]0.483255[/C][C]0.758372[/C][/ROW]
[ROW][C]30[/C][C]0.212693[/C][C]0.425386[/C][C]0.787307[/C][/ROW]
[ROW][C]31[/C][C]0.165078[/C][C]0.330156[/C][C]0.834922[/C][/ROW]
[ROW][C]32[/C][C]0.151438[/C][C]0.302877[/C][C]0.848562[/C][/ROW]
[ROW][C]33[/C][C]0.121885[/C][C]0.243771[/C][C]0.878115[/C][/ROW]
[ROW][C]34[/C][C]0.0988243[/C][C]0.197649[/C][C]0.901176[/C][/ROW]
[ROW][C]35[/C][C]0.0709029[/C][C]0.141806[/C][C]0.929097[/C][/ROW]
[ROW][C]36[/C][C]0.0499832[/C][C]0.0999663[/C][C]0.950017[/C][/ROW]
[ROW][C]37[/C][C]0.0333712[/C][C]0.0667424[/C][C]0.966629[/C][/ROW]
[ROW][C]38[/C][C]0.0356853[/C][C]0.0713706[/C][C]0.964315[/C][/ROW]
[ROW][C]39[/C][C]0.0443797[/C][C]0.0887594[/C][C]0.95562[/C][/ROW]
[ROW][C]40[/C][C]0.0292266[/C][C]0.0584532[/C][C]0.970773[/C][/ROW]
[ROW][C]41[/C][C]0.0889825[/C][C]0.177965[/C][C]0.911018[/C][/ROW]
[ROW][C]42[/C][C]0.0641126[/C][C]0.128225[/C][C]0.935887[/C][/ROW]
[ROW][C]43[/C][C]0.058188[/C][C]0.116376[/C][C]0.941812[/C][/ROW]
[ROW][C]44[/C][C]0.0908455[/C][C]0.181691[/C][C]0.909154[/C][/ROW]
[ROW][C]45[/C][C]0.0651607[/C][C]0.130321[/C][C]0.934839[/C][/ROW]
[ROW][C]46[/C][C]0.102153[/C][C]0.204306[/C][C]0.897847[/C][/ROW]
[ROW][C]47[/C][C]0.0763807[/C][C]0.152761[/C][C]0.923619[/C][/ROW]
[ROW][C]48[/C][C]0.101951[/C][C]0.203902[/C][C]0.898049[/C][/ROW]
[ROW][C]49[/C][C]0.1557[/C][C]0.3114[/C][C]0.8443[/C][/ROW]
[ROW][C]50[/C][C]0.223663[/C][C]0.447326[/C][C]0.776337[/C][/ROW]
[ROW][C]51[/C][C]0.450876[/C][C]0.901751[/C][C]0.549124[/C][/ROW]
[ROW][C]52[/C][C]0.437762[/C][C]0.875525[/C][C]0.562238[/C][/ROW]
[ROW][C]53[/C][C]0.396704[/C][C]0.793408[/C][C]0.603296[/C][/ROW]
[ROW][C]54[/C][C]0.355701[/C][C]0.711401[/C][C]0.644299[/C][/ROW]
[ROW][C]55[/C][C]0.539876[/C][C]0.920248[/C][C]0.460124[/C][/ROW]
[ROW][C]56[/C][C]0.710411[/C][C]0.579177[/C][C]0.289589[/C][/ROW]
[/TABLE]
Source: https://freestatistics.org/blog/index.php?pk=269549&T=5

Globally Unique Identifier (entire table): ba.freestatistics.org/blog/index.php?pk=269549&T=5

As an alternative you can also use a QR Code:  

The GUIDs for individual cells are displayed in the table below:

Goldfeld-Quandt test for Heteroskedasticity
p-valuesAlternative Hypothesis
breakpoint indexgreater2-sidedless
60.2917440.5834890.708256
70.7756850.448630.224315
80.7665680.4668640.233432
90.8564620.2870770.143538
100.7889460.4221070.211054
110.837410.325180.16259
120.7665530.4668950.233447
130.7306390.5387220.269361
140.6533360.6933270.346664
150.5784440.8431120.421556
160.5259060.9481880.474094
170.4416330.8832660.558367
180.4880880.9761770.511912
190.4041730.8083460.595827
200.3654430.7308850.634557
210.3166570.6333140.683343
220.3973340.7946680.602666
230.3256070.6512140.674393
240.2682950.536590.731705
250.4884570.9769140.511543
260.427620.8552390.57238
270.373220.746440.62678
280.3051480.6102950.694852
290.2416280.4832550.758372
300.2126930.4253860.787307
310.1650780.3301560.834922
320.1514380.3028770.848562
330.1218850.2437710.878115
340.09882430.1976490.901176
350.07090290.1418060.929097
360.04998320.09996630.950017
370.03337120.06674240.966629
380.03568530.07137060.964315
390.04437970.08875940.95562
400.02922660.05845320.970773
410.08898250.1779650.911018
420.06411260.1282250.935887
430.0581880.1163760.941812
440.09084550.1816910.909154
450.06516070.1303210.934839
460.1021530.2043060.897847
470.07638070.1527610.923619
480.1019510.2039020.898049
490.15570.31140.8443
500.2236630.4473260.776337
510.4508760.9017510.549124
520.4377620.8755250.562238
530.3967040.7934080.603296
540.3557010.7114010.644299
550.5398760.9202480.460124
560.7104110.5791770.289589


Meta Analysis of Goldfeld-Quandt test for Heteroskedasticity
Description# significant tests% significant testsOK/NOK
1% type I error level00OK
5% type I error level00OK
10% type I error level50.0980392OK

\begin{tabular}{lllllllll}
\hline
Meta Analysis of Goldfeld-Quandt test for Heteroskedasticity \tabularnewline
Description & # significant tests & % significant tests & OK/NOK \tabularnewline
1% type I error level & 0 & 0 & OK \tabularnewline
5% type I error level & 0 & 0 & OK \tabularnewline
10% type I error level & 5 & 0.0980392 & OK \tabularnewline
\hline
\end{tabular}
%Source: https://freestatistics.org/blog/index.php?pk=269549&T=6

[TABLE]
[ROW][C]Meta Analysis of Goldfeld-Quandt test for Heteroskedasticity[/C][/ROW]
[ROW][C]Description[/C][C]# significant tests[/C][C]% significant tests[/C][C]OK/NOK[/C][/ROW]
[ROW][C]1% type I error level[/C][C]0[/C][C]0[/C][C]OK[/C][/ROW]
[ROW][C]5% type I error level[/C][C]0[/C][C]0[/C][C]OK[/C][/ROW]
[ROW][C]10% type I error level[/C][C]5[/C][C]0.0980392[/C][C]OK[/C][/ROW]
[/TABLE]
Source: https://freestatistics.org/blog/index.php?pk=269549&T=6

Globally Unique Identifier (entire table): ba.freestatistics.org/blog/index.php?pk=269549&T=6

As an alternative you can also use a QR Code:  

The GUIDs for individual cells are displayed in the table below:

Meta Analysis of Goldfeld-Quandt test for Heteroskedasticity
Description# significant tests% significant testsOK/NOK
1% type I error level00OK
5% type I error level00OK
10% type I error level50.0980392OK


Parameters (Session):
par1 = 3 ; par2 = Do not include Seasonal Dummies ; par3 = No Linear Trend ;
Parameters (R input):
par1 = 3 ; par2 = Do not include Seasonal Dummies ; par3 = No Linear Trend ;
R code (references can be found in the software module):
library(lattice)
library(lmtest)
n25 <- 25 #minimum number of obs. for Goldfeld-Quandt test
par1 <- as.numeric(par1)
x <- t(y)
k <- length(x[1,])
n <- length(x[,1])
x1 <- cbind(x[,par1], x[,1:k!=par1])
mycolnames <- c(colnames(x)[par1], colnames(x)[1:k!=par1])
colnames(x1) <- mycolnames #colnames(x)[par1]
x <- x1
if (par3 == 'First Differences'){
x2 <- array(0, dim=c(n-1,k), dimnames=list(1:(n-1), paste('(1-B)',colnames(x),sep='')))
for (i in 1:n-1) {
for (j in 1:k) {
x2[i,j] <- x[i+1,j] - x[i,j]
}
}
x <- x2
}
if (par2 == 'Include Monthly Dummies'){
x2 <- array(0, dim=c(n,11), dimnames=list(1:n, paste('M', seq(1:11), sep ='')))
for (i in 1:11){
x2[seq(i,n,12),i] <- 1
}
x <- cbind(x, x2)
}
if (par2 == 'Include Quarterly Dummies'){
x2 <- array(0, dim=c(n,3), dimnames=list(1:n, paste('Q', seq(1:3), sep ='')))
for (i in 1:3){
x2[seq(i,n,4),i] <- 1
}
x <- cbind(x, x2)
}
k <- length(x[1,])
if (par3 == 'Linear Trend'){
x <- cbind(x, c(1:n))
colnames(x)[k+1] <- 't'
}
x
k <- length(x[1,])
df <- as.data.frame(x)
(mylm <- lm(df))
(mysum <- summary(mylm))
if (n > n25) {
kp3 <- k + 3
nmkm3 <- n - k - 3
gqarr <- array(NA, dim=c(nmkm3-kp3+1,3))
numgqtests <- 0
numsignificant1 <- 0
numsignificant5 <- 0
numsignificant10 <- 0
for (mypoint in kp3:nmkm3) {
j <- 0
numgqtests <- numgqtests + 1
for (myalt in c('greater', 'two.sided', 'less')) {
j <- j + 1
gqarr[mypoint-kp3+1,j] <- gqtest(mylm, point=mypoint, alternative=myalt)$p.value
}
if (gqarr[mypoint-kp3+1,2] < 0.01) numsignificant1 <- numsignificant1 + 1
if (gqarr[mypoint-kp3+1,2] < 0.05) numsignificant5 <- numsignificant5 + 1
if (gqarr[mypoint-kp3+1,2] < 0.10) numsignificant10 <- numsignificant10 + 1
}
gqarr
}
bitmap(file='test0.png')
plot(x[,1], type='l', main='Actuals and Interpolation', ylab='value of Actuals and Interpolation (dots)', xlab='time or index')
points(x[,1]-mysum$resid)
grid()
dev.off()
bitmap(file='test1.png')
plot(mysum$resid, type='b', pch=19, main='Residuals', ylab='value of Residuals', xlab='time or index')
grid()
dev.off()
bitmap(file='test2.png')
hist(mysum$resid, main='Residual Histogram', xlab='values of Residuals')
grid()
dev.off()
bitmap(file='test3.png')
densityplot(~mysum$resid,col='black',main='Residual Density Plot', xlab='values of Residuals')
dev.off()
bitmap(file='test4.png')
qqnorm(mysum$resid, main='Residual Normal Q-Q Plot')
qqline(mysum$resid)
grid()
dev.off()
(myerror <- as.ts(mysum$resid))
bitmap(file='test5.png')
dum <- cbind(lag(myerror,k=1),myerror)
dum
dum1 <- dum[2:length(myerror),]
dum1
z <- as.data.frame(dum1)
z
plot(z,main=paste('Residual Lag plot, lowess, and regression line'), ylab='values of Residuals', xlab='lagged values of Residuals')
lines(lowess(z))
abline(lm(z))
grid()
dev.off()
bitmap(file='test6.png')
acf(mysum$resid, lag.max=length(mysum$resid)/2, main='Residual Autocorrelation Function')
grid()
dev.off()
bitmap(file='test7.png')
pacf(mysum$resid, lag.max=length(mysum$resid)/2, main='Residual Partial Autocorrelation Function')
grid()
dev.off()
bitmap(file='test8.png')
opar <- par(mfrow = c(2,2), oma = c(0, 0, 1.1, 0))
plot(mylm, las = 1, sub='Residual Diagnostics')
par(opar)
dev.off()
if (n > n25) {
bitmap(file='test9.png')
plot(kp3:nmkm3,gqarr[,2], main='Goldfeld-Quandt test',ylab='2-sided p-value',xlab='breakpoint')
grid()
dev.off()
}
load(file='createtable')
a<-table.start()
a<-table.row.start(a)
a<-table.element(a, 'Multiple Linear Regression - Estimated Regression Equation', 1, TRUE)
a<-table.row.end(a)
myeq <- colnames(x)[1]
myeq <- paste(myeq, '[t] = ', sep='')
for (i in 1:k){
if (mysum$coefficients[i,1] > 0) myeq <- paste(myeq, '+', '')
myeq <- paste(myeq, signif(mysum$coefficients[i,1],6), sep=' ')
if (rownames(mysum$coefficients)[i] != '(Intercept)') {
myeq <- paste(myeq, rownames(mysum$coefficients)[i], sep='')
if (rownames(mysum$coefficients)[i] != 't') myeq <- paste(myeq, '[t]', sep='')
}
}
myeq <- paste(myeq, ' + e[t]')
a<-table.row.start(a)
a<-table.element(a, myeq)
a<-table.row.end(a)
a<-table.end(a)
table.save(a,file='mytable1.tab')
a<-table.start()
a<-table.row.start(a)
a<-table.element(a,hyperlink('ols1.htm','Multiple Linear Regression - Ordinary Least Squares',''), 6, TRUE)
a<-table.row.end(a)
a<-table.row.start(a)
a<-table.element(a,'Variable',header=TRUE)
a<-table.element(a,'Parameter',header=TRUE)
a<-table.element(a,'S.D.',header=TRUE)
a<-table.element(a,'T-STAT
H0: parameter = 0',header=TRUE)
a<-table.element(a,'2-tail p-value',header=TRUE)
a<-table.element(a,'1-tail p-value',header=TRUE)
a<-table.row.end(a)
for (i in 1:k){
a<-table.row.start(a)
a<-table.element(a,rownames(mysum$coefficients)[i],header=TRUE)
a<-table.element(a,signif(mysum$coefficients[i,1],6))
a<-table.element(a, signif(mysum$coefficients[i,2],6))
a<-table.element(a, signif(mysum$coefficients[i,3],4))
a<-table.element(a, signif(mysum$coefficients[i,4],6))
a<-table.element(a, signif(mysum$coefficients[i,4]/2,6))
a<-table.row.end(a)
}
a<-table.end(a)
table.save(a,file='mytable2.tab')
a<-table.start()
a<-table.row.start(a)
a<-table.element(a, 'Multiple Linear Regression - Regression Statistics', 2, TRUE)
a<-table.row.end(a)
a<-table.row.start(a)
a<-table.element(a, 'Multiple R',1,TRUE)
a<-table.element(a, signif(sqrt(mysum$r.squared),6))
a<-table.row.end(a)
a<-table.row.start(a)
a<-table.element(a, 'R-squared',1,TRUE)
a<-table.element(a, signif(mysum$r.squared,6))
a<-table.row.end(a)
a<-table.row.start(a)
a<-table.element(a, 'Adjusted R-squared',1,TRUE)
a<-table.element(a, signif(mysum$adj.r.squared,6))
a<-table.row.end(a)
a<-table.row.start(a)
a<-table.element(a, 'F-TEST (value)',1,TRUE)
a<-table.element(a, signif(mysum$fstatistic[1],6))
a<-table.row.end(a)
a<-table.row.start(a)
a<-table.element(a, 'F-TEST (DF numerator)',1,TRUE)
a<-table.element(a, signif(mysum$fstatistic[2],6))
a<-table.row.end(a)
a<-table.row.start(a)
a<-table.element(a, 'F-TEST (DF denominator)',1,TRUE)
a<-table.element(a, signif(mysum$fstatistic[3],6))
a<-table.row.end(a)
a<-table.row.start(a)
a<-table.element(a, 'p-value',1,TRUE)
a<-table.element(a, signif(1-pf(mysum$fstatistic[1],mysum$fstatistic[2],mysum$fstatistic[3]),6))
a<-table.row.end(a)
a<-table.row.start(a)
a<-table.element(a, 'Multiple Linear Regression - Residual Statistics', 2, TRUE)
a<-table.row.end(a)
a<-table.row.start(a)
a<-table.element(a, 'Residual Standard Deviation',1,TRUE)
a<-table.element(a, signif(mysum$sigma,6))
a<-table.row.end(a)
a<-table.row.start(a)
a<-table.element(a, 'Sum Squared Residuals',1,TRUE)
a<-table.element(a, signif(sum(myerror*myerror),6))
a<-table.row.end(a)
a<-table.end(a)
table.save(a,file='mytable3.tab')
a<-table.start()
a<-table.row.start(a)
a<-table.element(a, 'Multiple Linear Regression - Actuals, Interpolation, and Residuals', 4, TRUE)
a<-table.row.end(a)
a<-table.row.start(a)
a<-table.element(a, 'Time or Index', 1, TRUE)
a<-table.element(a, 'Actuals', 1, TRUE)
a<-table.element(a, 'Interpolation
Forecast', 1, TRUE)
a<-table.element(a, 'Residuals
Prediction Error', 1, TRUE)
a<-table.row.end(a)
for (i in 1:n) {
a<-table.row.start(a)
a<-table.element(a,i, 1, TRUE)
a<-table.element(a,signif(x[i],6))
a<-table.element(a,signif(x[i]-mysum$resid[i],6))
a<-table.element(a,signif(mysum$resid[i],6))
a<-table.row.end(a)
}
a<-table.end(a)
table.save(a,file='mytable4.tab')
if (n > n25) {
a<-table.start()
a<-table.row.start(a)
a<-table.element(a,'Goldfeld-Quandt test for Heteroskedasticity',4,TRUE)
a<-table.row.end(a)
a<-table.row.start(a)
a<-table.element(a,'p-values',header=TRUE)
a<-table.element(a,'Alternative Hypothesis',3,header=TRUE)
a<-table.row.end(a)
a<-table.row.start(a)
a<-table.element(a,'breakpoint index',header=TRUE)
a<-table.element(a,'greater',header=TRUE)
a<-table.element(a,'2-sided',header=TRUE)
a<-table.element(a,'less',header=TRUE)
a<-table.row.end(a)
for (mypoint in kp3:nmkm3) {
a<-table.row.start(a)
a<-table.element(a,mypoint,header=TRUE)
a<-table.element(a,signif(gqarr[mypoint-kp3+1,1],6))
a<-table.element(a,signif(gqarr[mypoint-kp3+1,2],6))
a<-table.element(a,signif(gqarr[mypoint-kp3+1,3],6))
a<-table.row.end(a)
}
a<-table.end(a)
table.save(a,file='mytable5.tab')
a<-table.start()
a<-table.row.start(a)
a<-table.element(a,'Meta Analysis of Goldfeld-Quandt test for Heteroskedasticity',4,TRUE)
a<-table.row.end(a)
a<-table.row.start(a)
a<-table.element(a,'Description',header=TRUE)
a<-table.element(a,'# significant tests',header=TRUE)
a<-table.element(a,'% significant tests',header=TRUE)
a<-table.element(a,'OK/NOK',header=TRUE)
a<-table.row.end(a)
a<-table.row.start(a)
a<-table.element(a,'1% type I error level',header=TRUE)
a<-table.element(a,signif(numsignificant1,6))
a<-table.element(a,signif(numsignificant1/numgqtests,6))
if (numsignificant1/numgqtests < 0.01) dum <- 'OK' else dum <- 'NOK'
a<-table.element(a,dum)
a<-table.row.end(a)
a<-table.row.start(a)
a<-table.element(a,'5% type I error level',header=TRUE)
a<-table.element(a,signif(numsignificant5,6))
a<-table.element(a,signif(numsignificant5/numgqtests,6))
if (numsignificant5/numgqtests < 0.05) dum <- 'OK' else dum <- 'NOK'
a<-table.element(a,dum)
a<-table.row.end(a)
a<-table.row.start(a)
a<-table.element(a,'10% type I error level',header=TRUE)
a<-table.element(a,signif(numsignificant10,6))
a<-table.element(a,signif(numsignificant10/numgqtests,6))
if (numsignificant10/numgqtests < 0.1) dum <- 'OK' else dum <- 'NOK'
a<-table.element(a,dum)
a<-table.row.end(a)
a<-table.end(a)
table.save(a,file='mytable6.tab')
}