Free Statistics

of Irreproducible Research!

Author's title

Author*Unverified author*
R Software Modulerwasp_autocorrelation.wasp
Title produced by software(Partial) Autocorrelation Function
Date of computationTue, 16 Dec 2014 15:32:00 +0000
Cite this page as followsStatistical Computations at FreeStatistics.org, Office for Research Development and Education, URL https://freestatistics.org/blog/index.php?v=date/2014/Dec/16/t14187444520jfu9lu730ap0ws.htm/, Retrieved Thu, 16 May 2024 23:33:04 +0000
Statistical Computations at FreeStatistics.org, Office for Research Development and Education, URL https://freestatistics.org/blog/index.php?pk=269753, Retrieved Thu, 16 May 2024 23:33:04 +0000
QR Codes:

Original text written by user:
IsPrivate?No (this computation is public)
User-defined keywords
Estimated Impact60
Family? (F = Feedback message, R = changed R code, M = changed R Module, P = changed Parameters, D = changed Data)
-     [(Partial) Autocorrelation Function] [] [2014-10-17 12:08:48] [b5b39717209e06ff52ecfc643c6cbf41]
- R PD    [(Partial) Autocorrelation Function] [] [2014-12-16 15:32:00] [f1a1c306ccf782003dcf1365fad9efec] [Current]
Feedback Forum

Post a new message
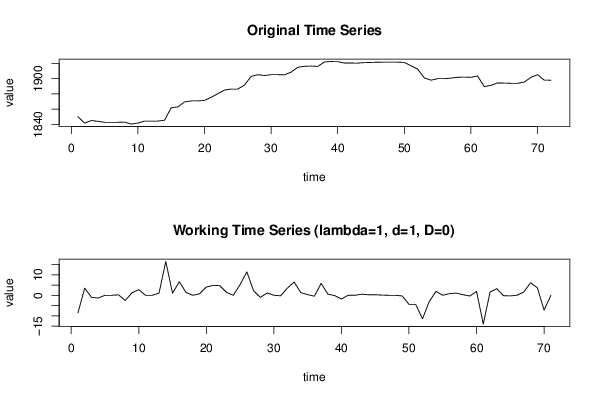
Dataseries X:
1850.07
1841.55
1845
1844.01
1842.67
1842.67
1842.67
1842.9
1840.37
1841.59
1844.33
1844.33
1844.33
1845.39
1861.84
1862.85
1869.46
1870.8
1870.8
1871.52
1875.52
1880.38
1885.05
1886.42
1886.42
1891.65
1903.11
1905.29
1904.26
1905.37
1905.37
1905.12
1908.62
1915.08
1916.36
1916.68
1916.24
1922.05
1922.63
1922.47
1920.64
1920.66
1920.66
1921.19
1921.44
1921.73
1921.81
1921.81
1921.81
1921.48
1917.07
1912.64
1901.15
1898.12
1900.02
1900.02
1900.82
1901.9
1902.19
1901.84
1903.73
1889.7
1891.27
1894.48
1894.27
1893.98
1893.98
1895.62
1901.72
1905.4
1898.14
1898.09


Summary of computational transaction
Raw Inputview raw input (R code)
Raw Outputview raw output of R engine
Computing time1 seconds
R Server'Gwilym Jenkins' @ jenkins.wessa.net

\begin{tabular}{lllllllll}
\hline
Summary of computational transaction \tabularnewline
Raw Input & view raw input (R code)  \tabularnewline
Raw Output & view raw output of R engine  \tabularnewline
Computing time & 1 seconds \tabularnewline
R Server & 'Gwilym Jenkins' @ jenkins.wessa.net \tabularnewline
\hline
\end{tabular}
%Source: https://freestatistics.org/blog/index.php?pk=269753&T=0

[TABLE]
[ROW][C]Summary of computational transaction[/C][/ROW]
[ROW][C]Raw Input[/C][C]view raw input (R code) [/C][/ROW]
[ROW][C]Raw Output[/C][C]view raw output of R engine [/C][/ROW]
[ROW][C]Computing time[/C][C]1 seconds[/C][/ROW]
[ROW][C]R Server[/C][C]'Gwilym Jenkins' @ jenkins.wessa.net[/C][/ROW]
[/TABLE]
Source: https://freestatistics.org/blog/index.php?pk=269753&T=0

Globally Unique Identifier (entire table): ba.freestatistics.org/blog/index.php?pk=269753&T=0

As an alternative you can also use a QR Code:  

The GUIDs for individual cells are displayed in the table below:

Summary of computational transaction
Raw Inputview raw input (R code)
Raw Outputview raw output of R engine
Computing time1 seconds
R Server'Gwilym Jenkins' @ jenkins.wessa.net


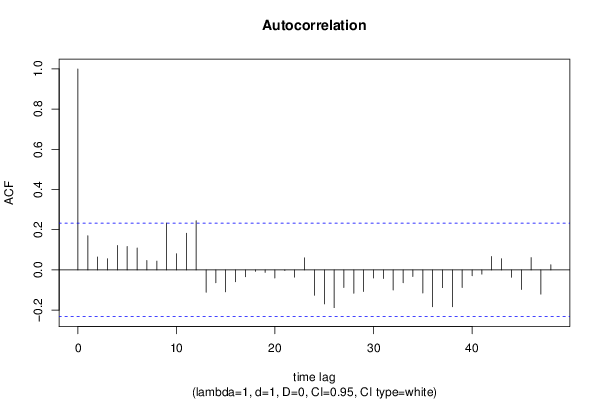
Autocorrelation Function
Time lag kACF(k)T-STATP-value
10.1698831.43150.078343
20.0638590.53810.2961
30.0555890.46840.320466
40.121711.02550.154293
50.1164130.98090.164982
60.1087680.91650.181255
70.0467610.3940.347375
80.0439030.36990.356266
90.2338871.97080.026325
100.0807210.68020.249306
110.1823011.53610.06448
120.2443062.05860.021604
13-0.110846-0.9340.176733
14-0.064229-0.54120.295031
15-0.109184-0.920.180343
16-0.059215-0.4990.309676
17-0.033857-0.28530.388129
18-0.007381-0.06220.475292
19-0.012295-0.10360.458891
20-0.040365-0.34010.367386
21-0.002997-0.02530.489962
22-0.035934-0.30280.38147
230.0598250.50410.307879
24-0.126263-1.06390.145487
25-0.169053-1.42450.079347
26-0.187865-1.5830.058936
27-0.087594-0.73810.23145
28-0.116256-0.97960.165307
29-0.107271-0.90390.184558
30-0.040297-0.33950.367601
31-0.042584-0.35880.360399
32-0.09961-0.83930.202052
33-0.063548-0.53550.297001
34-0.032757-0.2760.391668
35-0.114875-0.9680.168177
36-0.182963-1.54170.063799
37-0.088312-0.74410.229626
38-0.183042-1.54230.063719
39-0.087495-0.73720.2317
40-0.029419-0.24790.402469
41-0.021142-0.17810.429558
420.0667860.56270.28769
430.0554210.4670.320971
44-0.036421-0.30690.379914
45-0.097672-0.8230.206633
460.0612280.51590.303758
47-0.120628-1.01640.156437
480.025760.21710.414394

\begin{tabular}{lllllllll}
\hline
Autocorrelation Function \tabularnewline
Time lag k & ACF(k) & T-STAT & P-value \tabularnewline
1 & 0.169883 & 1.4315 & 0.078343 \tabularnewline
2 & 0.063859 & 0.5381 & 0.2961 \tabularnewline
3 & 0.055589 & 0.4684 & 0.320466 \tabularnewline
4 & 0.12171 & 1.0255 & 0.154293 \tabularnewline
5 & 0.116413 & 0.9809 & 0.164982 \tabularnewline
6 & 0.108768 & 0.9165 & 0.181255 \tabularnewline
7 & 0.046761 & 0.394 & 0.347375 \tabularnewline
8 & 0.043903 & 0.3699 & 0.356266 \tabularnewline
9 & 0.233887 & 1.9708 & 0.026325 \tabularnewline
10 & 0.080721 & 0.6802 & 0.249306 \tabularnewline
11 & 0.182301 & 1.5361 & 0.06448 \tabularnewline
12 & 0.244306 & 2.0586 & 0.021604 \tabularnewline
13 & -0.110846 & -0.934 & 0.176733 \tabularnewline
14 & -0.064229 & -0.5412 & 0.295031 \tabularnewline
15 & -0.109184 & -0.92 & 0.180343 \tabularnewline
16 & -0.059215 & -0.499 & 0.309676 \tabularnewline
17 & -0.033857 & -0.2853 & 0.388129 \tabularnewline
18 & -0.007381 & -0.0622 & 0.475292 \tabularnewline
19 & -0.012295 & -0.1036 & 0.458891 \tabularnewline
20 & -0.040365 & -0.3401 & 0.367386 \tabularnewline
21 & -0.002997 & -0.0253 & 0.489962 \tabularnewline
22 & -0.035934 & -0.3028 & 0.38147 \tabularnewline
23 & 0.059825 & 0.5041 & 0.307879 \tabularnewline
24 & -0.126263 & -1.0639 & 0.145487 \tabularnewline
25 & -0.169053 & -1.4245 & 0.079347 \tabularnewline
26 & -0.187865 & -1.583 & 0.058936 \tabularnewline
27 & -0.087594 & -0.7381 & 0.23145 \tabularnewline
28 & -0.116256 & -0.9796 & 0.165307 \tabularnewline
29 & -0.107271 & -0.9039 & 0.184558 \tabularnewline
30 & -0.040297 & -0.3395 & 0.367601 \tabularnewline
31 & -0.042584 & -0.3588 & 0.360399 \tabularnewline
32 & -0.09961 & -0.8393 & 0.202052 \tabularnewline
33 & -0.063548 & -0.5355 & 0.297001 \tabularnewline
34 & -0.032757 & -0.276 & 0.391668 \tabularnewline
35 & -0.114875 & -0.968 & 0.168177 \tabularnewline
36 & -0.182963 & -1.5417 & 0.063799 \tabularnewline
37 & -0.088312 & -0.7441 & 0.229626 \tabularnewline
38 & -0.183042 & -1.5423 & 0.063719 \tabularnewline
39 & -0.087495 & -0.7372 & 0.2317 \tabularnewline
40 & -0.029419 & -0.2479 & 0.402469 \tabularnewline
41 & -0.021142 & -0.1781 & 0.429558 \tabularnewline
42 & 0.066786 & 0.5627 & 0.28769 \tabularnewline
43 & 0.055421 & 0.467 & 0.320971 \tabularnewline
44 & -0.036421 & -0.3069 & 0.379914 \tabularnewline
45 & -0.097672 & -0.823 & 0.206633 \tabularnewline
46 & 0.061228 & 0.5159 & 0.303758 \tabularnewline
47 & -0.120628 & -1.0164 & 0.156437 \tabularnewline
48 & 0.02576 & 0.2171 & 0.414394 \tabularnewline
\hline
\end{tabular}
%Source: https://freestatistics.org/blog/index.php?pk=269753&T=1

[TABLE]
[ROW][C]Autocorrelation Function[/C][/ROW]
[ROW][C]Time lag k[/C][C]ACF(k)[/C][C]T-STAT[/C][C]P-value[/C][/ROW]
[ROW][C]1[/C][C]0.169883[/C][C]1.4315[/C][C]0.078343[/C][/ROW]
[ROW][C]2[/C][C]0.063859[/C][C]0.5381[/C][C]0.2961[/C][/ROW]
[ROW][C]3[/C][C]0.055589[/C][C]0.4684[/C][C]0.320466[/C][/ROW]
[ROW][C]4[/C][C]0.12171[/C][C]1.0255[/C][C]0.154293[/C][/ROW]
[ROW][C]5[/C][C]0.116413[/C][C]0.9809[/C][C]0.164982[/C][/ROW]
[ROW][C]6[/C][C]0.108768[/C][C]0.9165[/C][C]0.181255[/C][/ROW]
[ROW][C]7[/C][C]0.046761[/C][C]0.394[/C][C]0.347375[/C][/ROW]
[ROW][C]8[/C][C]0.043903[/C][C]0.3699[/C][C]0.356266[/C][/ROW]
[ROW][C]9[/C][C]0.233887[/C][C]1.9708[/C][C]0.026325[/C][/ROW]
[ROW][C]10[/C][C]0.080721[/C][C]0.6802[/C][C]0.249306[/C][/ROW]
[ROW][C]11[/C][C]0.182301[/C][C]1.5361[/C][C]0.06448[/C][/ROW]
[ROW][C]12[/C][C]0.244306[/C][C]2.0586[/C][C]0.021604[/C][/ROW]
[ROW][C]13[/C][C]-0.110846[/C][C]-0.934[/C][C]0.176733[/C][/ROW]
[ROW][C]14[/C][C]-0.064229[/C][C]-0.5412[/C][C]0.295031[/C][/ROW]
[ROW][C]15[/C][C]-0.109184[/C][C]-0.92[/C][C]0.180343[/C][/ROW]
[ROW][C]16[/C][C]-0.059215[/C][C]-0.499[/C][C]0.309676[/C][/ROW]
[ROW][C]17[/C][C]-0.033857[/C][C]-0.2853[/C][C]0.388129[/C][/ROW]
[ROW][C]18[/C][C]-0.007381[/C][C]-0.0622[/C][C]0.475292[/C][/ROW]
[ROW][C]19[/C][C]-0.012295[/C][C]-0.1036[/C][C]0.458891[/C][/ROW]
[ROW][C]20[/C][C]-0.040365[/C][C]-0.3401[/C][C]0.367386[/C][/ROW]
[ROW][C]21[/C][C]-0.002997[/C][C]-0.0253[/C][C]0.489962[/C][/ROW]
[ROW][C]22[/C][C]-0.035934[/C][C]-0.3028[/C][C]0.38147[/C][/ROW]
[ROW][C]23[/C][C]0.059825[/C][C]0.5041[/C][C]0.307879[/C][/ROW]
[ROW][C]24[/C][C]-0.126263[/C][C]-1.0639[/C][C]0.145487[/C][/ROW]
[ROW][C]25[/C][C]-0.169053[/C][C]-1.4245[/C][C]0.079347[/C][/ROW]
[ROW][C]26[/C][C]-0.187865[/C][C]-1.583[/C][C]0.058936[/C][/ROW]
[ROW][C]27[/C][C]-0.087594[/C][C]-0.7381[/C][C]0.23145[/C][/ROW]
[ROW][C]28[/C][C]-0.116256[/C][C]-0.9796[/C][C]0.165307[/C][/ROW]
[ROW][C]29[/C][C]-0.107271[/C][C]-0.9039[/C][C]0.184558[/C][/ROW]
[ROW][C]30[/C][C]-0.040297[/C][C]-0.3395[/C][C]0.367601[/C][/ROW]
[ROW][C]31[/C][C]-0.042584[/C][C]-0.3588[/C][C]0.360399[/C][/ROW]
[ROW][C]32[/C][C]-0.09961[/C][C]-0.8393[/C][C]0.202052[/C][/ROW]
[ROW][C]33[/C][C]-0.063548[/C][C]-0.5355[/C][C]0.297001[/C][/ROW]
[ROW][C]34[/C][C]-0.032757[/C][C]-0.276[/C][C]0.391668[/C][/ROW]
[ROW][C]35[/C][C]-0.114875[/C][C]-0.968[/C][C]0.168177[/C][/ROW]
[ROW][C]36[/C][C]-0.182963[/C][C]-1.5417[/C][C]0.063799[/C][/ROW]
[ROW][C]37[/C][C]-0.088312[/C][C]-0.7441[/C][C]0.229626[/C][/ROW]
[ROW][C]38[/C][C]-0.183042[/C][C]-1.5423[/C][C]0.063719[/C][/ROW]
[ROW][C]39[/C][C]-0.087495[/C][C]-0.7372[/C][C]0.2317[/C][/ROW]
[ROW][C]40[/C][C]-0.029419[/C][C]-0.2479[/C][C]0.402469[/C][/ROW]
[ROW][C]41[/C][C]-0.021142[/C][C]-0.1781[/C][C]0.429558[/C][/ROW]
[ROW][C]42[/C][C]0.066786[/C][C]0.5627[/C][C]0.28769[/C][/ROW]
[ROW][C]43[/C][C]0.055421[/C][C]0.467[/C][C]0.320971[/C][/ROW]
[ROW][C]44[/C][C]-0.036421[/C][C]-0.3069[/C][C]0.379914[/C][/ROW]
[ROW][C]45[/C][C]-0.097672[/C][C]-0.823[/C][C]0.206633[/C][/ROW]
[ROW][C]46[/C][C]0.061228[/C][C]0.5159[/C][C]0.303758[/C][/ROW]
[ROW][C]47[/C][C]-0.120628[/C][C]-1.0164[/C][C]0.156437[/C][/ROW]
[ROW][C]48[/C][C]0.02576[/C][C]0.2171[/C][C]0.414394[/C][/ROW]
[/TABLE]
Source: https://freestatistics.org/blog/index.php?pk=269753&T=1

Globally Unique Identifier (entire table): ba.freestatistics.org/blog/index.php?pk=269753&T=1

As an alternative you can also use a QR Code:  

The GUIDs for individual cells are displayed in the table below:

Autocorrelation Function
Time lag kACF(k)T-STATP-value
10.1698831.43150.078343
20.0638590.53810.2961
30.0555890.46840.320466
40.121711.02550.154293
50.1164130.98090.164982
60.1087680.91650.181255
70.0467610.3940.347375
80.0439030.36990.356266
90.2338871.97080.026325
100.0807210.68020.249306
110.1823011.53610.06448
120.2443062.05860.021604
13-0.110846-0.9340.176733
14-0.064229-0.54120.295031
15-0.109184-0.920.180343
16-0.059215-0.4990.309676
17-0.033857-0.28530.388129
18-0.007381-0.06220.475292
19-0.012295-0.10360.458891
20-0.040365-0.34010.367386
21-0.002997-0.02530.489962
22-0.035934-0.30280.38147
230.0598250.50410.307879
24-0.126263-1.06390.145487
25-0.169053-1.42450.079347
26-0.187865-1.5830.058936
27-0.087594-0.73810.23145
28-0.116256-0.97960.165307
29-0.107271-0.90390.184558
30-0.040297-0.33950.367601
31-0.042584-0.35880.360399
32-0.09961-0.83930.202052
33-0.063548-0.53550.297001
34-0.032757-0.2760.391668
35-0.114875-0.9680.168177
36-0.182963-1.54170.063799
37-0.088312-0.74410.229626
38-0.183042-1.54230.063719
39-0.087495-0.73720.2317
40-0.029419-0.24790.402469
41-0.021142-0.17810.429558
420.0667860.56270.28769
430.0554210.4670.320971
44-0.036421-0.30690.379914
45-0.097672-0.8230.206633
460.0612280.51590.303758
47-0.120628-1.01640.156437
480.025760.21710.414394


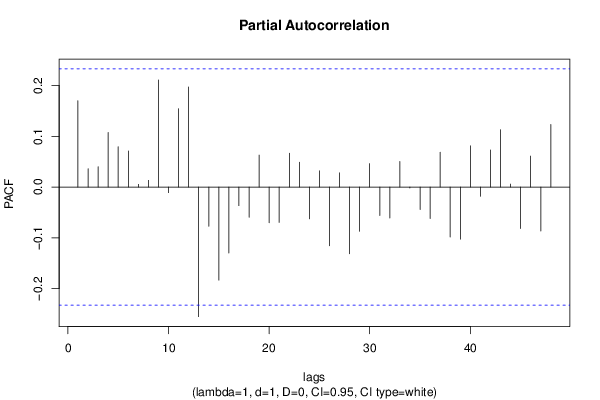
Partial Autocorrelation Function
Time lag kPACF(k)T-STATP-value
10.1698831.43150.078343
20.0360390.30370.381134
30.0402210.33890.36784
40.1073760.90480.184324
50.079430.66930.252742
60.0711680.59970.275316
70.0053430.0450.482107
80.0133020.11210.455535
90.2108631.77680.039946
10-0.010986-0.09260.463252
110.1541741.29910.099058
120.1972091.66170.05049
13-0.255112-2.14960.017497
14-0.077031-0.64910.259192
15-0.183253-1.54410.063502
16-0.129857-1.09420.138783
17-0.03652-0.30770.379597
18-0.059474-0.50110.308913
190.0629410.53030.298763
20-0.070213-0.59160.27799
21-0.069473-0.58540.280071
220.0666890.56190.287967
230.0490050.41290.340453
24-0.06255-0.52710.299898
250.0319380.26910.394312
26-0.115671-0.97470.166519
270.0280490.23630.406924
28-0.131157-1.10510.136414
29-0.087006-0.73310.232947
300.0462590.38980.348931
31-0.055923-0.47120.319466
32-0.060962-0.51370.304536
330.0502850.42370.336529
34-0.001966-0.01660.493415
35-0.044093-0.37150.355672
36-0.061716-0.520.302332
370.0687220.57910.282189
38-0.098435-0.82940.20482
39-0.10247-0.86340.195405
400.0811170.68350.248257
41-0.017944-0.15120.440125
420.0731060.6160.269932
430.1129870.9520.172151
440.0058470.04930.480422
45-0.081437-0.68620.24741
460.0609390.51350.304605
47-0.086384-0.72790.23454
480.1231811.03790.15141

\begin{tabular}{lllllllll}
\hline
Partial Autocorrelation Function \tabularnewline
Time lag k & PACF(k) & T-STAT & P-value \tabularnewline
1 & 0.169883 & 1.4315 & 0.078343 \tabularnewline
2 & 0.036039 & 0.3037 & 0.381134 \tabularnewline
3 & 0.040221 & 0.3389 & 0.36784 \tabularnewline
4 & 0.107376 & 0.9048 & 0.184324 \tabularnewline
5 & 0.07943 & 0.6693 & 0.252742 \tabularnewline
6 & 0.071168 & 0.5997 & 0.275316 \tabularnewline
7 & 0.005343 & 0.045 & 0.482107 \tabularnewline
8 & 0.013302 & 0.1121 & 0.455535 \tabularnewline
9 & 0.210863 & 1.7768 & 0.039946 \tabularnewline
10 & -0.010986 & -0.0926 & 0.463252 \tabularnewline
11 & 0.154174 & 1.2991 & 0.099058 \tabularnewline
12 & 0.197209 & 1.6617 & 0.05049 \tabularnewline
13 & -0.255112 & -2.1496 & 0.017497 \tabularnewline
14 & -0.077031 & -0.6491 & 0.259192 \tabularnewline
15 & -0.183253 & -1.5441 & 0.063502 \tabularnewline
16 & -0.129857 & -1.0942 & 0.138783 \tabularnewline
17 & -0.03652 & -0.3077 & 0.379597 \tabularnewline
18 & -0.059474 & -0.5011 & 0.308913 \tabularnewline
19 & 0.062941 & 0.5303 & 0.298763 \tabularnewline
20 & -0.070213 & -0.5916 & 0.27799 \tabularnewline
21 & -0.069473 & -0.5854 & 0.280071 \tabularnewline
22 & 0.066689 & 0.5619 & 0.287967 \tabularnewline
23 & 0.049005 & 0.4129 & 0.340453 \tabularnewline
24 & -0.06255 & -0.5271 & 0.299898 \tabularnewline
25 & 0.031938 & 0.2691 & 0.394312 \tabularnewline
26 & -0.115671 & -0.9747 & 0.166519 \tabularnewline
27 & 0.028049 & 0.2363 & 0.406924 \tabularnewline
28 & -0.131157 & -1.1051 & 0.136414 \tabularnewline
29 & -0.087006 & -0.7331 & 0.232947 \tabularnewline
30 & 0.046259 & 0.3898 & 0.348931 \tabularnewline
31 & -0.055923 & -0.4712 & 0.319466 \tabularnewline
32 & -0.060962 & -0.5137 & 0.304536 \tabularnewline
33 & 0.050285 & 0.4237 & 0.336529 \tabularnewline
34 & -0.001966 & -0.0166 & 0.493415 \tabularnewline
35 & -0.044093 & -0.3715 & 0.355672 \tabularnewline
36 & -0.061716 & -0.52 & 0.302332 \tabularnewline
37 & 0.068722 & 0.5791 & 0.282189 \tabularnewline
38 & -0.098435 & -0.8294 & 0.20482 \tabularnewline
39 & -0.10247 & -0.8634 & 0.195405 \tabularnewline
40 & 0.081117 & 0.6835 & 0.248257 \tabularnewline
41 & -0.017944 & -0.1512 & 0.440125 \tabularnewline
42 & 0.073106 & 0.616 & 0.269932 \tabularnewline
43 & 0.112987 & 0.952 & 0.172151 \tabularnewline
44 & 0.005847 & 0.0493 & 0.480422 \tabularnewline
45 & -0.081437 & -0.6862 & 0.24741 \tabularnewline
46 & 0.060939 & 0.5135 & 0.304605 \tabularnewline
47 & -0.086384 & -0.7279 & 0.23454 \tabularnewline
48 & 0.123181 & 1.0379 & 0.15141 \tabularnewline
\hline
\end{tabular}
%Source: https://freestatistics.org/blog/index.php?pk=269753&T=2

[TABLE]
[ROW][C]Partial Autocorrelation Function[/C][/ROW]
[ROW][C]Time lag k[/C][C]PACF(k)[/C][C]T-STAT[/C][C]P-value[/C][/ROW]
[ROW][C]1[/C][C]0.169883[/C][C]1.4315[/C][C]0.078343[/C][/ROW]
[ROW][C]2[/C][C]0.036039[/C][C]0.3037[/C][C]0.381134[/C][/ROW]
[ROW][C]3[/C][C]0.040221[/C][C]0.3389[/C][C]0.36784[/C][/ROW]
[ROW][C]4[/C][C]0.107376[/C][C]0.9048[/C][C]0.184324[/C][/ROW]
[ROW][C]5[/C][C]0.07943[/C][C]0.6693[/C][C]0.252742[/C][/ROW]
[ROW][C]6[/C][C]0.071168[/C][C]0.5997[/C][C]0.275316[/C][/ROW]
[ROW][C]7[/C][C]0.005343[/C][C]0.045[/C][C]0.482107[/C][/ROW]
[ROW][C]8[/C][C]0.013302[/C][C]0.1121[/C][C]0.455535[/C][/ROW]
[ROW][C]9[/C][C]0.210863[/C][C]1.7768[/C][C]0.039946[/C][/ROW]
[ROW][C]10[/C][C]-0.010986[/C][C]-0.0926[/C][C]0.463252[/C][/ROW]
[ROW][C]11[/C][C]0.154174[/C][C]1.2991[/C][C]0.099058[/C][/ROW]
[ROW][C]12[/C][C]0.197209[/C][C]1.6617[/C][C]0.05049[/C][/ROW]
[ROW][C]13[/C][C]-0.255112[/C][C]-2.1496[/C][C]0.017497[/C][/ROW]
[ROW][C]14[/C][C]-0.077031[/C][C]-0.6491[/C][C]0.259192[/C][/ROW]
[ROW][C]15[/C][C]-0.183253[/C][C]-1.5441[/C][C]0.063502[/C][/ROW]
[ROW][C]16[/C][C]-0.129857[/C][C]-1.0942[/C][C]0.138783[/C][/ROW]
[ROW][C]17[/C][C]-0.03652[/C][C]-0.3077[/C][C]0.379597[/C][/ROW]
[ROW][C]18[/C][C]-0.059474[/C][C]-0.5011[/C][C]0.308913[/C][/ROW]
[ROW][C]19[/C][C]0.062941[/C][C]0.5303[/C][C]0.298763[/C][/ROW]
[ROW][C]20[/C][C]-0.070213[/C][C]-0.5916[/C][C]0.27799[/C][/ROW]
[ROW][C]21[/C][C]-0.069473[/C][C]-0.5854[/C][C]0.280071[/C][/ROW]
[ROW][C]22[/C][C]0.066689[/C][C]0.5619[/C][C]0.287967[/C][/ROW]
[ROW][C]23[/C][C]0.049005[/C][C]0.4129[/C][C]0.340453[/C][/ROW]
[ROW][C]24[/C][C]-0.06255[/C][C]-0.5271[/C][C]0.299898[/C][/ROW]
[ROW][C]25[/C][C]0.031938[/C][C]0.2691[/C][C]0.394312[/C][/ROW]
[ROW][C]26[/C][C]-0.115671[/C][C]-0.9747[/C][C]0.166519[/C][/ROW]
[ROW][C]27[/C][C]0.028049[/C][C]0.2363[/C][C]0.406924[/C][/ROW]
[ROW][C]28[/C][C]-0.131157[/C][C]-1.1051[/C][C]0.136414[/C][/ROW]
[ROW][C]29[/C][C]-0.087006[/C][C]-0.7331[/C][C]0.232947[/C][/ROW]
[ROW][C]30[/C][C]0.046259[/C][C]0.3898[/C][C]0.348931[/C][/ROW]
[ROW][C]31[/C][C]-0.055923[/C][C]-0.4712[/C][C]0.319466[/C][/ROW]
[ROW][C]32[/C][C]-0.060962[/C][C]-0.5137[/C][C]0.304536[/C][/ROW]
[ROW][C]33[/C][C]0.050285[/C][C]0.4237[/C][C]0.336529[/C][/ROW]
[ROW][C]34[/C][C]-0.001966[/C][C]-0.0166[/C][C]0.493415[/C][/ROW]
[ROW][C]35[/C][C]-0.044093[/C][C]-0.3715[/C][C]0.355672[/C][/ROW]
[ROW][C]36[/C][C]-0.061716[/C][C]-0.52[/C][C]0.302332[/C][/ROW]
[ROW][C]37[/C][C]0.068722[/C][C]0.5791[/C][C]0.282189[/C][/ROW]
[ROW][C]38[/C][C]-0.098435[/C][C]-0.8294[/C][C]0.20482[/C][/ROW]
[ROW][C]39[/C][C]-0.10247[/C][C]-0.8634[/C][C]0.195405[/C][/ROW]
[ROW][C]40[/C][C]0.081117[/C][C]0.6835[/C][C]0.248257[/C][/ROW]
[ROW][C]41[/C][C]-0.017944[/C][C]-0.1512[/C][C]0.440125[/C][/ROW]
[ROW][C]42[/C][C]0.073106[/C][C]0.616[/C][C]0.269932[/C][/ROW]
[ROW][C]43[/C][C]0.112987[/C][C]0.952[/C][C]0.172151[/C][/ROW]
[ROW][C]44[/C][C]0.005847[/C][C]0.0493[/C][C]0.480422[/C][/ROW]
[ROW][C]45[/C][C]-0.081437[/C][C]-0.6862[/C][C]0.24741[/C][/ROW]
[ROW][C]46[/C][C]0.060939[/C][C]0.5135[/C][C]0.304605[/C][/ROW]
[ROW][C]47[/C][C]-0.086384[/C][C]-0.7279[/C][C]0.23454[/C][/ROW]
[ROW][C]48[/C][C]0.123181[/C][C]1.0379[/C][C]0.15141[/C][/ROW]
[/TABLE]
Source: https://freestatistics.org/blog/index.php?pk=269753&T=2

Globally Unique Identifier (entire table): ba.freestatistics.org/blog/index.php?pk=269753&T=2

As an alternative you can also use a QR Code:  

The GUIDs for individual cells are displayed in the table below:

Partial Autocorrelation Function
Time lag kPACF(k)T-STATP-value
10.1698831.43150.078343
20.0360390.30370.381134
30.0402210.33890.36784
40.1073760.90480.184324
50.079430.66930.252742
60.0711680.59970.275316
70.0053430.0450.482107
80.0133020.11210.455535
90.2108631.77680.039946
10-0.010986-0.09260.463252
110.1541741.29910.099058
120.1972091.66170.05049
13-0.255112-2.14960.017497
14-0.077031-0.64910.259192
15-0.183253-1.54410.063502
16-0.129857-1.09420.138783
17-0.03652-0.30770.379597
18-0.059474-0.50110.308913
190.0629410.53030.298763
20-0.070213-0.59160.27799
21-0.069473-0.58540.280071
220.0666890.56190.287967
230.0490050.41290.340453
24-0.06255-0.52710.299898
250.0319380.26910.394312
26-0.115671-0.97470.166519
270.0280490.23630.406924
28-0.131157-1.10510.136414
29-0.087006-0.73310.232947
300.0462590.38980.348931
31-0.055923-0.47120.319466
32-0.060962-0.51370.304536
330.0502850.42370.336529
34-0.001966-0.01660.493415
35-0.044093-0.37150.355672
36-0.061716-0.520.302332
370.0687220.57910.282189
38-0.098435-0.82940.20482
39-0.10247-0.86340.195405
400.0811170.68350.248257
41-0.017944-0.15120.440125
420.0731060.6160.269932
430.1129870.9520.172151
440.0058470.04930.480422
45-0.081437-0.68620.24741
460.0609390.51350.304605
47-0.086384-0.72790.23454
480.1231811.03790.15141


Parameters (Session):
par1 = 48 ; par2 = 1 ; par3 = 1 ; par4 = 0 ; par5 = 12 ; par6 = White Noise ; par7 = 0.95 ;
Parameters (R input):
par1 = 48 ; par2 = 1 ; par3 = 1 ; par4 = 0 ; par5 = 12 ; par6 = White Noise ; par7 = 0.95 ; par8 = ;
R code (references can be found in the software module):
par8 <- ''
par7 <- '0.95'
par6 <- 'White Noise'
par5 <- '12'
par4 <- '0'
par3 <- '0'
par2 <- '1'
par1 <- '48'
if (par1 == 'Default') {
par1 = 10*log10(length(x))
} else {
par1 <- as.numeric(par1)
}
par2 <- as.numeric(par2)
par3 <- as.numeric(par3)
par4 <- as.numeric(par4)
par5 <- as.numeric(par5)
if (par6 == 'White Noise') par6 <- 'white' else par6 <- 'ma'
par7 <- as.numeric(par7)
if (par8 != '') par8 <- as.numeric(par8)
ox <- x
if (par8 == '') {
if (par2 == 0) {
x <- log(x)
} else {
x <- (x ^ par2 - 1) / par2
}
} else {
x <- log(x,base=par8)
}
if (par3 > 0) x <- diff(x,lag=1,difference=par3)
if (par4 > 0) x <- diff(x,lag=par5,difference=par4)
bitmap(file='picts.png')
op <- par(mfrow=c(2,1))
plot(ox,type='l',main='Original Time Series',xlab='time',ylab='value')
if (par8=='') {
mytitle <- paste('Working Time Series (lambda=',par2,', d=',par3,', D=',par4,')',sep='')
mysub <- paste('(lambda=',par2,', d=',par3,', D=',par4,', CI=', par7, ', CI type=',par6,')',sep='')
} else {
mytitle <- paste('Working Time Series (base=',par8,', d=',par3,', D=',par4,')',sep='')
mysub <- paste('(base=',par8,', d=',par3,', D=',par4,', CI=', par7, ', CI type=',par6,')',sep='')
}
plot(x,type='l', main=mytitle,xlab='time',ylab='value')
par(op)
dev.off()
bitmap(file='pic1.png')
racf <- acf(x, par1, main='Autocorrelation', xlab='time lag', ylab='ACF', ci.type=par6, ci=par7, sub=mysub)
dev.off()
bitmap(file='pic2.png')
rpacf <- pacf(x,par1,main='Partial Autocorrelation',xlab='lags',ylab='PACF',sub=mysub)
dev.off()
(myacf <- c(racf$acf))
(mypacf <- c(rpacf$acf))
lengthx <- length(x)
sqrtn <- sqrt(lengthx)
load(file='createtable')
a<-table.start()
a<-table.row.start(a)
a<-table.element(a,'Autocorrelation Function',4,TRUE)
a<-table.row.end(a)
a<-table.row.start(a)
a<-table.element(a,'Time lag k',header=TRUE)
a<-table.element(a,hyperlink('basics.htm','ACF(k)','click here for more information about the Autocorrelation Function'),header=TRUE)
a<-table.element(a,'T-STAT',header=TRUE)
a<-table.element(a,'P-value',header=TRUE)
a<-table.row.end(a)
for (i in 2:(par1+1)) {
a<-table.row.start(a)
a<-table.element(a,i-1,header=TRUE)
a<-table.element(a,round(myacf[i],6))
mytstat <- myacf[i]*sqrtn
a<-table.element(a,round(mytstat,4))
a<-table.element(a,round(1-pt(abs(mytstat),lengthx),6))
a<-table.row.end(a)
}
a<-table.end(a)
table.save(a,file='mytable.tab')
a<-table.start()
a<-table.row.start(a)
a<-table.element(a,'Partial Autocorrelation Function',4,TRUE)
a<-table.row.end(a)
a<-table.row.start(a)
a<-table.element(a,'Time lag k',header=TRUE)
a<-table.element(a,hyperlink('basics.htm','PACF(k)','click here for more information about the Partial Autocorrelation Function'),header=TRUE)
a<-table.element(a,'T-STAT',header=TRUE)
a<-table.element(a,'P-value',header=TRUE)
a<-table.row.end(a)
for (i in 1:par1) {
a<-table.row.start(a)
a<-table.element(a,i,header=TRUE)
a<-table.element(a,round(mypacf[i],6))
mytstat <- mypacf[i]*sqrtn
a<-table.element(a,round(mytstat,4))
a<-table.element(a,round(1-pt(abs(mytstat),lengthx),6))
a<-table.row.end(a)
}
a<-table.end(a)
table.save(a,file='mytable1.tab')