Free Statistics
of Irreproducible Research!
Description of Statistical Computation | |||||||||||||||||||||||||||||||||||||||
|---|---|---|---|---|---|---|---|---|---|---|---|---|---|---|---|---|---|---|---|---|---|---|---|---|---|---|---|---|---|---|---|---|---|---|---|---|---|---|---|
| Author's title | |||||||||||||||||||||||||||||||||||||||
| Author | *The author of this computation has been verified* | ||||||||||||||||||||||||||||||||||||||
| R Software Module | rwasp_fitdistrnorm.wasp | ||||||||||||||||||||||||||||||||||||||
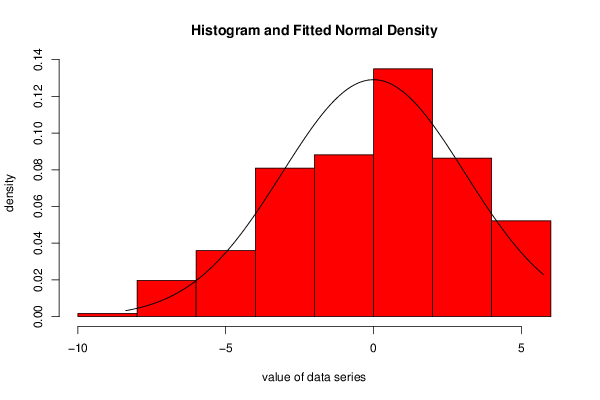
| Title produced by software | Maximum-likelihood Fitting - Normal Distribution | ||||||||||||||||||||||||||||||||||||||
| Date of computation | Tue, 16 Dec 2014 16:16:32 +0000 | ||||||||||||||||||||||||||||||||||||||
| Cite this page as follows | Statistical Computations at FreeStatistics.org, Office for Research Development and Education, URL https://freestatistics.org/blog/index.php?v=date/2014/Dec/16/t1418746604m7pt0wbr6qhgl0f.htm/, Retrieved Thu, 16 May 2024 18:42:43 +0000 | ||||||||||||||||||||||||||||||||||||||
| Statistical Computations at FreeStatistics.org, Office for Research Development and Education, URL https://freestatistics.org/blog/index.php?pk=269805, Retrieved Thu, 16 May 2024 18:42:43 +0000 | |||||||||||||||||||||||||||||||||||||||
| QR Codes: | |||||||||||||||||||||||||||||||||||||||
|
| |||||||||||||||||||||||||||||||||||||||
| Original text written by user: | |||||||||||||||||||||||||||||||||||||||
| IsPrivate? | No (this computation is public) | ||||||||||||||||||||||||||||||||||||||
| User-defined keywords | |||||||||||||||||||||||||||||||||||||||
| Estimated Impact | 81 | ||||||||||||||||||||||||||||||||||||||
Tree of Dependent Computations | |||||||||||||||||||||||||||||||||||||||
| Family? (F = Feedback message, R = changed R code, M = changed R Module, P = changed Parameters, D = changed Data) | |||||||||||||||||||||||||||||||||||||||
| - [Maximum-likelihood Fitting - Normal Distribution] [Intrinsic Motivat...] [2010-10-12 11:57:21] [b98453cac15ba1066b407e146608df68] - RMP [Maximum-likelihood Fitting - Normal Distribution] [] [2014-10-14 18:01:50] [32b17a345b130fdf5cc88718ed94a974] - D [Maximum-likelihood Fitting - Normal Distribution] [Histogram] [2014-12-13 12:53:13] [f12bfb29749f0c3f544bf278d0782c85] - D [Maximum-likelihood Fitting - Normal Distribution] [] [2014-12-16 16:16:32] [5848e943dc403117a4a7bf00dc78acfc] [Current] | |||||||||||||||||||||||||||||||||||||||
| Feedback Forum | |||||||||||||||||||||||||||||||||||||||
Post a new message | |||||||||||||||||||||||||||||||||||||||
Dataset | |||||||||||||||||||||||||||||||||||||||
| Dataseries X: | |||||||||||||||||||||||||||||||||||||||
-2,44495 -1,16038 -0,60693 -7,05026 -6,48043 -2,53846 0,480307 -1,81602 -3,5781 -6,5739 -2,59754 -8,38308 -1,30838 -3,39781 -4,2749 -0,533569 -2,94169 -3,29023 -3,91867 -2,64762 -5,92087 1,27741 -3,66243 -1,36758 -2,32758 -5,42781 0,813972 0,577655 -4,53862 -1,55758 -4,27982 -1,98905 -3,58331 -4,23511 -1,79133 -2,0139 -2,78755 0,497376 -5,15182 -1,89245 -6,99434 -2,14226 -1,17065 -2,73472 0,62781 -2,96209 -2,00383 -4,59142 -0,141758 1,16158 -0,756651 -4,43327 -2,17543 -0,523044 -0,126924 -2,37404 -6,32748 1,03744 -2,2701 0,365162 -6,06374 0,237082 -4,59059 0,358888 -4,83602 -2,41242 -3,78637 -4,57844 1,16707 -0,269101 -2,58362 -1,15655 -3,89457 0,550525 -0,546752 -1,43065 0,25285 -1,42454 -1,58633 -5,42368 -1,81187 1,36136 -1,66961 -7,35486 -3,18914 -2,23094 -0,765955 0,622673 -3,23026 0,660384 0,635742 -6,5155 -4,2161 -2,87222 -4,19501 -2,84805 -5,4417 0,0594222 1,99465 -4,4413 -1,12946 -1,64422 -3,28457 -3,31468 1,66916 -4,03799 1,15479 -6,93766 -4,64612 -3,38979 -0,571597 -0,406872 -6,74431 0,286642 4,93156 4,6665 0,053712 1,50608 1,1955 3,84174 -2,55022 2,71681 3,53361 4,49698 -1,96913 0,523129 3,12017 0,00236798 4,63572 2,27575 2,46437 0,696264 2,41944 1,72816 0,704122 -0,13633 4,75351 -2,05799 3,75277 0,938164 -0,0993215 5,67783 0,986981 4,90236 2,50432 2,26947 0,184141 1,12572 1,0956 4,45421 -3,04871 1,28708 4,55291 2,77879 2,96905 0,228428 3,01566 2,97218 -0,0879362 -0,205283 3,8451 3,46573 2,01648 5,45284 3,87444 0,288623 4,48667 4,10826 2,04702 -1,81245 3,18827 4,5255 0,81333 1,98147 2,06674 4,4046 -0,701673 5,38317 1,36839 -3,11701 -1,36277 0,711947 4,68116 2,03938 -0,0429516 2,37285 5,41973 0,558481 1,14327 0,904081 -1,18012 2,15605 -2,17335 5,40277 1,24869 1,67037 0,773512 1,32753 3,38028 3,12494 2,13066 1,36483 0,611084 3,01358 1,54191 3,53495 -1,74096 0,825083 4,53069 3,45209 -0,420339 2,67689 -1,57792 2,06041 1,82527 -0,521428 2,8814 4,83123 -0,635476 2,24849 5,25721 -3,30466 0,61118 4,1699 5,28519 3,91833 4,80242 3,84884 3,7055 5,62694 5,74466 3,44894 1,83213 0,249697 -2,11049 -6,58651 1,57779 0,337516 -2,03739 0,666342 0,0836842 0,0480069 2,58015 4,31689 -0,453489 1,69858 2,0102 1,71785 2,06868 1,12502 0,165255 -0,994904 1,70827 1,56879 -0,224132 3,08975 -3,11908 -3,54644 -0,540604 -5,2376 -0,444241 0,42942 -2,68138 2,56004 3,88497 0,996637 1,85048 3,88073 4,04711 -0,457924 3,8767 1,27432 2,01152 4,00201 1,86748 1,77321 3,47481 -2,31342 | |||||||||||||||||||||||||||||||||||||||
Tables (Output of Computation) | |||||||||||||||||||||||||||||||||||||||
| |||||||||||||||||||||||||||||||||||||||
Figures (Output of Computation) | |||||||||||||||||||||||||||||||||||||||
Input Parameters & R Code | |||||||||||||||||||||||||||||||||||||||
| Parameters (Session): | |||||||||||||||||||||||||||||||||||||||
| par1 = 2 ; par2 = 0 ; | |||||||||||||||||||||||||||||||||||||||
| Parameters (R input): | |||||||||||||||||||||||||||||||||||||||
| par1 = 2 ; par2 = 0 ; | |||||||||||||||||||||||||||||||||||||||
| R code (references can be found in the software module): | |||||||||||||||||||||||||||||||||||||||
library(MASS) | |||||||||||||||||||||||||||||||||||||||