Free Statistics

of Irreproducible Research!

Author's title

Author*The author of this computation has been verified*
R Software Modulerwasp_twosampletests_mean.wasp
Title produced by softwarePaired and Unpaired Two Samples Tests about the Mean
Date of computationWed, 17 Dec 2014 11:50:35 +0000
Cite this page as followsStatistical Computations at FreeStatistics.org, Office for Research Development and Education, URL https://freestatistics.org/blog/index.php?v=date/2014/Dec/17/t1418817620fs3qecg8468k6hq.htm/, Retrieved Thu, 16 May 2024 17:40:49 +0000
Statistical Computations at FreeStatistics.org, Office for Research Development and Education, URL https://freestatistics.org/blog/index.php?pk=270095, Retrieved Thu, 16 May 2024 17:40:49 +0000
QR Codes:

Original text written by user:
IsPrivate?No (this computation is public)
User-defined keywords
Estimated Impact59
Family? (F = Feedback message, R = changed R code, M = changed R Module, P = changed Parameters, D = changed Data)
-       [Paired and Unpaired Two Samples Tests about the Mean] [Two sample T-Test] [2014-12-17 11:50:35] [ca907db95fc0b179b22bb0898c34dff4] [Current]
Feedback Forum

Post a new message
Dataseries X:
109.864 40.651
109.832 40.437
109.909 40.358
109.957 40.294
109.994 40.224
110.019 40.157
110.038 40.089
110.065 40.019
110.085 39.967
110.113 39.914
110.141 39.852
110.177 39.789
110.214 39.731
110.245 39.671
110.270 39.603
110.266 39.532
110.263 39.467
110.274 39.400
110.263 39.338
110.267 39.282
110.271 39.225
110.268 39.157
110.280 39.120
110.301 39.081
110.322 39.041
110.336 39.000
110.342 38.957
110.339 38.913
110.345 38.867
110.360 38.829
110.385 38.798
110.383 38.776
110.371 38.752
110.359 38.728
110.347 38.703
110.323 38.677
110.299 38.660
110.284 38.642
110.258 38.624
110.253 38.593
110.225 38.562
110.195 38.540
110.165 38.518
110.133 38.494
110.099 38.457
110.051 38.418
110.000 38.403
109.947 38.387
109.945 38.370
109.944 38.352
109.942 38.333
109.940 38.299
109.923 38.262
109.937 38.206
109.951 38.148
109.949 38.119
110.018 38.088


Summary of computational transaction
Raw Inputview raw input (R code)
Raw Outputview raw output of R engine
Computing time1 seconds
R Server'Gwilym Jenkins' @ jenkins.wessa.net

\begin{tabular}{lllllllll}
\hline
Summary of computational transaction \tabularnewline
Raw Input & view raw input (R code)  \tabularnewline
Raw Output & view raw output of R engine  \tabularnewline
Computing time & 1 seconds \tabularnewline
R Server & 'Gwilym Jenkins' @ jenkins.wessa.net \tabularnewline
\hline
\end{tabular}
%Source: https://freestatistics.org/blog/index.php?pk=270095&T=0

[TABLE]
[ROW][C]Summary of computational transaction[/C][/ROW]
[ROW][C]Raw Input[/C][C]view raw input (R code) [/C][/ROW]
[ROW][C]Raw Output[/C][C]view raw output of R engine [/C][/ROW]
[ROW][C]Computing time[/C][C]1 seconds[/C][/ROW]
[ROW][C]R Server[/C][C]'Gwilym Jenkins' @ jenkins.wessa.net[/C][/ROW]
[/TABLE]
Source: https://freestatistics.org/blog/index.php?pk=270095&T=0

Globally Unique Identifier (entire table): ba.freestatistics.org/blog/index.php?pk=270095&T=0

As an alternative you can also use a QR Code:  

The GUIDs for individual cells are displayed in the table below:

Summary of computational transaction
Raw Inputview raw input (R code)
Raw Outputview raw output of R engine
Computing time1 seconds
R Server'Gwilym Jenkins' @ jenkins.wessa.net


Two Sample t-test (paired)
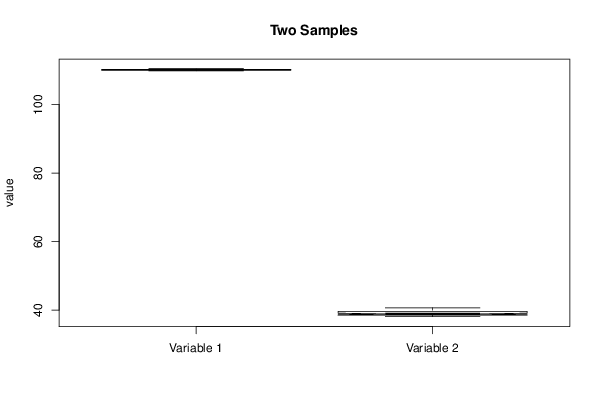
Difference: Mean1 - Mean271.0907368421053
t-stat734.292190442849
df56
p-value3.05683532163759e-113
H0 value0
Alternativetwo.sided
CI Level0.95
CI[70.8967924414585,71.284681242752]
F-test to compare two variances
F-stat0.0557005203652295
df56
p-value3.13288173770775e-21
H0 value1
Alternativetwo.sided
CI Level0.95
CI[0.032812102349724,0.0945549887626581]

\begin{tabular}{lllllllll}
\hline
Two Sample t-test (paired) \tabularnewline
Difference: Mean1 - Mean2 & 71.0907368421053 \tabularnewline
t-stat & 734.292190442849 \tabularnewline
df & 56 \tabularnewline
p-value & 3.05683532163759e-113 \tabularnewline
H0 value & 0 \tabularnewline
Alternative & two.sided \tabularnewline
CI Level & 0.95 \tabularnewline
CI & [70.8967924414585,71.284681242752] \tabularnewline
F-test to compare two variances \tabularnewline
F-stat & 0.0557005203652295 \tabularnewline
df & 56 \tabularnewline
p-value & 3.13288173770775e-21 \tabularnewline
H0 value & 1 \tabularnewline
Alternative & two.sided \tabularnewline
CI Level & 0.95 \tabularnewline
CI & [0.032812102349724,0.0945549887626581] \tabularnewline
\hline
\end{tabular}
%Source: https://freestatistics.org/blog/index.php?pk=270095&T=1

[TABLE]
[ROW][C]Two Sample t-test (paired)[/C][/ROW]
[ROW][C]Difference: Mean1 - Mean2[/C][C]71.0907368421053[/C][/ROW]
[ROW][C]t-stat[/C][C]734.292190442849[/C][/ROW]
[ROW][C]df[/C][C]56[/C][/ROW]
[ROW][C]p-value[/C][C]3.05683532163759e-113[/C][/ROW]
[ROW][C]H0 value[/C][C]0[/C][/ROW]
[ROW][C]Alternative[/C][C]two.sided[/C][/ROW]
[ROW][C]CI Level[/C][C]0.95[/C][/ROW]
[ROW][C]CI[/C][C][70.8967924414585,71.284681242752][/C][/ROW]
[ROW][C]F-test to compare two variances[/C][/ROW]
[ROW][C]F-stat[/C][C]0.0557005203652295[/C][/ROW]
[ROW][C]df[/C][C]56[/C][/ROW]
[ROW][C]p-value[/C][C]3.13288173770775e-21[/C][/ROW]
[ROW][C]H0 value[/C][C]1[/C][/ROW]
[ROW][C]Alternative[/C][C]two.sided[/C][/ROW]
[ROW][C]CI Level[/C][C]0.95[/C][/ROW]
[ROW][C]CI[/C][C][0.032812102349724,0.0945549887626581][/C][/ROW]
[/TABLE]
Source: https://freestatistics.org/blog/index.php?pk=270095&T=1

Globally Unique Identifier (entire table): ba.freestatistics.org/blog/index.php?pk=270095&T=1

As an alternative you can also use a QR Code:  

The GUIDs for individual cells are displayed in the table below:

Two Sample t-test (paired)
Difference: Mean1 - Mean271.0907368421053
t-stat734.292190442849
df56
p-value3.05683532163759e-113
H0 value0
Alternativetwo.sided
CI Level0.95
CI[70.8967924414585,71.284681242752]
F-test to compare two variances
F-stat0.0557005203652295
df56
p-value3.13288173770775e-21
H0 value1
Alternativetwo.sided
CI Level0.95
CI[0.032812102349724,0.0945549887626581]


Welch Two Sample t-test (paired)
Difference: Mean1 - Mean271.0907368421053
t-stat734.292190442849
df56
p-value3.05683532163759e-113
H0 value0
Alternativetwo.sided
CI Level0.95
CI[70.8967924414585,71.284681242752]

\begin{tabular}{lllllllll}
\hline
Welch Two Sample t-test (paired) \tabularnewline
Difference: Mean1 - Mean2 & 71.0907368421053 \tabularnewline
t-stat & 734.292190442849 \tabularnewline
df & 56 \tabularnewline
p-value & 3.05683532163759e-113 \tabularnewline
H0 value & 0 \tabularnewline
Alternative & two.sided \tabularnewline
CI Level & 0.95 \tabularnewline
CI & [70.8967924414585,71.284681242752] \tabularnewline
\hline
\end{tabular}
%Source: https://freestatistics.org/blog/index.php?pk=270095&T=2

[TABLE]
[ROW][C]Welch Two Sample t-test (paired)[/C][/ROW]
[ROW][C]Difference: Mean1 - Mean2[/C][C]71.0907368421053[/C][/ROW]
[ROW][C]t-stat[/C][C]734.292190442849[/C][/ROW]
[ROW][C]df[/C][C]56[/C][/ROW]
[ROW][C]p-value[/C][C]3.05683532163759e-113[/C][/ROW]
[ROW][C]H0 value[/C][C]0[/C][/ROW]
[ROW][C]Alternative[/C][C]two.sided[/C][/ROW]
[ROW][C]CI Level[/C][C]0.95[/C][/ROW]
[ROW][C]CI[/C][C][70.8967924414585,71.284681242752][/C][/ROW]
[/TABLE]
Source: https://freestatistics.org/blog/index.php?pk=270095&T=2

Globally Unique Identifier (entire table): ba.freestatistics.org/blog/index.php?pk=270095&T=2

As an alternative you can also use a QR Code:  

The GUIDs for individual cells are displayed in the table below:

Welch Two Sample t-test (paired)
Difference: Mean1 - Mean271.0907368421053
t-stat734.292190442849
df56
p-value3.05683532163759e-113
H0 value0
Alternativetwo.sided
CI Level0.95
CI[70.8967924414585,71.284681242752]


Wicoxon rank sum test with continuity correction (paired)
W1653
p-value5.28180729194816e-11
H0 value0
Alternativetwo.sided
Kolmogorov-Smirnov Test to compare Distributions of two Samples
KS Statistic1
p-value0
Kolmogorov-Smirnov Test to compare Distributional Shape of two Samples
KS Statistic0.43859649122807
p-value3.45962556438373e-05

\begin{tabular}{lllllllll}
\hline
Wicoxon rank sum test with continuity correction (paired) \tabularnewline
W & 1653 \tabularnewline
p-value & 5.28180729194816e-11 \tabularnewline
H0 value & 0 \tabularnewline
Alternative & two.sided \tabularnewline
Kolmogorov-Smirnov Test to compare Distributions of two Samples \tabularnewline
KS Statistic & 1 \tabularnewline
p-value & 0 \tabularnewline
Kolmogorov-Smirnov Test to compare Distributional Shape of two Samples \tabularnewline
KS Statistic & 0.43859649122807 \tabularnewline
p-value & 3.45962556438373e-05 \tabularnewline
\hline
\end{tabular}
%Source: https://freestatistics.org/blog/index.php?pk=270095&T=3

[TABLE]
[ROW][C]Wicoxon rank sum test with continuity correction (paired)[/C][/ROW]
[ROW][C]W[/C][C]1653[/C][/ROW]
[ROW][C]p-value[/C][C]5.28180729194816e-11[/C][/ROW]
[ROW][C]H0 value[/C][C]0[/C][/ROW]
[ROW][C]Alternative[/C][C]two.sided[/C][/ROW]
[ROW][C]Kolmogorov-Smirnov Test to compare Distributions of two Samples[/C][/ROW]
[ROW][C]KS Statistic[/C][C]1[/C][/ROW]
[ROW][C]p-value[/C][C]0[/C][/ROW]
[ROW][C]Kolmogorov-Smirnov Test to compare Distributional Shape of two Samples[/C][/ROW]
[ROW][C]KS Statistic[/C][C]0.43859649122807[/C][/ROW]
[ROW][C]p-value[/C][C]3.45962556438373e-05[/C][/ROW]
[/TABLE]
Source: https://freestatistics.org/blog/index.php?pk=270095&T=3

Globally Unique Identifier (entire table): ba.freestatistics.org/blog/index.php?pk=270095&T=3

As an alternative you can also use a QR Code:  

The GUIDs for individual cells are displayed in the table below:

Wicoxon rank sum test with continuity correction (paired)
W1653
p-value5.28180729194816e-11
H0 value0
Alternativetwo.sided
Kolmogorov-Smirnov Test to compare Distributions of two Samples
KS Statistic1
p-value0
Kolmogorov-Smirnov Test to compare Distributional Shape of two Samples
KS Statistic0.43859649122807
p-value3.45962556438373e-05


Parameters (Session):
par1 = 1 ; par2 = 2 ; par3 = 0.95 ; par4 = two.sided ; par5 = paired ; par6 = 0 ;
Parameters (R input):
par1 = 1 ; par2 = 2 ; par3 = 0.95 ; par4 = two.sided ; par5 = paired ; par6 = 0 ;
R code (references can be found in the software module):
par6 <- ''
par5 <- 'paired'
par4 <- 'two.sided'
par3 <- '0.95'
par2 <- '2'
par1 <- '1'
par1 <- as.numeric(par1) #column number of first sample
par2 <- as.numeric(par2) #column number of second sample
par3 <- as.numeric(par3) #confidence (= 1 - alpha)
if (par5 == 'unpaired') paired <- FALSE else paired <- TRUE
par6 <- as.numeric(par6) #H0
z <- t(y)
if (par1 == par2) stop('Please, select two different column numbers')
if (par1 < 1) stop('Please, select a column number greater than zero for the first sample')
if (par2 < 1) stop('Please, select a column number greater than zero for the second sample')
if (par1 > length(z[1,])) stop('The column number for the first sample should be smaller')
if (par2 > length(z[1,])) stop('The column number for the second sample should be smaller')
if (par3 <= 0) stop('The confidence level should be larger than zero')
if (par3 >= 1) stop('The confidence level should be smaller than zero')
(r.t <- t.test(z[,par1],z[,par2],var.equal=TRUE,alternative=par4,paired=paired,mu=par6,conf.level=par3))
(v.t <- var.test(z[,par1],z[,par2],conf.level=par3))
(r.w <- t.test(z[,par1],z[,par2],var.equal=FALSE,alternative=par4,paired=paired,mu=par6,conf.level=par3))
(w.t <- wilcox.test(z[,par1],z[,par2],alternative=par4,paired=paired,mu=par6,conf.level=par3))
(ks.t <- ks.test(z[,par1],z[,par2],alternative=par4))
m1 <- mean(z[,par1],na.rm=T)
m2 <- mean(z[,par2],na.rm=T)
mdiff <- m1 - m2
newsam1 <- z[!is.na(z[,par1]),par1]
newsam2 <- z[,par2]+mdiff
newsam2 <- newsam2[!is.na(newsam2)]
(ks1.t <- ks.test(newsam1,newsam2,alternative=par4))
mydf <- data.frame(cbind(z[,par1],z[,par2]))
colnames(mydf) <- c('Variable 1','Variable 2')
bitmap(file='test1.png')
boxplot(mydf, notch=TRUE, ylab='value',main=main)
dev.off()
bitmap(file='test2.png')
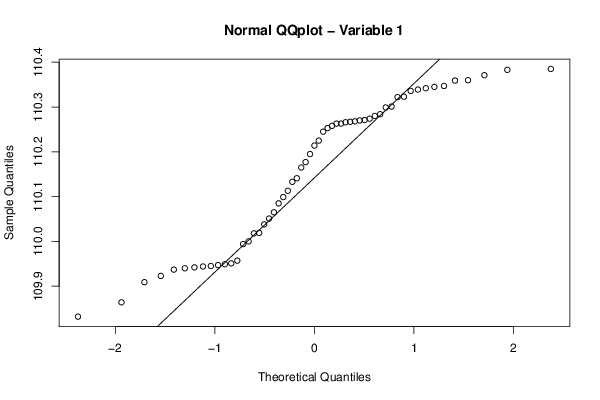
qqnorm(z[,par1],main='Normal QQplot - Variable 1')
qqline(z[,par1])
dev.off()
bitmap(file='test3.png')
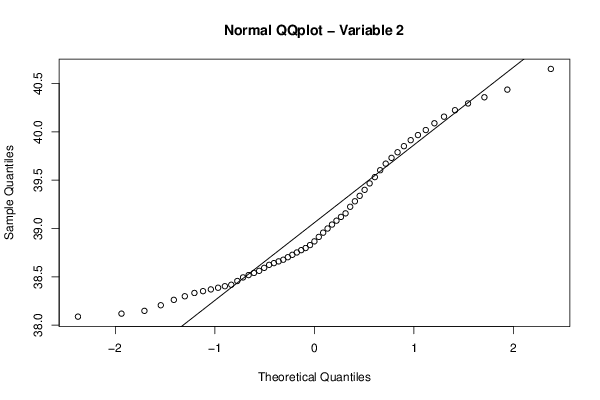
qqnorm(z[,par2],main='Normal QQplot - Variable 2')
qqline(z[,par2])
dev.off()
load(file='createtable')
a<-table.start()
a<-table.row.start(a)
a<-table.element(a,paste('Two Sample t-test (',par5,')',sep=''),2,TRUE)
a<-table.row.end(a)
if(!paired){
a<-table.row.start(a)
a<-table.element(a,'Mean of Sample 1',header=TRUE)
a<-table.element(a,r.t$estimate[[1]])
a<-table.row.end(a)
a<-table.row.start(a)
a<-table.element(a,'Mean of Sample 2',header=TRUE)
a<-table.element(a,r.t$estimate[[2]])
a<-table.row.end(a)
} else {
a<-table.row.start(a)
a<-table.element(a,'Difference: Mean1 - Mean2',header=TRUE)
a<-table.element(a,r.t$estimate)
a<-table.row.end(a)
}
a<-table.row.start(a)
a<-table.element(a,'t-stat',header=TRUE)
a<-table.element(a,r.t$statistic[[1]])
a<-table.row.end(a)
a<-table.row.start(a)
a<-table.element(a,'df',header=TRUE)
a<-table.element(a,r.t$parameter[[1]])
a<-table.row.end(a)
a<-table.row.start(a)
a<-table.element(a,'p-value',header=TRUE)
a<-table.element(a,r.t$p.value)
a<-table.row.end(a)
a<-table.row.start(a)
a<-table.element(a,'H0 value',header=TRUE)
a<-table.element(a,r.t$null.value[[1]])
a<-table.row.end(a)
a<-table.row.start(a)
a<-table.element(a,'Alternative',header=TRUE)
a<-table.element(a,r.t$alternative)
a<-table.row.end(a)
a<-table.row.start(a)
a<-table.element(a,'CI Level',header=TRUE)
a<-table.element(a,attr(r.t$conf.int,'conf.level'))
a<-table.row.end(a)
a<-table.row.start(a)
a<-table.element(a,'CI',header=TRUE)
a<-table.element(a,paste('[',r.t$conf.int[1],',',r.t$conf.int[2],']',sep=''))
a<-table.row.end(a)
a<-table.row.start(a)
a<-table.element(a,'F-test to compare two variances',2,TRUE)
a<-table.row.end(a)
a<-table.row.start(a)
a<-table.element(a,'F-stat',header=TRUE)
a<-table.element(a,v.t$statistic[[1]])
a<-table.row.end(a)
a<-table.row.start(a)
a<-table.element(a,'df',header=TRUE)
a<-table.element(a,v.t$parameter[[1]])
a<-table.row.end(a)
a<-table.row.start(a)
a<-table.element(a,'p-value',header=TRUE)
a<-table.element(a,v.t$p.value)
a<-table.row.end(a)
a<-table.row.start(a)
a<-table.element(a,'H0 value',header=TRUE)
a<-table.element(a,v.t$null.value[[1]])
a<-table.row.end(a)
a<-table.row.start(a)
a<-table.element(a,'Alternative',header=TRUE)
a<-table.element(a,v.t$alternative)
a<-table.row.end(a)
a<-table.row.start(a)
a<-table.element(a,'CI Level',header=TRUE)
a<-table.element(a,attr(v.t$conf.int,'conf.level'))
a<-table.row.end(a)
a<-table.row.start(a)
a<-table.element(a,'CI',header=TRUE)
a<-table.element(a,paste('[',v.t$conf.int[1],',',v.t$conf.int[2],']',sep=''))
a<-table.row.end(a)
a<-table.end(a)
table.save(a,file='mytable.tab')
a<-table.start()
a<-table.row.start(a)
a<-table.element(a,paste('Welch Two Sample t-test (',par5,')',sep=''),2,TRUE)
a<-table.row.end(a)
if(!paired){
a<-table.row.start(a)
a<-table.element(a,'Mean of Sample 1',header=TRUE)
a<-table.element(a,r.w$estimate[[1]])
a<-table.row.end(a)
a<-table.row.start(a)
a<-table.element(a,'Mean of Sample 2',header=TRUE)
a<-table.element(a,r.w$estimate[[2]])
a<-table.row.end(a)
} else {
a<-table.row.start(a)
a<-table.element(a,'Difference: Mean1 - Mean2',header=TRUE)
a<-table.element(a,r.w$estimate)
a<-table.row.end(a)
}
a<-table.row.start(a)
a<-table.element(a,'t-stat',header=TRUE)
a<-table.element(a,r.w$statistic[[1]])
a<-table.row.end(a)
a<-table.row.start(a)
a<-table.element(a,'df',header=TRUE)
a<-table.element(a,r.w$parameter[[1]])
a<-table.row.end(a)
a<-table.row.start(a)
a<-table.element(a,'p-value',header=TRUE)
a<-table.element(a,r.w$p.value)
a<-table.row.end(a)
a<-table.row.start(a)
a<-table.element(a,'H0 value',header=TRUE)
a<-table.element(a,r.w$null.value[[1]])
a<-table.row.end(a)
a<-table.row.start(a)
a<-table.element(a,'Alternative',header=TRUE)
a<-table.element(a,r.w$alternative)
a<-table.row.end(a)
a<-table.row.start(a)
a<-table.element(a,'CI Level',header=TRUE)
a<-table.element(a,attr(r.w$conf.int,'conf.level'))
a<-table.row.end(a)
a<-table.row.start(a)
a<-table.element(a,'CI',header=TRUE)
a<-table.element(a,paste('[',r.w$conf.int[1],',',r.w$conf.int[2],']',sep=''))
a<-table.row.end(a)
a<-table.end(a)
table.save(a,file='mytable1.tab')
a<-table.start()
a<-table.row.start(a)
a<-table.element(a,paste('Wicoxon rank sum test with continuity correction (',par5,')',sep=''),2,TRUE)
a<-table.row.end(a)
a<-table.row.start(a)
a<-table.element(a,'W',header=TRUE)
a<-table.element(a,w.t$statistic[[1]])
a<-table.row.end(a)
a<-table.row.start(a)
a<-table.element(a,'p-value',header=TRUE)
a<-table.element(a,w.t$p.value)
a<-table.row.end(a)
a<-table.row.start(a)
a<-table.element(a,'H0 value',header=TRUE)
a<-table.element(a,w.t$null.value[[1]])
a<-table.row.end(a)
a<-table.row.start(a)
a<-table.element(a,'Alternative',header=TRUE)
a<-table.element(a,w.t$alternative)
a<-table.row.end(a)
a<-table.row.start(a)
a<-table.element(a,'Kolmogorov-Smirnov Test to compare Distributions of two Samples',2,TRUE)
a<-table.row.end(a)
a<-table.row.start(a)
a<-table.element(a,'KS Statistic',header=TRUE)
a<-table.element(a,ks.t$statistic[[1]])
a<-table.row.end(a)
a<-table.row.start(a)
a<-table.element(a,'p-value',header=TRUE)
a<-table.element(a,ks.t$p.value)
a<-table.row.end(a)
a<-table.row.start(a)
a<-table.element(a,'Kolmogorov-Smirnov Test to compare Distributional Shape of two Samples',2,TRUE)
a<-table.row.end(a)
a<-table.row.start(a)
a<-table.element(a,'KS Statistic',header=TRUE)
a<-table.element(a,ks1.t$statistic[[1]])
a<-table.row.end(a)
a<-table.row.start(a)
a<-table.element(a,'p-value',header=TRUE)
a<-table.element(a,ks1.t$p.value)
a<-table.row.end(a)
a<-table.end(a)
table.save(a,file='mytable2.tab')