Free Statistics

of Irreproducible Research!

Author's title

Author*The author of this computation has been verified*
R Software Modulerwasp_multipleregression.wasp
Title produced by softwareMultiple Regression
Date of computationWed, 17 Dec 2014 12:53:55 +0000
Cite this page as followsStatistical Computations at FreeStatistics.org, Office for Research Development and Education, URL https://freestatistics.org/blog/index.php?v=date/2014/Dec/17/t1418820994wvpzz1xrlt2iu22.htm/, Retrieved Thu, 16 May 2024 10:30:12 +0000
Statistical Computations at FreeStatistics.org, Office for Research Development and Education, URL https://freestatistics.org/blog/index.php?pk=270146, Retrieved Thu, 16 May 2024 10:30:12 +0000
QR Codes:

Original text written by user:
IsPrivate?No (this computation is public)
User-defined keywords
Estimated Impact69
Family? (F = Feedback message, R = changed R code, M = changed R Module, P = changed Parameters, D = changed Data)
-     [Testing Mean with unknown Variance - Critical Value] [] [2010-10-25 13:12:27] [b98453cac15ba1066b407e146608df68]
- RMP   [Testing Mean with unknown Variance - Critical Value] [] [2014-10-07 07:47:40] [32b17a345b130fdf5cc88718ed94a974]
- RMPD    [ARIMA Backward Selection] [] [2014-12-15 13:21:35] [1764622206627ac897c737076a0cb4c8]
- R P       [ARIMA Backward Selection] [] [2014-12-15 13:27:30] [32b17a345b130fdf5cc88718ed94a974]
- RMPD          [Multiple Regression] [] [2014-12-17 12:53:55] [baa7d013c3374cabca6c222951a47a9f] [Current]
Feedback Forum

Post a new message
Dataseries X:
1	21	26	50	4	13	12	13	13	21	2	149	96	18	68	12,9
1	21	37	54	5	14	11	11	11	22	0	148	88	39	32	12,8
0	21	67	71	4	16	13	14	10	18	0	158	114	46	62	7,4
1	21	43	54	4	14	11	15	9	23	4	128	69	31	33	6,7
0	21	52	65	9	13	10	14	8	12	0	224	176	67	52	12,6
0	21	52	73	8	15	7	11	26	20	-1	159	114	35	62	14,8
1	23	43	52	11	13	10	13	10	22	0	105	121	52	77	13,3
1	22	84	84	4	20	15	16	10	21	1	159	110	77	76	11,1
0	25	67	42	4	17	12	14	8	19	0	167	158	37	41	8,2
1	21	49	66	6	15	12	14	13	22	3	165	116	32	48	11,4
0	23	70	65	4	16	10	15	11	15	-1	159	181	36	63	6,4
1	21	58	73	4	17	14	13	12	19	4	176	141	69	78	12,0
0	21	68	75	4	11	6	14	24	18	1	54	35	21	19	6,3
0	25	62	72	11	16	12	11	21	15	0	91	80	26	31	11,3
1	21	43	66	4	16	14	12	5	20	-2	163	152	54	66	11,9
1	21	56	70	4	15	11	14	14	21	-4	124	97	36	35	9,3
0	24	74	81	6	14	12	12	9	15	2	121	84	23	45	10,0
1	21	63	69	8	16	13	15	17	23	2	148	101	112	25	13,8
1	24	58	71	5	17	11	14	18	21	-4	221	107	35	44	10,8
0	21	63	68	9	15	7	12	23	25	2	149	112	47	54	11,7
1	22	53	70	4	14	11	12	9	9	2	244	171	37	74	10,9
0	20	57	68	7	14	7	12	14	30	0	148	137	109	80	16,1
1	21	64	67	4	15	12	14	10	23	-3	150	66	20	61	9,9
0	22	53	76	4	17	13	16	8	16	2	153	93	22	41	11,5
1	22	29	70	7	14	9	12	10	16	0	94	105	23	46	8,3
0	21	54	60	12	16	11	12	19	19	4	156	131	32	39	11,7
1	21	58	72	7	15	12	14	11	25	2	132	102	30	34	9,0
1	22	51	71	8	16	12	15	12	23	2	105	120	43	42	10,8
0	20	54	70	4	8	5	14	11	10	-4	151	77	16	39	10,4
0	21	56	64	9	17	13	13	10	14	3	131	108	49	20	12,7
1	21	47	76	4	10	6	16	14	26	2	157	168	43	53	11,8
1	24	50	68	4	16	6	15	11	24	-1	162	75	46	54	13,0
1	22	35	76	4	16	12	13	13	24	-3	163	107	19	49	10,8
1	22	30	65	7	16	11	16	15	18	0	59	62	23	34	12,3
0	21	68	67	4	8	6	16	15	23	1	187	121	59	46	11,3
0	20	56	75	4	14	11	15	14	23	-3	116	97	32	37	11,6
0	23	43	60	4	16	12	13	12	19	3	148	126	19	30	10,9
0	20	67	73	4	19	13	12	13	21	0	155	104	22	28	12,1
0	23	62	63	4	19	14	14	7	18	0	125	148	48	45	13,3
1	21	57	70	4	14	12	14	8	27	0	116	146	23	35	10,1
1	21	54	66	12	13	14	10	20	13	3	138	97	33	41	14,3
0	22	61	64	4	15	11	16	16	28	0	164	118	34	73	9,3
0	21	56	70	5	11	10	14	11	23	2	162	58	48	17	12,5
0	21	41	75	15	9	7	14	26	21	-1	99	63	18	40	7,6
1	21	53	60	10	12	7	15	15	19	3	186	50	33	37	9,2
1	22	46	66	5	13	10	16	20	17	2	188	94	67	28	14,5
1	21	51	59	9	17	12	15	15	25	2	177	127	80	56	12,3
0	21	37	78	4	7	5	13	17	14	-2	139	128	32	50	12,6
0	21	42	67	7	15	10	12	19	16	0	162	146	43	59	13,0
0	21	38	59	5	12	12	12	13	24	-2	108	69	38	27	12,6
0	20	66	66	4	15	11	14	8	20	0	159	186	29	61	13,2
0	21	53	71	4	16	12	15	9	24	6	110	85	32	51	7,7
0	19	49	66	4	14	11	11	12	22	0	96	54	35	35	10,5
1	19	49	72	4	16	12	14	9	22	-2	87	106	29	48	10,9
1	20	59	71	6	13	10	16	14	20	1	97	34	12	25	4,3
1	19	40	59	10	16	9	13	14	10	0	127	60	37	44	10,3
1	20	63	78	4	10	7	11	13	22	2	74	62	51	20	11,4
0	21	34	65	11	12	9	12	16	20	2	114	64	14	26	5,6
0	18	32	65	14	14	10	12	14	22	-3	95	98	20	23	8,8
0	21	67	71	4	16	12	14	11	20	1	121	35	11	21	9,0
0	20	61	72	4	18	14	12	11	17	-4	130	55	35	41	9,6
1	21	60	66	5	12	9	13	14	18	1	52	54	8	22	6,4
1	19	63	69	4	15	12	14	15	19	0	118	51	24	27	11,6


Summary of computational transaction
Raw Inputview raw input (R code)
Raw Outputview raw output of R engine
Computing time5 seconds
R Server'Sir Ronald Aylmer Fisher' @ fisher.wessa.net

\begin{tabular}{lllllllll}
\hline
Summary of computational transaction \tabularnewline
Raw Input & view raw input (R code)  \tabularnewline
Raw Output & view raw output of R engine  \tabularnewline
Computing time & 5 seconds \tabularnewline
R Server & 'Sir Ronald Aylmer Fisher' @ fisher.wessa.net \tabularnewline
\hline
\end{tabular}
%Source: https://freestatistics.org/blog/index.php?pk=270146&T=0

[TABLE]
[ROW][C]Summary of computational transaction[/C][/ROW]
[ROW][C]Raw Input[/C][C]view raw input (R code) [/C][/ROW]
[ROW][C]Raw Output[/C][C]view raw output of R engine [/C][/ROW]
[ROW][C]Computing time[/C][C]5 seconds[/C][/ROW]
[ROW][C]R Server[/C][C]'Sir Ronald Aylmer Fisher' @ fisher.wessa.net[/C][/ROW]
[/TABLE]
Source: https://freestatistics.org/blog/index.php?pk=270146&T=0

Globally Unique Identifier (entire table): ba.freestatistics.org/blog/index.php?pk=270146&T=0

As an alternative you can also use a QR Code:  

The GUIDs for individual cells are displayed in the table below:

Summary of computational transaction
Raw Inputview raw input (R code)
Raw Outputview raw output of R engine
Computing time5 seconds
R Server'Sir Ronald Aylmer Fisher' @ fisher.wessa.net


Multiple Linear Regression - Estimated Regression Equation
Totaalscore[t] = + 11.3465 -0.0498912geslacht[t] + 0.0244063leeftijd[t] -0.0560965intrinsieke[t] + 0.0193198extrinsieke[t] -0.144469demotivatie[t] + 0.0187176statistiek[t] + 0.0951307software[t] -0.39529Stress[t] + 0.100445Depressie[t] -0.000893466NumeracyTest[t] -0.0552383TussentijdseTest[t] + 0.00943437LFM[t] + 0.00859947B[t] + 0.0642745PRH[t] -0.00701515CH[t] + e[t]

\begin{tabular}{lllllllll}
\hline
Multiple Linear Regression - Estimated Regression Equation \tabularnewline
Totaalscore[t] =  +  11.3465 -0.0498912geslacht[t] +  0.0244063leeftijd[t] -0.0560965intrinsieke[t] +  0.0193198extrinsieke[t] -0.144469demotivatie[t] +  0.0187176statistiek[t] +  0.0951307software[t] -0.39529Stress[t] +  0.100445Depressie[t] -0.000893466NumeracyTest[t] -0.0552383TussentijdseTest[t] +  0.00943437LFM[t] +  0.00859947B[t] +  0.0642745PRH[t] -0.00701515CH[t]  + e[t] \tabularnewline
\hline
\end{tabular}
%Source: https://freestatistics.org/blog/index.php?pk=270146&T=1

[TABLE]
[ROW][C]Multiple Linear Regression - Estimated Regression Equation[/C][/ROW]
[ROW][C]Totaalscore[t] =  +  11.3465 -0.0498912geslacht[t] +  0.0244063leeftijd[t] -0.0560965intrinsieke[t] +  0.0193198extrinsieke[t] -0.144469demotivatie[t] +  0.0187176statistiek[t] +  0.0951307software[t] -0.39529Stress[t] +  0.100445Depressie[t] -0.000893466NumeracyTest[t] -0.0552383TussentijdseTest[t] +  0.00943437LFM[t] +  0.00859947B[t] +  0.0642745PRH[t] -0.00701515CH[t]  + e[t][/C][/ROW]
[/TABLE]
Source: https://freestatistics.org/blog/index.php?pk=270146&T=1

Globally Unique Identifier (entire table): ba.freestatistics.org/blog/index.php?pk=270146&T=1

As an alternative you can also use a QR Code:  

The GUIDs for individual cells are displayed in the table below:

Multiple Linear Regression - Estimated Regression Equation
Totaalscore[t] = + 11.3465 -0.0498912geslacht[t] + 0.0244063leeftijd[t] -0.0560965intrinsieke[t] + 0.0193198extrinsieke[t] -0.144469demotivatie[t] + 0.0187176statistiek[t] + 0.0951307software[t] -0.39529Stress[t] + 0.100445Depressie[t] -0.000893466NumeracyTest[t] -0.0552383TussentijdseTest[t] + 0.00943437LFM[t] + 0.00859947B[t] + 0.0642745PRH[t] -0.00701515CH[t] + e[t]


Multiple Linear Regression - Ordinary Least Squares
VariableParameterS.D.T-STATH0: parameter = 02-tail p-value1-tail p-value
(Intercept)11.34655.841391.9420.058090.029045
geslacht-0.04989120.562479-0.08870.9296980.464849
leeftijd0.02440630.2062860.11830.9063240.453162
intrinsieke-0.05609650.0270157-2.0760.04334630.0216732
extrinsieke0.01931980.03960090.48790.6279150.313957
demotivatie-0.1444690.114401-1.2630.2128770.106439
statistiek0.01871760.1544590.12120.9040640.452032
software0.09513070.1708230.55690.580240.29012
Stress-0.395290.184202-2.1460.03707090.0185355
Depressie0.1004450.07571781.3270.191060.09553
NumeracyTest-0.0008934660.0654279-0.013660.9891620.494581
TussentijdseTest-0.05523830.122708-0.45020.6546650.327333
LFM0.009434370.008755411.0780.2867350.143368
B0.008599470.009668870.88940.3783190.18916
PRH0.06427450.01523724.2180.0001113155.56573e-05
CH-0.007015150.0203105-0.34540.7313380.365669

\begin{tabular}{lllllllll}
\hline
Multiple Linear Regression - Ordinary Least Squares \tabularnewline
Variable & Parameter & S.D. & T-STATH0: parameter = 0 & 2-tail p-value & 1-tail p-value \tabularnewline
(Intercept) & 11.3465 & 5.84139 & 1.942 & 0.05809 & 0.029045 \tabularnewline
geslacht & -0.0498912 & 0.562479 & -0.0887 & 0.929698 & 0.464849 \tabularnewline
leeftijd & 0.0244063 & 0.206286 & 0.1183 & 0.906324 & 0.453162 \tabularnewline
intrinsieke & -0.0560965 & 0.0270157 & -2.076 & 0.0433463 & 0.0216732 \tabularnewline
extrinsieke & 0.0193198 & 0.0396009 & 0.4879 & 0.627915 & 0.313957 \tabularnewline
demotivatie & -0.144469 & 0.114401 & -1.263 & 0.212877 & 0.106439 \tabularnewline
statistiek & 0.0187176 & 0.154459 & 0.1212 & 0.904064 & 0.452032 \tabularnewline
software & 0.0951307 & 0.170823 & 0.5569 & 0.58024 & 0.29012 \tabularnewline
Stress & -0.39529 & 0.184202 & -2.146 & 0.0370709 & 0.0185355 \tabularnewline
Depressie & 0.100445 & 0.0757178 & 1.327 & 0.19106 & 0.09553 \tabularnewline
NumeracyTest & -0.000893466 & 0.0654279 & -0.01366 & 0.989162 & 0.494581 \tabularnewline
TussentijdseTest & -0.0552383 & 0.122708 & -0.4502 & 0.654665 & 0.327333 \tabularnewline
LFM & 0.00943437 & 0.00875541 & 1.078 & 0.286735 & 0.143368 \tabularnewline
B & 0.00859947 & 0.00966887 & 0.8894 & 0.378319 & 0.18916 \tabularnewline
PRH & 0.0642745 & 0.0152372 & 4.218 & 0.000111315 & 5.56573e-05 \tabularnewline
CH & -0.00701515 & 0.0203105 & -0.3454 & 0.731338 & 0.365669 \tabularnewline
\hline
\end{tabular}
%Source: https://freestatistics.org/blog/index.php?pk=270146&T=2

[TABLE]
[ROW][C]Multiple Linear Regression - Ordinary Least Squares[/C][/ROW]
[ROW][C]Variable[/C][C]Parameter[/C][C]S.D.[/C][C]T-STATH0: parameter = 0[/C][C]2-tail p-value[/C][C]1-tail p-value[/C][/ROW]
[ROW][C](Intercept)[/C][C]11.3465[/C][C]5.84139[/C][C]1.942[/C][C]0.05809[/C][C]0.029045[/C][/ROW]
[ROW][C]geslacht[/C][C]-0.0498912[/C][C]0.562479[/C][C]-0.0887[/C][C]0.929698[/C][C]0.464849[/C][/ROW]
[ROW][C]leeftijd[/C][C]0.0244063[/C][C]0.206286[/C][C]0.1183[/C][C]0.906324[/C][C]0.453162[/C][/ROW]
[ROW][C]intrinsieke[/C][C]-0.0560965[/C][C]0.0270157[/C][C]-2.076[/C][C]0.0433463[/C][C]0.0216732[/C][/ROW]
[ROW][C]extrinsieke[/C][C]0.0193198[/C][C]0.0396009[/C][C]0.4879[/C][C]0.627915[/C][C]0.313957[/C][/ROW]
[ROW][C]demotivatie[/C][C]-0.144469[/C][C]0.114401[/C][C]-1.263[/C][C]0.212877[/C][C]0.106439[/C][/ROW]
[ROW][C]statistiek[/C][C]0.0187176[/C][C]0.154459[/C][C]0.1212[/C][C]0.904064[/C][C]0.452032[/C][/ROW]
[ROW][C]software[/C][C]0.0951307[/C][C]0.170823[/C][C]0.5569[/C][C]0.58024[/C][C]0.29012[/C][/ROW]
[ROW][C]Stress[/C][C]-0.39529[/C][C]0.184202[/C][C]-2.146[/C][C]0.0370709[/C][C]0.0185355[/C][/ROW]
[ROW][C]Depressie[/C][C]0.100445[/C][C]0.0757178[/C][C]1.327[/C][C]0.19106[/C][C]0.09553[/C][/ROW]
[ROW][C]NumeracyTest[/C][C]-0.000893466[/C][C]0.0654279[/C][C]-0.01366[/C][C]0.989162[/C][C]0.494581[/C][/ROW]
[ROW][C]TussentijdseTest[/C][C]-0.0552383[/C][C]0.122708[/C][C]-0.4502[/C][C]0.654665[/C][C]0.327333[/C][/ROW]
[ROW][C]LFM[/C][C]0.00943437[/C][C]0.00875541[/C][C]1.078[/C][C]0.286735[/C][C]0.143368[/C][/ROW]
[ROW][C]B[/C][C]0.00859947[/C][C]0.00966887[/C][C]0.8894[/C][C]0.378319[/C][C]0.18916[/C][/ROW]
[ROW][C]PRH[/C][C]0.0642745[/C][C]0.0152372[/C][C]4.218[/C][C]0.000111315[/C][C]5.56573e-05[/C][/ROW]
[ROW][C]CH[/C][C]-0.00701515[/C][C]0.0203105[/C][C]-0.3454[/C][C]0.731338[/C][C]0.365669[/C][/ROW]
[/TABLE]
Source: https://freestatistics.org/blog/index.php?pk=270146&T=2

Globally Unique Identifier (entire table): ba.freestatistics.org/blog/index.php?pk=270146&T=2

As an alternative you can also use a QR Code:  

The GUIDs for individual cells are displayed in the table below:

Multiple Linear Regression - Ordinary Least Squares
VariableParameterS.D.T-STATH0: parameter = 02-tail p-value1-tail p-value
(Intercept)11.34655.841391.9420.058090.029045
geslacht-0.04989120.562479-0.08870.9296980.464849
leeftijd0.02440630.2062860.11830.9063240.453162
intrinsieke-0.05609650.0270157-2.0760.04334630.0216732
extrinsieke0.01931980.03960090.48790.6279150.313957
demotivatie-0.1444690.114401-1.2630.2128770.106439
statistiek0.01871760.1544590.12120.9040640.452032
software0.09513070.1708230.55690.580240.29012
Stress-0.395290.184202-2.1460.03707090.0185355
Depressie0.1004450.07571781.3270.191060.09553
NumeracyTest-0.0008934660.0654279-0.013660.9891620.494581
TussentijdseTest-0.05523830.122708-0.45020.6546650.327333
LFM0.009434370.008755411.0780.2867350.143368
B0.008599470.009668870.88940.3783190.18916
PRH0.06427450.01523724.2180.0001113155.56573e-05
CH-0.007015150.0203105-0.34540.7313380.365669


Multiple Linear Regression - Regression Statistics
Multiple R0.695623
R-squared0.483891
Adjusted R-squared0.319175
F-TEST (value)2.93773
F-TEST (DF numerator)15
F-TEST (DF denominator)47
p-value0.00242957
Multiple Linear Regression - Residual Statistics
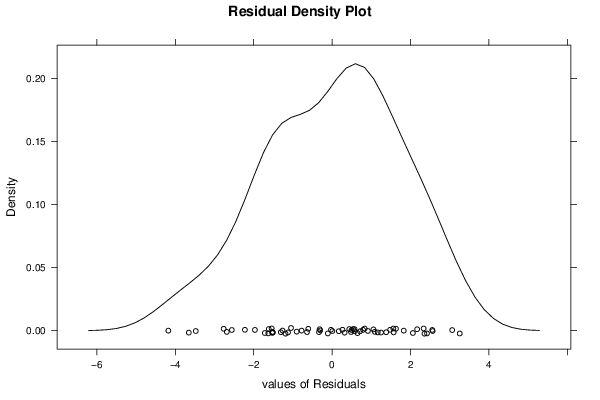
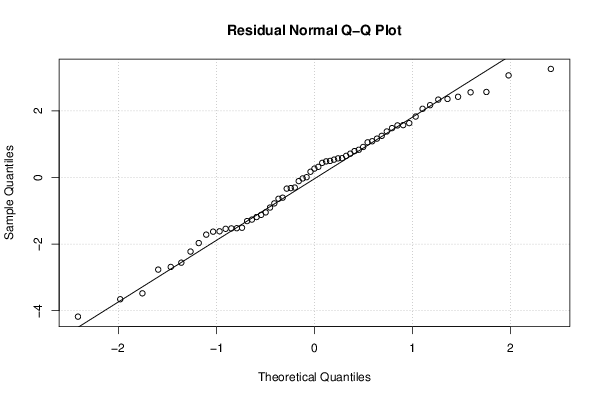
Residual Standard Deviation1.98018
Sum Squared Residuals184.292

\begin{tabular}{lllllllll}
\hline
Multiple Linear Regression - Regression Statistics \tabularnewline
Multiple R & 0.695623 \tabularnewline
R-squared & 0.483891 \tabularnewline
Adjusted R-squared & 0.319175 \tabularnewline
F-TEST (value) & 2.93773 \tabularnewline
F-TEST (DF numerator) & 15 \tabularnewline
F-TEST (DF denominator) & 47 \tabularnewline
p-value & 0.00242957 \tabularnewline
Multiple Linear Regression - Residual Statistics \tabularnewline
Residual Standard Deviation & 1.98018 \tabularnewline
Sum Squared Residuals & 184.292 \tabularnewline
\hline
\end{tabular}
%Source: https://freestatistics.org/blog/index.php?pk=270146&T=3

[TABLE]
[ROW][C]Multiple Linear Regression - Regression Statistics[/C][/ROW]
[ROW][C]Multiple R[/C][C]0.695623[/C][/ROW]
[ROW][C]R-squared[/C][C]0.483891[/C][/ROW]
[ROW][C]Adjusted R-squared[/C][C]0.319175[/C][/ROW]
[ROW][C]F-TEST (value)[/C][C]2.93773[/C][/ROW]
[ROW][C]F-TEST (DF numerator)[/C][C]15[/C][/ROW]
[ROW][C]F-TEST (DF denominator)[/C][C]47[/C][/ROW]
[ROW][C]p-value[/C][C]0.00242957[/C][/ROW]
[ROW][C]Multiple Linear Regression - Residual Statistics[/C][/ROW]
[ROW][C]Residual Standard Deviation[/C][C]1.98018[/C][/ROW]
[ROW][C]Sum Squared Residuals[/C][C]184.292[/C][/ROW]
[/TABLE]
Source: https://freestatistics.org/blog/index.php?pk=270146&T=3

Globally Unique Identifier (entire table): ba.freestatistics.org/blog/index.php?pk=270146&T=3

As an alternative you can also use a QR Code:  

The GUIDs for individual cells are displayed in the table below:

Multiple Linear Regression - Regression Statistics
Multiple R0.695623
R-squared0.483891
Adjusted R-squared0.319175
F-TEST (value)2.93773
F-TEST (DF numerator)15
F-TEST (DF denominator)47
p-value0.00242957
Multiple Linear Regression - Residual Statistics
Residual Standard Deviation1.98018
Sum Squared Residuals184.292


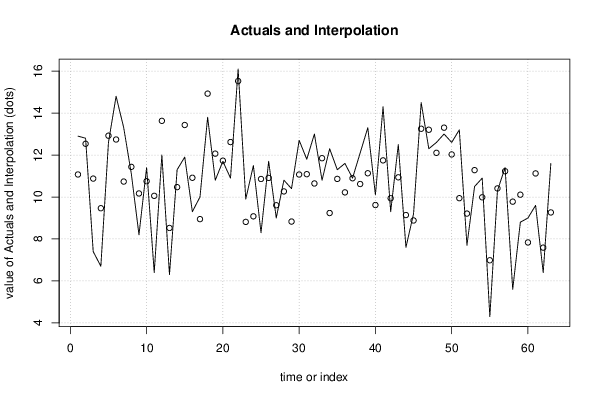
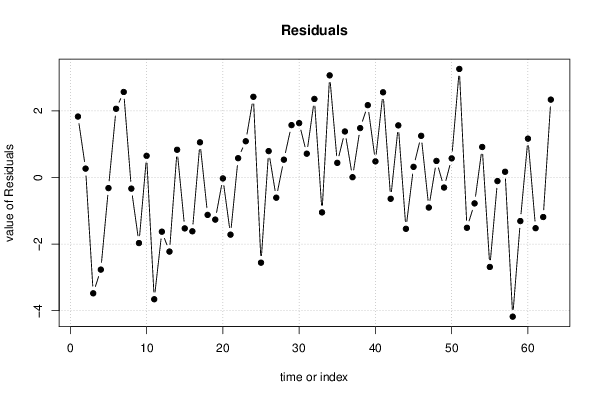
Multiple Linear Regression - Actuals, Interpolation, and Residuals
Time or IndexActualsInterpolationForecastResidualsPrediction Error
112.911.07261.82739
212.812.53530.264705
37.410.8775-3.47755
46.79.466-2.766
512.612.9194-0.319407
614.812.73912.06088
713.310.73522.56481
811.111.4355-0.335547
98.210.1688-1.96884
1011.410.75170.648335
116.410.0557-3.65567
121213.6274-1.62742
136.38.52448-2.22448
1411.310.46950.830498
1511.913.4296-1.52964
169.310.9162-1.61618
17108.946011.05399
1813.814.9239-1.12395
1910.812.065-1.26499
2011.711.7301-0.0300505
2110.912.617-1.71697
2216.115.52260.577378
239.98.81371.0863
2411.59.079432.42057
258.310.8581-2.55815
2611.710.90980.790163
2799.60785-0.60785
2810.810.26630.533689
2910.48.829731.57027
3012.711.071.62997
3111.811.08680.713207
321310.64422.35585
3310.811.8484-1.04836
3412.39.236633.06337
3511.310.86210.437938
3611.610.22061.37937
3710.910.89250.00747416
3812.110.61881.4812
3913.311.13112.16891
4010.19.617840.482158
4114.311.74482.55523
429.39.94002-0.640018
4312.510.93771.56226
447.69.14149-1.54149
459.28.881950.318045
4614.513.25111.24891
4712.313.2033-0.903278
4812.612.10410.495885
491313.3027-0.302681
5012.612.02770.572289
5113.29.943933.25607
527.79.21033-1.51033
5310.511.2789-0.778855
5410.99.986140.913861
554.36.98649-2.68649
5610.310.4095-0.109458
5711.411.22930.17071
585.69.7778-4.1778
598.810.1093-1.30927
6097.835421.16458
619.611.1232-1.52325
626.47.58787-1.18787
6311.69.264432.33557

\begin{tabular}{lllllllll}
\hline
Multiple Linear Regression - Actuals, Interpolation, and Residuals \tabularnewline
Time or Index & Actuals & InterpolationForecast & ResidualsPrediction Error \tabularnewline
1 & 12.9 & 11.0726 & 1.82739 \tabularnewline
2 & 12.8 & 12.5353 & 0.264705 \tabularnewline
3 & 7.4 & 10.8775 & -3.47755 \tabularnewline
4 & 6.7 & 9.466 & -2.766 \tabularnewline
5 & 12.6 & 12.9194 & -0.319407 \tabularnewline
6 & 14.8 & 12.7391 & 2.06088 \tabularnewline
7 & 13.3 & 10.7352 & 2.56481 \tabularnewline
8 & 11.1 & 11.4355 & -0.335547 \tabularnewline
9 & 8.2 & 10.1688 & -1.96884 \tabularnewline
10 & 11.4 & 10.7517 & 0.648335 \tabularnewline
11 & 6.4 & 10.0557 & -3.65567 \tabularnewline
12 & 12 & 13.6274 & -1.62742 \tabularnewline
13 & 6.3 & 8.52448 & -2.22448 \tabularnewline
14 & 11.3 & 10.4695 & 0.830498 \tabularnewline
15 & 11.9 & 13.4296 & -1.52964 \tabularnewline
16 & 9.3 & 10.9162 & -1.61618 \tabularnewline
17 & 10 & 8.94601 & 1.05399 \tabularnewline
18 & 13.8 & 14.9239 & -1.12395 \tabularnewline
19 & 10.8 & 12.065 & -1.26499 \tabularnewline
20 & 11.7 & 11.7301 & -0.0300505 \tabularnewline
21 & 10.9 & 12.617 & -1.71697 \tabularnewline
22 & 16.1 & 15.5226 & 0.577378 \tabularnewline
23 & 9.9 & 8.8137 & 1.0863 \tabularnewline
24 & 11.5 & 9.07943 & 2.42057 \tabularnewline
25 & 8.3 & 10.8581 & -2.55815 \tabularnewline
26 & 11.7 & 10.9098 & 0.790163 \tabularnewline
27 & 9 & 9.60785 & -0.60785 \tabularnewline
28 & 10.8 & 10.2663 & 0.533689 \tabularnewline
29 & 10.4 & 8.82973 & 1.57027 \tabularnewline
30 & 12.7 & 11.07 & 1.62997 \tabularnewline
31 & 11.8 & 11.0868 & 0.713207 \tabularnewline
32 & 13 & 10.6442 & 2.35585 \tabularnewline
33 & 10.8 & 11.8484 & -1.04836 \tabularnewline
34 & 12.3 & 9.23663 & 3.06337 \tabularnewline
35 & 11.3 & 10.8621 & 0.437938 \tabularnewline
36 & 11.6 & 10.2206 & 1.37937 \tabularnewline
37 & 10.9 & 10.8925 & 0.00747416 \tabularnewline
38 & 12.1 & 10.6188 & 1.4812 \tabularnewline
39 & 13.3 & 11.1311 & 2.16891 \tabularnewline
40 & 10.1 & 9.61784 & 0.482158 \tabularnewline
41 & 14.3 & 11.7448 & 2.55523 \tabularnewline
42 & 9.3 & 9.94002 & -0.640018 \tabularnewline
43 & 12.5 & 10.9377 & 1.56226 \tabularnewline
44 & 7.6 & 9.14149 & -1.54149 \tabularnewline
45 & 9.2 & 8.88195 & 0.318045 \tabularnewline
46 & 14.5 & 13.2511 & 1.24891 \tabularnewline
47 & 12.3 & 13.2033 & -0.903278 \tabularnewline
48 & 12.6 & 12.1041 & 0.495885 \tabularnewline
49 & 13 & 13.3027 & -0.302681 \tabularnewline
50 & 12.6 & 12.0277 & 0.572289 \tabularnewline
51 & 13.2 & 9.94393 & 3.25607 \tabularnewline
52 & 7.7 & 9.21033 & -1.51033 \tabularnewline
53 & 10.5 & 11.2789 & -0.778855 \tabularnewline
54 & 10.9 & 9.98614 & 0.913861 \tabularnewline
55 & 4.3 & 6.98649 & -2.68649 \tabularnewline
56 & 10.3 & 10.4095 & -0.109458 \tabularnewline
57 & 11.4 & 11.2293 & 0.17071 \tabularnewline
58 & 5.6 & 9.7778 & -4.1778 \tabularnewline
59 & 8.8 & 10.1093 & -1.30927 \tabularnewline
60 & 9 & 7.83542 & 1.16458 \tabularnewline
61 & 9.6 & 11.1232 & -1.52325 \tabularnewline
62 & 6.4 & 7.58787 & -1.18787 \tabularnewline
63 & 11.6 & 9.26443 & 2.33557 \tabularnewline
\hline
\end{tabular}
%Source: https://freestatistics.org/blog/index.php?pk=270146&T=4

[TABLE]
[ROW][C]Multiple Linear Regression - Actuals, Interpolation, and Residuals[/C][/ROW]
[ROW][C]Time or Index[/C][C]Actuals[/C][C]InterpolationForecast[/C][C]ResidualsPrediction Error[/C][/ROW]
[ROW][C]1[/C][C]12.9[/C][C]11.0726[/C][C]1.82739[/C][/ROW]
[ROW][C]2[/C][C]12.8[/C][C]12.5353[/C][C]0.264705[/C][/ROW]
[ROW][C]3[/C][C]7.4[/C][C]10.8775[/C][C]-3.47755[/C][/ROW]
[ROW][C]4[/C][C]6.7[/C][C]9.466[/C][C]-2.766[/C][/ROW]
[ROW][C]5[/C][C]12.6[/C][C]12.9194[/C][C]-0.319407[/C][/ROW]
[ROW][C]6[/C][C]14.8[/C][C]12.7391[/C][C]2.06088[/C][/ROW]
[ROW][C]7[/C][C]13.3[/C][C]10.7352[/C][C]2.56481[/C][/ROW]
[ROW][C]8[/C][C]11.1[/C][C]11.4355[/C][C]-0.335547[/C][/ROW]
[ROW][C]9[/C][C]8.2[/C][C]10.1688[/C][C]-1.96884[/C][/ROW]
[ROW][C]10[/C][C]11.4[/C][C]10.7517[/C][C]0.648335[/C][/ROW]
[ROW][C]11[/C][C]6.4[/C][C]10.0557[/C][C]-3.65567[/C][/ROW]
[ROW][C]12[/C][C]12[/C][C]13.6274[/C][C]-1.62742[/C][/ROW]
[ROW][C]13[/C][C]6.3[/C][C]8.52448[/C][C]-2.22448[/C][/ROW]
[ROW][C]14[/C][C]11.3[/C][C]10.4695[/C][C]0.830498[/C][/ROW]
[ROW][C]15[/C][C]11.9[/C][C]13.4296[/C][C]-1.52964[/C][/ROW]
[ROW][C]16[/C][C]9.3[/C][C]10.9162[/C][C]-1.61618[/C][/ROW]
[ROW][C]17[/C][C]10[/C][C]8.94601[/C][C]1.05399[/C][/ROW]
[ROW][C]18[/C][C]13.8[/C][C]14.9239[/C][C]-1.12395[/C][/ROW]
[ROW][C]19[/C][C]10.8[/C][C]12.065[/C][C]-1.26499[/C][/ROW]
[ROW][C]20[/C][C]11.7[/C][C]11.7301[/C][C]-0.0300505[/C][/ROW]
[ROW][C]21[/C][C]10.9[/C][C]12.617[/C][C]-1.71697[/C][/ROW]
[ROW][C]22[/C][C]16.1[/C][C]15.5226[/C][C]0.577378[/C][/ROW]
[ROW][C]23[/C][C]9.9[/C][C]8.8137[/C][C]1.0863[/C][/ROW]
[ROW][C]24[/C][C]11.5[/C][C]9.07943[/C][C]2.42057[/C][/ROW]
[ROW][C]25[/C][C]8.3[/C][C]10.8581[/C][C]-2.55815[/C][/ROW]
[ROW][C]26[/C][C]11.7[/C][C]10.9098[/C][C]0.790163[/C][/ROW]
[ROW][C]27[/C][C]9[/C][C]9.60785[/C][C]-0.60785[/C][/ROW]
[ROW][C]28[/C][C]10.8[/C][C]10.2663[/C][C]0.533689[/C][/ROW]
[ROW][C]29[/C][C]10.4[/C][C]8.82973[/C][C]1.57027[/C][/ROW]
[ROW][C]30[/C][C]12.7[/C][C]11.07[/C][C]1.62997[/C][/ROW]
[ROW][C]31[/C][C]11.8[/C][C]11.0868[/C][C]0.713207[/C][/ROW]
[ROW][C]32[/C][C]13[/C][C]10.6442[/C][C]2.35585[/C][/ROW]
[ROW][C]33[/C][C]10.8[/C][C]11.8484[/C][C]-1.04836[/C][/ROW]
[ROW][C]34[/C][C]12.3[/C][C]9.23663[/C][C]3.06337[/C][/ROW]
[ROW][C]35[/C][C]11.3[/C][C]10.8621[/C][C]0.437938[/C][/ROW]
[ROW][C]36[/C][C]11.6[/C][C]10.2206[/C][C]1.37937[/C][/ROW]
[ROW][C]37[/C][C]10.9[/C][C]10.8925[/C][C]0.00747416[/C][/ROW]
[ROW][C]38[/C][C]12.1[/C][C]10.6188[/C][C]1.4812[/C][/ROW]
[ROW][C]39[/C][C]13.3[/C][C]11.1311[/C][C]2.16891[/C][/ROW]
[ROW][C]40[/C][C]10.1[/C][C]9.61784[/C][C]0.482158[/C][/ROW]
[ROW][C]41[/C][C]14.3[/C][C]11.7448[/C][C]2.55523[/C][/ROW]
[ROW][C]42[/C][C]9.3[/C][C]9.94002[/C][C]-0.640018[/C][/ROW]
[ROW][C]43[/C][C]12.5[/C][C]10.9377[/C][C]1.56226[/C][/ROW]
[ROW][C]44[/C][C]7.6[/C][C]9.14149[/C][C]-1.54149[/C][/ROW]
[ROW][C]45[/C][C]9.2[/C][C]8.88195[/C][C]0.318045[/C][/ROW]
[ROW][C]46[/C][C]14.5[/C][C]13.2511[/C][C]1.24891[/C][/ROW]
[ROW][C]47[/C][C]12.3[/C][C]13.2033[/C][C]-0.903278[/C][/ROW]
[ROW][C]48[/C][C]12.6[/C][C]12.1041[/C][C]0.495885[/C][/ROW]
[ROW][C]49[/C][C]13[/C][C]13.3027[/C][C]-0.302681[/C][/ROW]
[ROW][C]50[/C][C]12.6[/C][C]12.0277[/C][C]0.572289[/C][/ROW]
[ROW][C]51[/C][C]13.2[/C][C]9.94393[/C][C]3.25607[/C][/ROW]
[ROW][C]52[/C][C]7.7[/C][C]9.21033[/C][C]-1.51033[/C][/ROW]
[ROW][C]53[/C][C]10.5[/C][C]11.2789[/C][C]-0.778855[/C][/ROW]
[ROW][C]54[/C][C]10.9[/C][C]9.98614[/C][C]0.913861[/C][/ROW]
[ROW][C]55[/C][C]4.3[/C][C]6.98649[/C][C]-2.68649[/C][/ROW]
[ROW][C]56[/C][C]10.3[/C][C]10.4095[/C][C]-0.109458[/C][/ROW]
[ROW][C]57[/C][C]11.4[/C][C]11.2293[/C][C]0.17071[/C][/ROW]
[ROW][C]58[/C][C]5.6[/C][C]9.7778[/C][C]-4.1778[/C][/ROW]
[ROW][C]59[/C][C]8.8[/C][C]10.1093[/C][C]-1.30927[/C][/ROW]
[ROW][C]60[/C][C]9[/C][C]7.83542[/C][C]1.16458[/C][/ROW]
[ROW][C]61[/C][C]9.6[/C][C]11.1232[/C][C]-1.52325[/C][/ROW]
[ROW][C]62[/C][C]6.4[/C][C]7.58787[/C][C]-1.18787[/C][/ROW]
[ROW][C]63[/C][C]11.6[/C][C]9.26443[/C][C]2.33557[/C][/ROW]
[/TABLE]
Source: https://freestatistics.org/blog/index.php?pk=270146&T=4

Globally Unique Identifier (entire table): ba.freestatistics.org/blog/index.php?pk=270146&T=4

As an alternative you can also use a QR Code:  

The GUIDs for individual cells are displayed in the table below:

Multiple Linear Regression - Actuals, Interpolation, and Residuals
Time or IndexActualsInterpolationForecastResidualsPrediction Error
112.911.07261.82739
212.812.53530.264705
37.410.8775-3.47755
46.79.466-2.766
512.612.9194-0.319407
614.812.73912.06088
713.310.73522.56481
811.111.4355-0.335547
98.210.1688-1.96884
1011.410.75170.648335
116.410.0557-3.65567
121213.6274-1.62742
136.38.52448-2.22448
1411.310.46950.830498
1511.913.4296-1.52964
169.310.9162-1.61618
17108.946011.05399
1813.814.9239-1.12395
1910.812.065-1.26499
2011.711.7301-0.0300505
2110.912.617-1.71697
2216.115.52260.577378
239.98.81371.0863
2411.59.079432.42057
258.310.8581-2.55815
2611.710.90980.790163
2799.60785-0.60785
2810.810.26630.533689
2910.48.829731.57027
3012.711.071.62997
3111.811.08680.713207
321310.64422.35585
3310.811.8484-1.04836
3412.39.236633.06337
3511.310.86210.437938
3611.610.22061.37937
3710.910.89250.00747416
3812.110.61881.4812
3913.311.13112.16891
4010.19.617840.482158
4114.311.74482.55523
429.39.94002-0.640018
4312.510.93771.56226
447.69.14149-1.54149
459.28.881950.318045
4614.513.25111.24891
4712.313.2033-0.903278
4812.612.10410.495885
491313.3027-0.302681
5012.612.02770.572289
5113.29.943933.25607
527.79.21033-1.51033
5310.511.2789-0.778855
5410.99.986140.913861
554.36.98649-2.68649
5610.310.4095-0.109458
5711.411.22930.17071
585.69.7778-4.1778
598.810.1093-1.30927
6097.835421.16458
619.611.1232-1.52325
626.47.58787-1.18787
6311.69.264432.33557


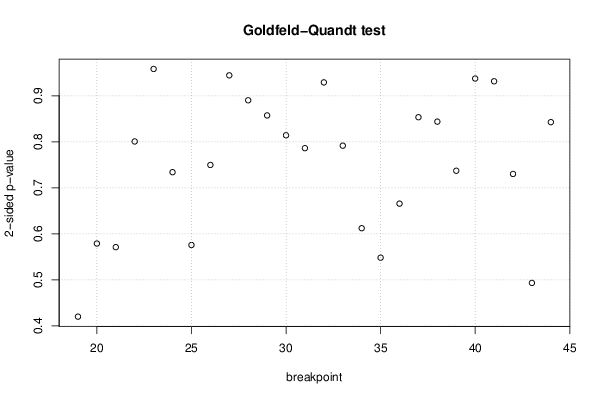
Goldfeld-Quandt test for Heteroskedasticity
p-valuesAlternative Hypothesis
breakpoint indexgreater2-sidedless
190.7899640.4200720.210036
200.7105410.5789190.289459
210.7144820.5710360.285518
220.5996340.8007320.400366
230.4791310.9582620.520869
240.6330310.7339380.366969
250.7121580.5756840.287842
260.6251580.7496830.374842
270.52780.9444010.4722
280.4451040.8902080.554896
290.4286470.8572940.571353
300.407070.814140.59293
310.3930530.7861050.606947
320.4645360.9290720.535464
330.3957670.7915330.604233
340.6938880.6122250.306112
350.7258950.5482090.274105
360.667190.6656190.33281
370.573320.8533590.42668
380.5780870.8438260.421913
390.6314520.7370960.368548
400.5312750.9374490.468725
410.4657180.9314370.534282
420.3650410.7300820.634959
430.2466640.4933290.753336
440.5786820.8426360.421318

\begin{tabular}{lllllllll}
\hline
Goldfeld-Quandt test for Heteroskedasticity \tabularnewline
p-values & Alternative Hypothesis \tabularnewline
breakpoint index & greater & 2-sided & less \tabularnewline
19 & 0.789964 & 0.420072 & 0.210036 \tabularnewline
20 & 0.710541 & 0.578919 & 0.289459 \tabularnewline
21 & 0.714482 & 0.571036 & 0.285518 \tabularnewline
22 & 0.599634 & 0.800732 & 0.400366 \tabularnewline
23 & 0.479131 & 0.958262 & 0.520869 \tabularnewline
24 & 0.633031 & 0.733938 & 0.366969 \tabularnewline
25 & 0.712158 & 0.575684 & 0.287842 \tabularnewline
26 & 0.625158 & 0.749683 & 0.374842 \tabularnewline
27 & 0.5278 & 0.944401 & 0.4722 \tabularnewline
28 & 0.445104 & 0.890208 & 0.554896 \tabularnewline
29 & 0.428647 & 0.857294 & 0.571353 \tabularnewline
30 & 0.40707 & 0.81414 & 0.59293 \tabularnewline
31 & 0.393053 & 0.786105 & 0.606947 \tabularnewline
32 & 0.464536 & 0.929072 & 0.535464 \tabularnewline
33 & 0.395767 & 0.791533 & 0.604233 \tabularnewline
34 & 0.693888 & 0.612225 & 0.306112 \tabularnewline
35 & 0.725895 & 0.548209 & 0.274105 \tabularnewline
36 & 0.66719 & 0.665619 & 0.33281 \tabularnewline
37 & 0.57332 & 0.853359 & 0.42668 \tabularnewline
38 & 0.578087 & 0.843826 & 0.421913 \tabularnewline
39 & 0.631452 & 0.737096 & 0.368548 \tabularnewline
40 & 0.531275 & 0.937449 & 0.468725 \tabularnewline
41 & 0.465718 & 0.931437 & 0.534282 \tabularnewline
42 & 0.365041 & 0.730082 & 0.634959 \tabularnewline
43 & 0.246664 & 0.493329 & 0.753336 \tabularnewline
44 & 0.578682 & 0.842636 & 0.421318 \tabularnewline
\hline
\end{tabular}
%Source: https://freestatistics.org/blog/index.php?pk=270146&T=5

[TABLE]
[ROW][C]Goldfeld-Quandt test for Heteroskedasticity[/C][/ROW]
[ROW][C]p-values[/C][C]Alternative Hypothesis[/C][/ROW]
[ROW][C]breakpoint index[/C][C]greater[/C][C]2-sided[/C][C]less[/C][/ROW]
[ROW][C]19[/C][C]0.789964[/C][C]0.420072[/C][C]0.210036[/C][/ROW]
[ROW][C]20[/C][C]0.710541[/C][C]0.578919[/C][C]0.289459[/C][/ROW]
[ROW][C]21[/C][C]0.714482[/C][C]0.571036[/C][C]0.285518[/C][/ROW]
[ROW][C]22[/C][C]0.599634[/C][C]0.800732[/C][C]0.400366[/C][/ROW]
[ROW][C]23[/C][C]0.479131[/C][C]0.958262[/C][C]0.520869[/C][/ROW]
[ROW][C]24[/C][C]0.633031[/C][C]0.733938[/C][C]0.366969[/C][/ROW]
[ROW][C]25[/C][C]0.712158[/C][C]0.575684[/C][C]0.287842[/C][/ROW]
[ROW][C]26[/C][C]0.625158[/C][C]0.749683[/C][C]0.374842[/C][/ROW]
[ROW][C]27[/C][C]0.5278[/C][C]0.944401[/C][C]0.4722[/C][/ROW]
[ROW][C]28[/C][C]0.445104[/C][C]0.890208[/C][C]0.554896[/C][/ROW]
[ROW][C]29[/C][C]0.428647[/C][C]0.857294[/C][C]0.571353[/C][/ROW]
[ROW][C]30[/C][C]0.40707[/C][C]0.81414[/C][C]0.59293[/C][/ROW]
[ROW][C]31[/C][C]0.393053[/C][C]0.786105[/C][C]0.606947[/C][/ROW]
[ROW][C]32[/C][C]0.464536[/C][C]0.929072[/C][C]0.535464[/C][/ROW]
[ROW][C]33[/C][C]0.395767[/C][C]0.791533[/C][C]0.604233[/C][/ROW]
[ROW][C]34[/C][C]0.693888[/C][C]0.612225[/C][C]0.306112[/C][/ROW]
[ROW][C]35[/C][C]0.725895[/C][C]0.548209[/C][C]0.274105[/C][/ROW]
[ROW][C]36[/C][C]0.66719[/C][C]0.665619[/C][C]0.33281[/C][/ROW]
[ROW][C]37[/C][C]0.57332[/C][C]0.853359[/C][C]0.42668[/C][/ROW]
[ROW][C]38[/C][C]0.578087[/C][C]0.843826[/C][C]0.421913[/C][/ROW]
[ROW][C]39[/C][C]0.631452[/C][C]0.737096[/C][C]0.368548[/C][/ROW]
[ROW][C]40[/C][C]0.531275[/C][C]0.937449[/C][C]0.468725[/C][/ROW]
[ROW][C]41[/C][C]0.465718[/C][C]0.931437[/C][C]0.534282[/C][/ROW]
[ROW][C]42[/C][C]0.365041[/C][C]0.730082[/C][C]0.634959[/C][/ROW]
[ROW][C]43[/C][C]0.246664[/C][C]0.493329[/C][C]0.753336[/C][/ROW]
[ROW][C]44[/C][C]0.578682[/C][C]0.842636[/C][C]0.421318[/C][/ROW]
[/TABLE]
Source: https://freestatistics.org/blog/index.php?pk=270146&T=5

Globally Unique Identifier (entire table): ba.freestatistics.org/blog/index.php?pk=270146&T=5

As an alternative you can also use a QR Code:  

The GUIDs for individual cells are displayed in the table below:

Goldfeld-Quandt test for Heteroskedasticity
p-valuesAlternative Hypothesis
breakpoint indexgreater2-sidedless
190.7899640.4200720.210036
200.7105410.5789190.289459
210.7144820.5710360.285518
220.5996340.8007320.400366
230.4791310.9582620.520869
240.6330310.7339380.366969
250.7121580.5756840.287842
260.6251580.7496830.374842
270.52780.9444010.4722
280.4451040.8902080.554896
290.4286470.8572940.571353
300.407070.814140.59293
310.3930530.7861050.606947
320.4645360.9290720.535464
330.3957670.7915330.604233
340.6938880.6122250.306112
350.7258950.5482090.274105
360.667190.6656190.33281
370.573320.8533590.42668
380.5780870.8438260.421913
390.6314520.7370960.368548
400.5312750.9374490.468725
410.4657180.9314370.534282
420.3650410.7300820.634959
430.2466640.4933290.753336
440.5786820.8426360.421318


Meta Analysis of Goldfeld-Quandt test for Heteroskedasticity
Description# significant tests% significant testsOK/NOK
1% type I error level00OK
5% type I error level00OK
10% type I error level00OK

\begin{tabular}{lllllllll}
\hline
Meta Analysis of Goldfeld-Quandt test for Heteroskedasticity \tabularnewline
Description & # significant tests & % significant tests & OK/NOK \tabularnewline
1% type I error level & 0 & 0 & OK \tabularnewline
5% type I error level & 0 & 0 & OK \tabularnewline
10% type I error level & 0 & 0 & OK \tabularnewline
\hline
\end{tabular}
%Source: https://freestatistics.org/blog/index.php?pk=270146&T=6

[TABLE]
[ROW][C]Meta Analysis of Goldfeld-Quandt test for Heteroskedasticity[/C][/ROW]
[ROW][C]Description[/C][C]# significant tests[/C][C]% significant tests[/C][C]OK/NOK[/C][/ROW]
[ROW][C]1% type I error level[/C][C]0[/C][C]0[/C][C]OK[/C][/ROW]
[ROW][C]5% type I error level[/C][C]0[/C][C]0[/C][C]OK[/C][/ROW]
[ROW][C]10% type I error level[/C][C]0[/C][C]0[/C][C]OK[/C][/ROW]
[/TABLE]
Source: https://freestatistics.org/blog/index.php?pk=270146&T=6

Globally Unique Identifier (entire table): ba.freestatistics.org/blog/index.php?pk=270146&T=6

As an alternative you can also use a QR Code:  

The GUIDs for individual cells are displayed in the table below:

Meta Analysis of Goldfeld-Quandt test for Heteroskedasticity
Description# significant tests% significant testsOK/NOK
1% type I error level00OK
5% type I error level00OK
10% type I error level00OK


Parameters (Session):
Parameters (R input):
par1 = 16 ; par2 = Do not include Seasonal Dummies ; par3 = No Linear Trend ;
R code (references can be found in the software module):
par3 <- 'No Linear Trend'
par2 <- 'Do not include Seasonal Dummies'
par1 <- '16'
library(lattice)
library(lmtest)
n25 <- 25 #minimum number of obs. for Goldfeld-Quandt test
par1 <- as.numeric(par1)
x <- t(y)
k <- length(x[1,])
n <- length(x[,1])
x1 <- cbind(x[,par1], x[,1:k!=par1])
mycolnames <- c(colnames(x)[par1], colnames(x)[1:k!=par1])
colnames(x1) <- mycolnames #colnames(x)[par1]
x <- x1
if (par3 == 'First Differences'){
x2 <- array(0, dim=c(n-1,k), dimnames=list(1:(n-1), paste('(1-B)',colnames(x),sep='')))
for (i in 1:n-1) {
for (j in 1:k) {
x2[i,j] <- x[i+1,j] - x[i,j]
}
}
x <- x2
}
if (par2 == 'Include Monthly Dummies'){
x2 <- array(0, dim=c(n,11), dimnames=list(1:n, paste('M', seq(1:11), sep ='')))
for (i in 1:11){
x2[seq(i,n,12),i] <- 1
}
x <- cbind(x, x2)
}
if (par2 == 'Include Quarterly Dummies'){
x2 <- array(0, dim=c(n,3), dimnames=list(1:n, paste('Q', seq(1:3), sep ='')))
for (i in 1:3){
x2[seq(i,n,4),i] <- 1
}
x <- cbind(x, x2)
}
k <- length(x[1,])
if (par3 == 'Linear Trend'){
x <- cbind(x, c(1:n))
colnames(x)[k+1] <- 't'
}
x
k <- length(x[1,])
df <- as.data.frame(x)
(mylm <- lm(df))
(mysum <- summary(mylm))
if (n > n25) {
kp3 <- k + 3
nmkm3 <- n - k - 3
gqarr <- array(NA, dim=c(nmkm3-kp3+1,3))
numgqtests <- 0
numsignificant1 <- 0
numsignificant5 <- 0
numsignificant10 <- 0
for (mypoint in kp3:nmkm3) {
j <- 0
numgqtests <- numgqtests + 1
for (myalt in c('greater', 'two.sided', 'less')) {
j <- j + 1
gqarr[mypoint-kp3+1,j] <- gqtest(mylm, point=mypoint, alternative=myalt)$p.value
}
if (gqarr[mypoint-kp3+1,2] < 0.01) numsignificant1 <- numsignificant1 + 1
if (gqarr[mypoint-kp3+1,2] < 0.05) numsignificant5 <- numsignificant5 + 1
if (gqarr[mypoint-kp3+1,2] < 0.10) numsignificant10 <- numsignificant10 + 1
}
gqarr
}
bitmap(file='test0.png')
plot(x[,1], type='l', main='Actuals and Interpolation', ylab='value of Actuals and Interpolation (dots)', xlab='time or index')
points(x[,1]-mysum$resid)
grid()
dev.off()
bitmap(file='test1.png')
plot(mysum$resid, type='b', pch=19, main='Residuals', ylab='value of Residuals', xlab='time or index')
grid()
dev.off()
bitmap(file='test2.png')
hist(mysum$resid, main='Residual Histogram', xlab='values of Residuals')
grid()
dev.off()
bitmap(file='test3.png')
densityplot(~mysum$resid,col='black',main='Residual Density Plot', xlab='values of Residuals')
dev.off()
bitmap(file='test4.png')
qqnorm(mysum$resid, main='Residual Normal Q-Q Plot')
qqline(mysum$resid)
grid()
dev.off()
(myerror <- as.ts(mysum$resid))
bitmap(file='test5.png')
dum <- cbind(lag(myerror,k=1),myerror)
dum
dum1 <- dum[2:length(myerror),]
dum1
z <- as.data.frame(dum1)
z
plot(z,main=paste('Residual Lag plot, lowess, and regression line'), ylab='values of Residuals', xlab='lagged values of Residuals')
lines(lowess(z))
abline(lm(z))
grid()
dev.off()
bitmap(file='test6.png')
acf(mysum$resid, lag.max=length(mysum$resid)/2, main='Residual Autocorrelation Function')
grid()
dev.off()
bitmap(file='test7.png')
pacf(mysum$resid, lag.max=length(mysum$resid)/2, main='Residual Partial Autocorrelation Function')
grid()
dev.off()
bitmap(file='test8.png')
opar <- par(mfrow = c(2,2), oma = c(0, 0, 1.1, 0))
plot(mylm, las = 1, sub='Residual Diagnostics')
par(opar)
dev.off()
if (n > n25) {
bitmap(file='test9.png')
plot(kp3:nmkm3,gqarr[,2], main='Goldfeld-Quandt test',ylab='2-sided p-value',xlab='breakpoint')
grid()
dev.off()
}
load(file='createtable')
a<-table.start()
a<-table.row.start(a)
a<-table.element(a, 'Multiple Linear Regression - Estimated Regression Equation', 1, TRUE)
a<-table.row.end(a)
myeq <- colnames(x)[1]
myeq <- paste(myeq, '[t] = ', sep='')
for (i in 1:k){
if (mysum$coefficients[i,1] > 0) myeq <- paste(myeq, '+', '')
myeq <- paste(myeq, signif(mysum$coefficients[i,1],6), sep=' ')
if (rownames(mysum$coefficients)[i] != '(Intercept)') {
myeq <- paste(myeq, rownames(mysum$coefficients)[i], sep='')
if (rownames(mysum$coefficients)[i] != 't') myeq <- paste(myeq, '[t]', sep='')
}
}
myeq <- paste(myeq, ' + e[t]')
a<-table.row.start(a)
a<-table.element(a, myeq)
a<-table.row.end(a)
a<-table.end(a)
table.save(a,file='mytable1.tab')
a<-table.start()
a<-table.row.start(a)
a<-table.element(a,hyperlink('ols1.htm','Multiple Linear Regression - Ordinary Least Squares',''), 6, TRUE)
a<-table.row.end(a)
a<-table.row.start(a)
a<-table.element(a,'Variable',header=TRUE)
a<-table.element(a,'Parameter',header=TRUE)
a<-table.element(a,'S.D.',header=TRUE)
a<-table.element(a,'T-STAT
H0: parameter = 0',header=TRUE)
a<-table.element(a,'2-tail p-value',header=TRUE)
a<-table.element(a,'1-tail p-value',header=TRUE)
a<-table.row.end(a)
for (i in 1:k){
a<-table.row.start(a)
a<-table.element(a,rownames(mysum$coefficients)[i],header=TRUE)
a<-table.element(a,signif(mysum$coefficients[i,1],6))
a<-table.element(a, signif(mysum$coefficients[i,2],6))
a<-table.element(a, signif(mysum$coefficients[i,3],4))
a<-table.element(a, signif(mysum$coefficients[i,4],6))
a<-table.element(a, signif(mysum$coefficients[i,4]/2,6))
a<-table.row.end(a)
}
a<-table.end(a)
table.save(a,file='mytable2.tab')
a<-table.start()
a<-table.row.start(a)
a<-table.element(a, 'Multiple Linear Regression - Regression Statistics', 2, TRUE)
a<-table.row.end(a)
a<-table.row.start(a)
a<-table.element(a, 'Multiple R',1,TRUE)
a<-table.element(a, signif(sqrt(mysum$r.squared),6))
a<-table.row.end(a)
a<-table.row.start(a)
a<-table.element(a, 'R-squared',1,TRUE)
a<-table.element(a, signif(mysum$r.squared,6))
a<-table.row.end(a)
a<-table.row.start(a)
a<-table.element(a, 'Adjusted R-squared',1,TRUE)
a<-table.element(a, signif(mysum$adj.r.squared,6))
a<-table.row.end(a)
a<-table.row.start(a)
a<-table.element(a, 'F-TEST (value)',1,TRUE)
a<-table.element(a, signif(mysum$fstatistic[1],6))
a<-table.row.end(a)
a<-table.row.start(a)
a<-table.element(a, 'F-TEST (DF numerator)',1,TRUE)
a<-table.element(a, signif(mysum$fstatistic[2],6))
a<-table.row.end(a)
a<-table.row.start(a)
a<-table.element(a, 'F-TEST (DF denominator)',1,TRUE)
a<-table.element(a, signif(mysum$fstatistic[3],6))
a<-table.row.end(a)
a<-table.row.start(a)
a<-table.element(a, 'p-value',1,TRUE)
a<-table.element(a, signif(1-pf(mysum$fstatistic[1],mysum$fstatistic[2],mysum$fstatistic[3]),6))
a<-table.row.end(a)
a<-table.row.start(a)
a<-table.element(a, 'Multiple Linear Regression - Residual Statistics', 2, TRUE)
a<-table.row.end(a)
a<-table.row.start(a)
a<-table.element(a, 'Residual Standard Deviation',1,TRUE)
a<-table.element(a, signif(mysum$sigma,6))
a<-table.row.end(a)
a<-table.row.start(a)
a<-table.element(a, 'Sum Squared Residuals',1,TRUE)
a<-table.element(a, signif(sum(myerror*myerror),6))
a<-table.row.end(a)
a<-table.end(a)
table.save(a,file='mytable3.tab')
a<-table.start()
a<-table.row.start(a)
a<-table.element(a, 'Multiple Linear Regression - Actuals, Interpolation, and Residuals', 4, TRUE)
a<-table.row.end(a)
a<-table.row.start(a)
a<-table.element(a, 'Time or Index', 1, TRUE)
a<-table.element(a, 'Actuals', 1, TRUE)
a<-table.element(a, 'Interpolation
Forecast', 1, TRUE)
a<-table.element(a, 'Residuals
Prediction Error', 1, TRUE)
a<-table.row.end(a)
for (i in 1:n) {
a<-table.row.start(a)
a<-table.element(a,i, 1, TRUE)
a<-table.element(a,signif(x[i],6))
a<-table.element(a,signif(x[i]-mysum$resid[i],6))
a<-table.element(a,signif(mysum$resid[i],6))
a<-table.row.end(a)
}
a<-table.end(a)
table.save(a,file='mytable4.tab')
if (n > n25) {
a<-table.start()
a<-table.row.start(a)
a<-table.element(a,'Goldfeld-Quandt test for Heteroskedasticity',4,TRUE)
a<-table.row.end(a)
a<-table.row.start(a)
a<-table.element(a,'p-values',header=TRUE)
a<-table.element(a,'Alternative Hypothesis',3,header=TRUE)
a<-table.row.end(a)
a<-table.row.start(a)
a<-table.element(a,'breakpoint index',header=TRUE)
a<-table.element(a,'greater',header=TRUE)
a<-table.element(a,'2-sided',header=TRUE)
a<-table.element(a,'less',header=TRUE)
a<-table.row.end(a)
for (mypoint in kp3:nmkm3) {
a<-table.row.start(a)
a<-table.element(a,mypoint,header=TRUE)
a<-table.element(a,signif(gqarr[mypoint-kp3+1,1],6))
a<-table.element(a,signif(gqarr[mypoint-kp3+1,2],6))
a<-table.element(a,signif(gqarr[mypoint-kp3+1,3],6))
a<-table.row.end(a)
}
a<-table.end(a)
table.save(a,file='mytable5.tab')
a<-table.start()
a<-table.row.start(a)
a<-table.element(a,'Meta Analysis of Goldfeld-Quandt test for Heteroskedasticity',4,TRUE)
a<-table.row.end(a)
a<-table.row.start(a)
a<-table.element(a,'Description',header=TRUE)
a<-table.element(a,'# significant tests',header=TRUE)
a<-table.element(a,'% significant tests',header=TRUE)
a<-table.element(a,'OK/NOK',header=TRUE)
a<-table.row.end(a)
a<-table.row.start(a)
a<-table.element(a,'1% type I error level',header=TRUE)
a<-table.element(a,signif(numsignificant1,6))
a<-table.element(a,signif(numsignificant1/numgqtests,6))
if (numsignificant1/numgqtests < 0.01) dum <- 'OK' else dum <- 'NOK'
a<-table.element(a,dum)
a<-table.row.end(a)
a<-table.row.start(a)
a<-table.element(a,'5% type I error level',header=TRUE)
a<-table.element(a,signif(numsignificant5,6))
a<-table.element(a,signif(numsignificant5/numgqtests,6))
if (numsignificant5/numgqtests < 0.05) dum <- 'OK' else dum <- 'NOK'
a<-table.element(a,dum)
a<-table.row.end(a)
a<-table.row.start(a)
a<-table.element(a,'10% type I error level',header=TRUE)
a<-table.element(a,signif(numsignificant10,6))
a<-table.element(a,signif(numsignificant10/numgqtests,6))
if (numsignificant10/numgqtests < 0.1) dum <- 'OK' else dum <- 'NOK'
a<-table.element(a,dum)
a<-table.row.end(a)
a<-table.end(a)
table.save(a,file='mytable6.tab')
}