Free Statistics

of Irreproducible Research!

Author's title

Author*The author of this computation has been verified*
R Software Modulerwasp_smp.wasp
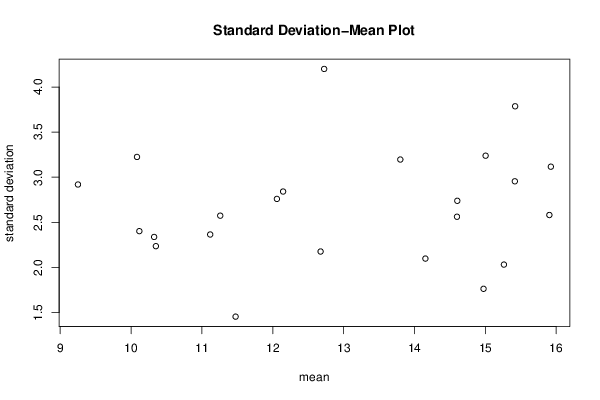
Title produced by softwareStandard Deviation-Mean Plot
Date of computationWed, 17 Dec 2014 13:47:32 +0000
Cite this page as followsStatistical Computations at FreeStatistics.org, Office for Research Development and Education, URL https://freestatistics.org/blog/index.php?v=date/2014/Dec/17/t1418824057td1uliulvnu4vjb.htm/, Retrieved Thu, 16 May 2024 03:41:47 +0000
Statistical Computations at FreeStatistics.org, Office for Research Development and Education, URL https://freestatistics.org/blog/index.php?pk=270264, Retrieved Thu, 16 May 2024 03:41:47 +0000
QR Codes:

Original text written by user:
IsPrivate?No (this computation is public)
User-defined keywords
Estimated Impact53
Family? (F = Feedback message, R = changed R code, M = changed R Module, P = changed Parameters, D = changed Data)
-       [Standard Deviation-Mean Plot] [] [2014-12-17 13:47:32] [72ee53c6f28232e74174360ca89644de] [Current]
Feedback Forum

Post a new message
Dataseries X:
12.9
12.8
14.8
12
6.3
11.3
9.3
10
10.8
13.4
11.5
8.3
11.7
10.4
11.8
11.3
12.7
5.7
8
12.5
7.6
9.2
11.1
12.2
12.3
11.4
8.8
12.6
13
13.2
9.9
10.5
13.4
10.9
10.3
11.4
8.6
13.2
8.8
9
10.3
8.5
13.5
4.9
6.4
9.6
11.6
16.6
19.1
13.35
18.4
16.15
18.4
16.35
17.65
14.35
14.75
9.9
16.85
15.6
14.85
11.75
18.45
17.1
19.9
18.45
15
11.35
18.1
19.1
7.6
13.4
13.9
15.25
16.1
17.35
13.15
12.15
18.2
13.6
14.75
14.1
14.9
16.25
13.6
15.65
14.6
19.2
11.9
13.2
16.35
15.65
17.75
7.65
19.3
15.2
17.1
19.05
18.55
19.1
11.85
13.35
11.4
19.9
17.6
16.1
11.95
15.15
16.85
7.7
12.6
12.35
16.65
13.95
15.7
15.35
15.1
17.75
14.6
16.65
12.2
7.4
6.7
12.6
13.3
11.1
8.2
11.4
6.4
10.6
11.9
9.6
6.4
13.8
13.8
11.7
10.9
16.1
9.9
9
9.7
10.8
10.3
12.7
9.3
5.9
11.4
13
10.8
12.3
11.8
7.9
12.3
11.6
6.7
10.9
12.1
13.3
10.1
14.3
13.3
9.3
15.9
9.1
13
14.5
14.6
12.6
7.7
4.3
11.8
11.2
12.6
5.6
9.9
7.7
7.3
11.4
13.6
7.9
10.7
8.3
9.6
14.2
11.1
4.35
12.7
18.1
17.85
12.6
17.1
16.1
14.7
10.6
12.6
16.2
13.6
18.9
14.1
14.5
14.75
14.8
12.45
12.65
17.35
8.6
16.1
11.6
17.75
15.25
17.65
13.6
18.25
16
18.25
14.6
13.85
18.95
15.9
16.1
10.95
15.1
15.95
14.6
15.4
15.4
17.6
13.35
15.35
19.1
12.9
12.6
10.35
15.4
9.6
14.85
19.25
13.6
12.75
9.85
12.65
16.6
11.2
15.25
12.4
15.85
18.15
11.15
12.35
15.6
15.6
18.4
13.1
12.85
9.5
4.5
13.6
11.7
12.4
14.9
11.2
14.6
14.05
13.35
11.85
14.75
13.2
7.85
7.85
10.95
9.95
14.9
13.4
16.85
10.95
12.2
15.2
8.1


Summary of computational transaction
Raw Inputview raw input (R code)
Raw Outputview raw output of R engine
Computing time1 seconds
R Server'Gertrude Mary Cox' @ cox.wessa.net

\begin{tabular}{lllllllll}
\hline
Summary of computational transaction \tabularnewline
Raw Input & view raw input (R code)  \tabularnewline
Raw Output & view raw output of R engine  \tabularnewline
Computing time & 1 seconds \tabularnewline
R Server & 'Gertrude Mary Cox' @ cox.wessa.net \tabularnewline
\hline
\end{tabular}
%Source: https://freestatistics.org/blog/index.php?pk=270264&T=0

[TABLE]
[ROW][C]Summary of computational transaction[/C][/ROW]
[ROW][C]Raw Input[/C][C]view raw input (R code) [/C][/ROW]
[ROW][C]Raw Output[/C][C]view raw output of R engine [/C][/ROW]
[ROW][C]Computing time[/C][C]1 seconds[/C][/ROW]
[ROW][C]R Server[/C][C]'Gertrude Mary Cox' @ cox.wessa.net[/C][/ROW]
[/TABLE]
Source: https://freestatistics.org/blog/index.php?pk=270264&T=0

Globally Unique Identifier (entire table): ba.freestatistics.org/blog/index.php?pk=270264&T=0

As an alternative you can also use a QR Code:  

The GUIDs for individual cells are displayed in the table below:

Summary of computational transaction
Raw Inputview raw input (R code)
Raw Outputview raw output of R engine
Computing time1 seconds
R Server'Gertrude Mary Cox' @ cox.wessa.net


Standard Deviation-Mean Plot
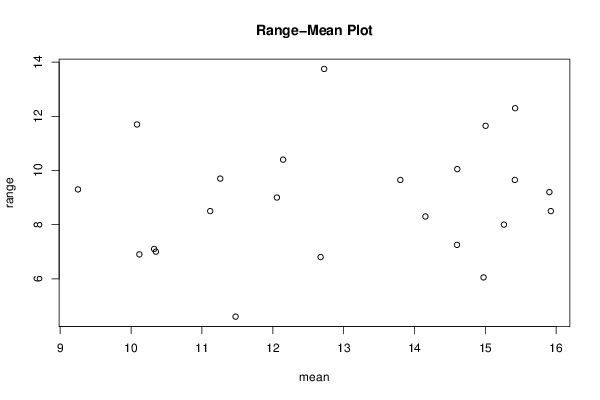
SectionMeanStandard DeviationRange
111.11666666666672.365215090481718.5
210.352.235864689351957
311.4751.454225817152464.6
410.08333333333333.2248561161231611.7
515.90416666666672.581178231080939.2
615.42083333333333.7869067692231212.3
714.9751.762939178036086.05
815.00416666666673.238859109830711.65
915.9253.116925933147488.5
1014.60416666666672.738733809406810.05
1110.11666666666672.402208579746166.9
1211.25833333333332.573804518017979.7
1310.3252.337879769830317.1
1412.6752.176371041226876.8
159.252.919371040605719.3
1612.7254.2007304559607713.75
1714.15416666666672.098100692329028.3
1815.41666666666672.955144461422969.65
1915.26252.031471141808328
2013.83.196517991929239.65
2114.62.56187076531627.25
2212.14583333333332.8416111253791910.4
2312.05833333333332.759597577162079

\begin{tabular}{lllllllll}
\hline
Standard Deviation-Mean Plot \tabularnewline
Section & Mean & Standard Deviation & Range \tabularnewline
1 & 11.1166666666667 & 2.36521509048171 & 8.5 \tabularnewline
2 & 10.35 & 2.23586468935195 & 7 \tabularnewline
3 & 11.475 & 1.45422581715246 & 4.6 \tabularnewline
4 & 10.0833333333333 & 3.22485611612316 & 11.7 \tabularnewline
5 & 15.9041666666667 & 2.58117823108093 & 9.2 \tabularnewline
6 & 15.4208333333333 & 3.78690676922312 & 12.3 \tabularnewline
7 & 14.975 & 1.76293917803608 & 6.05 \tabularnewline
8 & 15.0041666666667 & 3.2388591098307 & 11.65 \tabularnewline
9 & 15.925 & 3.11692593314748 & 8.5 \tabularnewline
10 & 14.6041666666667 & 2.7387338094068 & 10.05 \tabularnewline
11 & 10.1166666666667 & 2.40220857974616 & 6.9 \tabularnewline
12 & 11.2583333333333 & 2.57380451801797 & 9.7 \tabularnewline
13 & 10.325 & 2.33787976983031 & 7.1 \tabularnewline
14 & 12.675 & 2.17637104122687 & 6.8 \tabularnewline
15 & 9.25 & 2.91937104060571 & 9.3 \tabularnewline
16 & 12.725 & 4.20073045596077 & 13.75 \tabularnewline
17 & 14.1541666666667 & 2.09810069232902 & 8.3 \tabularnewline
18 & 15.4166666666667 & 2.95514446142296 & 9.65 \tabularnewline
19 & 15.2625 & 2.03147114180832 & 8 \tabularnewline
20 & 13.8 & 3.19651799192923 & 9.65 \tabularnewline
21 & 14.6 & 2.5618707653162 & 7.25 \tabularnewline
22 & 12.1458333333333 & 2.84161112537919 & 10.4 \tabularnewline
23 & 12.0583333333333 & 2.75959757716207 & 9 \tabularnewline
\hline
\end{tabular}
%Source: https://freestatistics.org/blog/index.php?pk=270264&T=1

[TABLE]
[ROW][C]Standard Deviation-Mean Plot[/C][/ROW]
[ROW][C]Section[/C][C]Mean[/C][C]Standard Deviation[/C][C]Range[/C][/ROW]
[ROW][C]1[/C][C]11.1166666666667[/C][C]2.36521509048171[/C][C]8.5[/C][/ROW]
[ROW][C]2[/C][C]10.35[/C][C]2.23586468935195[/C][C]7[/C][/ROW]
[ROW][C]3[/C][C]11.475[/C][C]1.45422581715246[/C][C]4.6[/C][/ROW]
[ROW][C]4[/C][C]10.0833333333333[/C][C]3.22485611612316[/C][C]11.7[/C][/ROW]
[ROW][C]5[/C][C]15.9041666666667[/C][C]2.58117823108093[/C][C]9.2[/C][/ROW]
[ROW][C]6[/C][C]15.4208333333333[/C][C]3.78690676922312[/C][C]12.3[/C][/ROW]
[ROW][C]7[/C][C]14.975[/C][C]1.76293917803608[/C][C]6.05[/C][/ROW]
[ROW][C]8[/C][C]15.0041666666667[/C][C]3.2388591098307[/C][C]11.65[/C][/ROW]
[ROW][C]9[/C][C]15.925[/C][C]3.11692593314748[/C][C]8.5[/C][/ROW]
[ROW][C]10[/C][C]14.6041666666667[/C][C]2.7387338094068[/C][C]10.05[/C][/ROW]
[ROW][C]11[/C][C]10.1166666666667[/C][C]2.40220857974616[/C][C]6.9[/C][/ROW]
[ROW][C]12[/C][C]11.2583333333333[/C][C]2.57380451801797[/C][C]9.7[/C][/ROW]
[ROW][C]13[/C][C]10.325[/C][C]2.33787976983031[/C][C]7.1[/C][/ROW]
[ROW][C]14[/C][C]12.675[/C][C]2.17637104122687[/C][C]6.8[/C][/ROW]
[ROW][C]15[/C][C]9.25[/C][C]2.91937104060571[/C][C]9.3[/C][/ROW]
[ROW][C]16[/C][C]12.725[/C][C]4.20073045596077[/C][C]13.75[/C][/ROW]
[ROW][C]17[/C][C]14.1541666666667[/C][C]2.09810069232902[/C][C]8.3[/C][/ROW]
[ROW][C]18[/C][C]15.4166666666667[/C][C]2.95514446142296[/C][C]9.65[/C][/ROW]
[ROW][C]19[/C][C]15.2625[/C][C]2.03147114180832[/C][C]8[/C][/ROW]
[ROW][C]20[/C][C]13.8[/C][C]3.19651799192923[/C][C]9.65[/C][/ROW]
[ROW][C]21[/C][C]14.6[/C][C]2.5618707653162[/C][C]7.25[/C][/ROW]
[ROW][C]22[/C][C]12.1458333333333[/C][C]2.84161112537919[/C][C]10.4[/C][/ROW]
[ROW][C]23[/C][C]12.0583333333333[/C][C]2.75959757716207[/C][C]9[/C][/ROW]
[/TABLE]
Source: https://freestatistics.org/blog/index.php?pk=270264&T=1

Globally Unique Identifier (entire table): ba.freestatistics.org/blog/index.php?pk=270264&T=1

As an alternative you can also use a QR Code:  

The GUIDs for individual cells are displayed in the table below:

Standard Deviation-Mean Plot
SectionMeanStandard DeviationRange
111.11666666666672.365215090481718.5
210.352.235864689351957
311.4751.454225817152464.6
410.08333333333333.2248561161231611.7
515.90416666666672.581178231080939.2
615.42083333333333.7869067692231212.3
714.9751.762939178036086.05
815.00416666666673.238859109830711.65
915.9253.116925933147488.5
1014.60416666666672.738733809406810.05
1110.11666666666672.402208579746166.9
1211.25833333333332.573804518017979.7
1310.3252.337879769830317.1
1412.6752.176371041226876.8
159.252.919371040605719.3
1612.7254.2007304559607713.75
1714.15416666666672.098100692329028.3
1815.41666666666672.955144461422969.65
1915.26252.031471141808328
2013.83.196517991929239.65
2114.62.56187076531627.25
2212.14583333333332.8416111253791910.4
2312.05833333333332.759597577162079


Regression: S.E.(k) = alpha + beta * Mean(k)
alpha2.12922775976167
beta0.0421507485624301
S.D.0.0620969753731166
T-STAT0.678789076427035
p-value0.504684163726919

\begin{tabular}{lllllllll}
\hline
Regression: S.E.(k) = alpha + beta * Mean(k) \tabularnewline
alpha & 2.12922775976167 \tabularnewline
beta & 0.0421507485624301 \tabularnewline
S.D. & 0.0620969753731166 \tabularnewline
T-STAT & 0.678789076427035 \tabularnewline
p-value & 0.504684163726919 \tabularnewline
\hline
\end{tabular}
%Source: https://freestatistics.org/blog/index.php?pk=270264&T=2

[TABLE]
[ROW][C]Regression: S.E.(k) = alpha + beta * Mean(k)[/C][/ROW]
[ROW][C]alpha[/C][C]2.12922775976167[/C][/ROW]
[ROW][C]beta[/C][C]0.0421507485624301[/C][/ROW]
[ROW][C]S.D.[/C][C]0.0620969753731166[/C][/ROW]
[ROW][C]T-STAT[/C][C]0.678789076427035[/C][/ROW]
[ROW][C]p-value[/C][C]0.504684163726919[/C][/ROW]
[/TABLE]
Source: https://freestatistics.org/blog/index.php?pk=270264&T=2

Globally Unique Identifier (entire table): ba.freestatistics.org/blog/index.php?pk=270264&T=2

As an alternative you can also use a QR Code:  

The GUIDs for individual cells are displayed in the table below:

Regression: S.E.(k) = alpha + beta * Mean(k)
alpha2.12922775976167
beta0.0421507485624301
S.D.0.0620969753731166
T-STAT0.678789076427035
p-value0.504684163726919


Regression: ln S.E.(k) = alpha + beta * ln Mean(k)
alpha0.514477739982913
beta0.173848482762984
S.D.0.299563631091447
T-STAT0.580339082316418
p-value0.567861712692116
Lambda0.826151517237016

\begin{tabular}{lllllllll}
\hline
Regression: ln S.E.(k) = alpha + beta * ln Mean(k) \tabularnewline
alpha & 0.514477739982913 \tabularnewline
beta & 0.173848482762984 \tabularnewline
S.D. & 0.299563631091447 \tabularnewline
T-STAT & 0.580339082316418 \tabularnewline
p-value & 0.567861712692116 \tabularnewline
Lambda & 0.826151517237016 \tabularnewline
\hline
\end{tabular}
%Source: https://freestatistics.org/blog/index.php?pk=270264&T=3

[TABLE]
[ROW][C]Regression: ln S.E.(k) = alpha + beta * ln Mean(k)[/C][/ROW]
[ROW][C]alpha[/C][C]0.514477739982913[/C][/ROW]
[ROW][C]beta[/C][C]0.173848482762984[/C][/ROW]
[ROW][C]S.D.[/C][C]0.299563631091447[/C][/ROW]
[ROW][C]T-STAT[/C][C]0.580339082316418[/C][/ROW]
[ROW][C]p-value[/C][C]0.567861712692116[/C][/ROW]
[ROW][C]Lambda[/C][C]0.826151517237016[/C][/ROW]
[/TABLE]
Source: https://freestatistics.org/blog/index.php?pk=270264&T=3

Globally Unique Identifier (entire table): ba.freestatistics.org/blog/index.php?pk=270264&T=3

As an alternative you can also use a QR Code:  

The GUIDs for individual cells are displayed in the table below:

Regression: ln S.E.(k) = alpha + beta * ln Mean(k)
alpha0.514477739982913
beta0.173848482762984
S.D.0.299563631091447
T-STAT0.580339082316418
p-value0.567861712692116
Lambda0.826151517237016


Parameters (Session):
par1 = 12 ;
Parameters (R input):
par1 = 12 ;
R code (references can be found in the software module):
par1 <- as.numeric(par1)
(n <- length(x))
(np <- floor(n / par1))
arr <- array(NA,dim=c(par1,np))
j <- 0
k <- 1
for (i in 1:(np*par1))
{
j = j + 1
arr[j,k] <- x[i]
if (j == par1) {
j = 0
k=k+1
}
}
arr
arr.mean <- array(NA,dim=np)
arr.sd <- array(NA,dim=np)
arr.range <- array(NA,dim=np)
for (j in 1:np)
{
arr.mean[j] <- mean(arr[,j],na.rm=TRUE)
arr.sd[j] <- sd(arr[,j],na.rm=TRUE)
arr.range[j] <- max(arr[,j],na.rm=TRUE) - min(arr[,j],na.rm=TRUE)
}
arr.mean
arr.sd
arr.range
(lm1 <- lm(arr.sd~arr.mean))
(lnlm1 <- lm(log(arr.sd)~log(arr.mean)))
(lm2 <- lm(arr.range~arr.mean))
bitmap(file='test1.png')
plot(arr.mean,arr.sd,main='Standard Deviation-Mean Plot',xlab='mean',ylab='standard deviation')
dev.off()
bitmap(file='test2.png')
plot(arr.mean,arr.range,main='Range-Mean Plot',xlab='mean',ylab='range')
dev.off()
load(file='createtable')
a<-table.start()
a<-table.row.start(a)
a<-table.element(a,'Standard Deviation-Mean Plot',4,TRUE)
a<-table.row.end(a)
a<-table.row.start(a)
a<-table.element(a,'Section',header=TRUE)
a<-table.element(a,'Mean',header=TRUE)
a<-table.element(a,'Standard Deviation',header=TRUE)
a<-table.element(a,'Range',header=TRUE)
a<-table.row.end(a)
for (j in 1:np) {
a<-table.row.start(a)
a<-table.element(a,j,header=TRUE)
a<-table.element(a,arr.mean[j])
a<-table.element(a,arr.sd[j] )
a<-table.element(a,arr.range[j] )
a<-table.row.end(a)
}
a<-table.end(a)
table.save(a,file='mytable.tab')
a<-table.start()
a<-table.row.start(a)
a<-table.element(a,'Regression: S.E.(k) = alpha + beta * Mean(k)',2,TRUE)
a<-table.row.end(a)
a<-table.row.start(a)
a<-table.element(a,'alpha',header=TRUE)
a<-table.element(a,lm1$coefficients[[1]])
a<-table.row.end(a)
a<-table.row.start(a)
a<-table.element(a,'beta',header=TRUE)
a<-table.element(a,lm1$coefficients[[2]])
a<-table.row.end(a)
a<-table.row.start(a)
a<-table.element(a,'S.D.',header=TRUE)
a<-table.element(a,summary(lm1)$coefficients[2,2])
a<-table.row.end(a)
a<-table.row.start(a)
a<-table.element(a,'T-STAT',header=TRUE)
a<-table.element(a,summary(lm1)$coefficients[2,3])
a<-table.row.end(a)
a<-table.row.start(a)
a<-table.element(a,'p-value',header=TRUE)
a<-table.element(a,summary(lm1)$coefficients[2,4])
a<-table.row.end(a)
a<-table.end(a)
table.save(a,file='mytable1.tab')
a<-table.start()
a<-table.row.start(a)
a<-table.element(a,'Regression: ln S.E.(k) = alpha + beta * ln Mean(k)',2,TRUE)
a<-table.row.end(a)
a<-table.row.start(a)
a<-table.element(a,'alpha',header=TRUE)
a<-table.element(a,lnlm1$coefficients[[1]])
a<-table.row.end(a)
a<-table.row.start(a)
a<-table.element(a,'beta',header=TRUE)
a<-table.element(a,lnlm1$coefficients[[2]])
a<-table.row.end(a)
a<-table.row.start(a)
a<-table.element(a,'S.D.',header=TRUE)
a<-table.element(a,summary(lnlm1)$coefficients[2,2])
a<-table.row.end(a)
a<-table.row.start(a)
a<-table.element(a,'T-STAT',header=TRUE)
a<-table.element(a,summary(lnlm1)$coefficients[2,3])
a<-table.row.end(a)
a<-table.row.start(a)
a<-table.element(a,'p-value',header=TRUE)
a<-table.element(a,summary(lnlm1)$coefficients[2,4])
a<-table.row.end(a)
a<-table.row.start(a)
a<-table.element(a,'Lambda',header=TRUE)
a<-table.element(a,1-lnlm1$coefficients[[2]])
a<-table.row.end(a)
a<-table.end(a)
table.save(a,file='mytable2.tab')