Free Statistics
of Irreproducible Research!
Description of Statistical Computation | |||||||||||||||||||||||||||||||||
|---|---|---|---|---|---|---|---|---|---|---|---|---|---|---|---|---|---|---|---|---|---|---|---|---|---|---|---|---|---|---|---|---|---|
| Author's title | |||||||||||||||||||||||||||||||||
| Author | *The author of this computation has been verified* | ||||||||||||||||||||||||||||||||
| R Software Module | rwasp_meanversusmedian.wasp | ||||||||||||||||||||||||||||||||
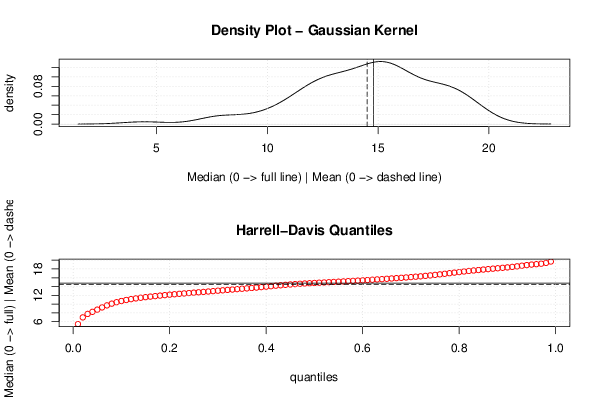
| Title produced by software | Mean versus Median | ||||||||||||||||||||||||||||||||
| Date of computation | Wed, 17 Dec 2014 13:59:30 +0000 | ||||||||||||||||||||||||||||||||
| Cite this page as follows | Statistical Computations at FreeStatistics.org, Office for Research Development and Education, URL https://freestatistics.org/blog/index.php?v=date/2014/Dec/17/t1418824827rnqt8j15ca7zgqp.htm/, Retrieved Thu, 16 May 2024 21:57:30 +0000 | ||||||||||||||||||||||||||||||||
| Statistical Computations at FreeStatistics.org, Office for Research Development and Education, URL https://freestatistics.org/blog/index.php?pk=270279, Retrieved Thu, 16 May 2024 21:57:30 +0000 | |||||||||||||||||||||||||||||||||
| QR Codes: | |||||||||||||||||||||||||||||||||
|
| |||||||||||||||||||||||||||||||||
| Original text written by user: | |||||||||||||||||||||||||||||||||
| IsPrivate? | No (this computation is public) | ||||||||||||||||||||||||||||||||
| User-defined keywords | |||||||||||||||||||||||||||||||||
| Estimated Impact | 72 | ||||||||||||||||||||||||||||||||
Tree of Dependent Computations | |||||||||||||||||||||||||||||||||
| Family? (F = Feedback message, R = changed R code, M = changed R Module, P = changed Parameters, D = changed Data) | |||||||||||||||||||||||||||||||||
| - [Mean versus Median] [mean median] [2014-12-17 13:59:30] [ec1b40d1a9751af99658fe8fca4f9eca] [Current] | |||||||||||||||||||||||||||||||||
| Feedback Forum | |||||||||||||||||||||||||||||||||
Post a new message | |||||||||||||||||||||||||||||||||
Dataset | |||||||||||||||||||||||||||||||||
| Dataseries X: | |||||||||||||||||||||||||||||||||
4.35 12.7 18.1 17.85 16.6 12.6 17.1 19.1 16.1 13.35 18.4 14.7 10.6 12.6 16.2 13.6 18.9 14.1 14.5 16.15 14.75 14.8 12.45 12.65 17.35 8.6 18.4 16.1 11.6 17.75 15.25 17.65 15.6 16.35 17.65 13.6 11.7 14.35 14.75 18.25 9.9 16 18.25 16.85 14.6 13.85 18.95 15.6 14.85 11.75 18.45 15.9 17.1 16.1 19.9 10.95 18.45 15.1 15 11.35 15.95 18.1 14.6 15.4 15.4 17.6 13.35 19.1 15.35 7.6 13.4 13.9 19.1 15.25 12.9 16.1 17.35 13.15 12.15 12.6 10.35 15.4 9.6 18.2 13.6 14.85 14.75 14.1 14.9 16.25 19.25 13.6 13.6 15.65 12.75 14.6 9.85 12.65 11.9 19.2 16.6 11.2 15.25 11.9 13.2 16.35 12.4 15.85 14.35 18.15 11.15 15.65 17.75 7.65 12.35 15.6 19.3 15.2 17.1 15.6 18.4 19.05 18.55 19.1 13.1 12.85 9.5 4.5 11.85 13.6 11.7 12.4 13.35 11.4 14.9 19.9 17.75 11.2 14.6 17.6 14.05 16.1 13.35 11.85 11.95 14.75 15.15 13.2 16.85 7.85 7.7 12.6 7.85 10.95 12.35 9.95 14.9 16.65 13.4 13.95 15.7 16.85 10.95 15.35 12.2 15.1 17.75 15.2 14.6 16.65 8.1 | |||||||||||||||||||||||||||||||||
Tables (Output of Computation) | |||||||||||||||||||||||||||||||||
| |||||||||||||||||||||||||||||||||
Figures (Output of Computation) | |||||||||||||||||||||||||||||||||
Input Parameters & R Code | |||||||||||||||||||||||||||||||||
| Parameters (Session): | |||||||||||||||||||||||||||||||||
| par1 = FALSE ; par2 = 1 ; par3 = 0 ; par4 = 0 ; par5 = 12 ; par6 = 2 ; par7 = 1 ; par8 = 0 ; par9 = 0 ; | |||||||||||||||||||||||||||||||||
| Parameters (R input): | |||||||||||||||||||||||||||||||||
| R code (references can be found in the software module): | |||||||||||||||||||||||||||||||||
library(Hmisc) | |||||||||||||||||||||||||||||||||