Free Statistics

of Irreproducible Research!

Author's title

Author*The author of this computation has been verified*
R Software Modulerwasp_notchedbox1.wasp
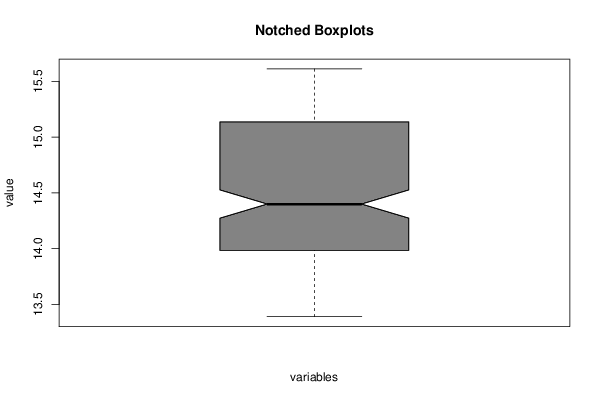
Title produced by softwareNotched Boxplots
Date of computationThu, 18 Dec 2014 09:08:24 +0000
Cite this page as followsStatistical Computations at FreeStatistics.org, Office for Research Development and Education, URL https://freestatistics.org/blog/index.php?v=date/2014/Dec/18/t14188937367o1mw6ahmrmss1v.htm/, Retrieved Fri, 17 May 2024 16:35:19 +0000
Statistical Computations at FreeStatistics.org, Office for Research Development and Education, URL https://freestatistics.org/blog/index.php?pk=270775, Retrieved Fri, 17 May 2024 16:35:19 +0000
QR Codes:

Original text written by user:
IsPrivate?No (this computation is public)
User-defined keywords
Estimated Impact131
Family? (F = Feedback message, R = changed R code, M = changed R Module, P = changed Parameters, D = changed Data)
-     [Multiple Regression] [Multipleregression] [2014-12-14 15:14:52] [7c87d1c7801dd67c2a0c90c2b6a05b3c]
- RMPD    [Notched Boxplots] [box] [2014-12-18 09:08:24] [21b927ddce509724d48ffb8407994bd0] [Current]
Feedback Forum

Post a new message
Dataseries X:
14,13506232
13,79067764
15,34497428
14,1515708
14,51198664
14,58727604
14,06511664
15,41313872
13,97735856
14,20624976
15,07231652
14,50486168
14,99880836
14,37565776
15,22111408
15,031348
13,898984
15,34319304
14,2535788
13,72963816
15,06341032
15,407795
15,1730206
13,7314194
14,85179204
14,07046036
14,52623656
13,75101304
14,1961018
15,522749
14,58727604
14,99524588
13,90741288
15,07231652
14,87316692
14,85179204
14,8767294
15,0094958
15,25899744
13,61290292
13,97557732
13,6828486
15,28215356
15,37929516
14,85713576
15,0847852
15,41135748
13,95194388
13,65969248
13,39415968
13,68997356
14,92708144
13,98092104
15,20508292
13,7047008
13,8245212
15,14048096
13,70422348
15,190833
14,8856356
14,99524588
15,465272
15,22823904
15,2175516
13,70648204
15,13869972
15,37038896
14,52089284
14,48657196
14,1386248
13,9791398
15,61228832
13,76930276
14,12259364
15,33606808
14,79965876
15,28927852
14,65798616
14,05621044
15,00415208
15,2839348
15,07231652
14,80678372
15,13691848
14,90036284
14,05621044
14,2139142
13,98982724
14,99880836
15,28571604
14,26782872
15,42026368
13,86240456
14,45629088
13,96085008
13,988046
13,6828486
15,13869972
15,60872584
15,15651212
15,15473088
14,69717344
14,0544292
15,3235994
15,54590512
14,25714128
15,47061572
15,03265192
14,07046036
15,34675552
13,72607568
13,9127566
15,14760592
14,3555868
15,29996596
14,02545204
15,45814704
14,46697832
13,96845236
13,84815464
15,55659256
14,41662628
14,24289136
15,60516336
13,70648204
13,68819232
14,34311812
14,46519708
15,02018324
13,70291956
15,03443316
15,35744296
14,03305432
15,21577036
13,59152804
14,26960996
15,00237084
14,8945418
14,31461828
14,1208124
13,53583228
13,93639004
14,92886268
14,18897684
14,09765628
14,21747668
14,10834372
15,34675552
14,47130524
13,8374672
15,44924084
14,40059512
13,61468416
15,35744296
14,13506232
15,3325056
13,93769396
14,743963
15,54768636
14,26782872
14,03839804
13,79958384
13,74566932
14,84953348
14,5537196
13,93591272
15,22467656
13,98270228
14,86069824
13,94303768
13,7403256
13,3905972
14,11368744
13,97735856
14,40059512
14,39703264
13,97557732
15,40601376
13,99517096
14,81212744
15,3592242
14,34846184
14,47410328
14,20144552
14,01832708
14,275431
14,26426624
14,12615612
15,60872584
14,00407716
13,78177144
14,11903116
15,54234264
13,96797504
13,89138172
14,25179756
14,12615612
14,88207312
14,15999968
14,18897684
15,05272288
15,16719956
13,72429444
13,92878776
13,99160848
13,67216116
15,26790364


Summary of computational transaction
Raw Inputview raw input (R code)
Raw Outputview raw output of R engine
Computing time3 seconds
R Server'Gwilym Jenkins' @ jenkins.wessa.net

\begin{tabular}{lllllllll}
\hline
Summary of computational transaction \tabularnewline
Raw Input & view raw input (R code)  \tabularnewline
Raw Output & view raw output of R engine  \tabularnewline
Computing time & 3 seconds \tabularnewline
R Server & 'Gwilym Jenkins' @ jenkins.wessa.net \tabularnewline
\hline
\end{tabular}
%Source: https://freestatistics.org/blog/index.php?pk=270775&T=0

[TABLE]
[ROW][C]Summary of computational transaction[/C][/ROW]
[ROW][C]Raw Input[/C][C]view raw input (R code) [/C][/ROW]
[ROW][C]Raw Output[/C][C]view raw output of R engine [/C][/ROW]
[ROW][C]Computing time[/C][C]3 seconds[/C][/ROW]
[ROW][C]R Server[/C][C]'Gwilym Jenkins' @ jenkins.wessa.net[/C][/ROW]
[/TABLE]
Source: https://freestatistics.org/blog/index.php?pk=270775&T=0

Globally Unique Identifier (entire table): ba.freestatistics.org/blog/index.php?pk=270775&T=0

As an alternative you can also use a QR Code:  

The GUIDs for individual cells are displayed in the table below:

Summary of computational transaction
Raw Inputview raw input (R code)
Raw Outputview raw output of R engine
Computing time3 seconds
R Server'Gwilym Jenkins' @ jenkins.wessa.net


Boxplot statistics
Variablelower whiskerlower hingemedianupper hingeupper whisker
Forecast13.390597213.9853741414.4005951215.137809115.61228832

\begin{tabular}{lllllllll}
\hline
Boxplot statistics \tabularnewline
Variable & lower whisker & lower hinge & median & upper hinge & upper whisker \tabularnewline
Forecast & 13.3905972 & 13.98537414 & 14.40059512 & 15.1378091 & 15.61228832 \tabularnewline
\hline
\end{tabular}
%Source: https://freestatistics.org/blog/index.php?pk=270775&T=1

[TABLE]
[ROW][C]Boxplot statistics[/C][/ROW]
[ROW][C]Variable[/C][C]lower whisker[/C][C]lower hinge[/C][C]median[/C][C]upper hinge[/C][C]upper whisker[/C][/ROW]
[ROW][C]Forecast[/C][C]13.3905972[/C][C]13.98537414[/C][C]14.40059512[/C][C]15.1378091[/C][C]15.61228832[/C][/ROW]
[/TABLE]
Source: https://freestatistics.org/blog/index.php?pk=270775&T=1

Globally Unique Identifier (entire table): ba.freestatistics.org/blog/index.php?pk=270775&T=1

As an alternative you can also use a QR Code:  

The GUIDs for individual cells are displayed in the table below:

Boxplot statistics
Variablelower whiskerlower hingemedianupper hingeupper whisker
Forecast13.390597213.9853741414.4005951215.137809115.61228832


Boxplot Notches
Variablelower boundmedianupper bound
Forecast14.274037488443714.4005951214.5271527515563

\begin{tabular}{lllllllll}
\hline
Boxplot Notches \tabularnewline
Variable & lower bound & median & upper bound \tabularnewline
Forecast & 14.2740374884437 & 14.40059512 & 14.5271527515563 \tabularnewline
\hline
\end{tabular}
%Source: https://freestatistics.org/blog/index.php?pk=270775&T=2

[TABLE]
[ROW][C]Boxplot Notches[/C][/ROW]
[ROW][C]Variable[/C][C]lower bound[/C][C]median[/C][C]upper bound[/C][/ROW]
[ROW][C]Forecast[/C][C]14.2740374884437[/C][C]14.40059512[/C][C]14.5271527515563[/C][/ROW]
[/TABLE]
Source: https://freestatistics.org/blog/index.php?pk=270775&T=2

Globally Unique Identifier (entire table): ba.freestatistics.org/blog/index.php?pk=270775&T=2

As an alternative you can also use a QR Code:  

The GUIDs for individual cells are displayed in the table below:

Boxplot Notches
Variablelower boundmedianupper bound
Forecast14.274037488443714.4005951214.5271527515563


Parameters (Session):
par1 = grey ;
Parameters (R input):
par1 = grey ;
R code (references can be found in the software module):
z <- as.data.frame(t(y))
bitmap(file='test1.png')
(r<-boxplot(z ,xlab=xlab,ylab=ylab,main=main,notch=TRUE,col=par1))
dev.off()
load(file='createtable')
a<-table.start()
a<-table.row.start(a)
a<-table.element(a,hyperlink('overview.htm','Boxplot statistics','Boxplot overview'),6,TRUE)
a<-table.row.end(a)
a<-table.row.start(a)
a<-table.element(a,'Variable',1,TRUE)
a<-table.element(a,hyperlink('lower_whisker.htm','lower whisker','definition of lower whisker'),1,TRUE)
a<-table.element(a,hyperlink('lower_hinge.htm','lower hinge','definition of lower hinge'),1,TRUE)
a<-table.element(a,hyperlink('central_tendency.htm','median','definitions about measures of central tendency'),1,TRUE)
a<-table.element(a,hyperlink('upper_hinge.htm','upper hinge','definition of upper hinge'),1,TRUE)
a<-table.element(a,hyperlink('upper_whisker.htm','upper whisker','definition of upper whisker'),1,TRUE)
a<-table.row.end(a)
for (i in 1:length(y[,1]))
{
a<-table.row.start(a)
a<-table.element(a,dimnames(t(x))[[2]][i],1,TRUE)
for (j in 1:5)
{
a<-table.element(a,r$stats[j,i])
}
a<-table.row.end(a)
}
a<-table.end(a)
table.save(a,file='mytable.tab')
a<-table.start()
a<-table.row.start(a)
a<-table.element(a,'Boxplot Notches',4,TRUE)
a<-table.row.end(a)
a<-table.row.start(a)
a<-table.element(a,'Variable',1,TRUE)
a<-table.element(a,'lower bound',1,TRUE)
a<-table.element(a,'median',1,TRUE)
a<-table.element(a,'upper bound',1,TRUE)
a<-table.row.end(a)
for (i in 1:length(y[,1]))
{
a<-table.row.start(a)
a<-table.element(a,dimnames(t(x))[[2]][i],1,TRUE)
a<-table.element(a,r$conf[1,i])
a<-table.element(a,r$stats[3,i])
a<-table.element(a,r$conf[2,i])
a<-table.row.end(a)
}
a<-table.end(a)
table.save(a,file='mytable1.tab')