Free Statistics

of Irreproducible Research!

Author's title

Author*The author of this computation has been verified*
R Software Modulerwasp_multipleregression.wasp
Title produced by softwareMultiple Regression
Date of computationThu, 18 Dec 2014 13:09:25 +0000
Cite this page as followsStatistical Computations at FreeStatistics.org, Office for Research Development and Education, URL https://freestatistics.org/blog/index.php?v=date/2014/Dec/18/t1418908217x0x4xtfnthid4jb.htm/, Retrieved Fri, 17 May 2024 16:57:26 +0000
Statistical Computations at FreeStatistics.org, Office for Research Development and Education, URL https://freestatistics.org/blog/index.php?pk=270892, Retrieved Fri, 17 May 2024 16:57:26 +0000
QR Codes:

Original text written by user:
IsPrivate?No (this computation is public)
User-defined keywords
Estimated Impact68
Family? (F = Feedback message, R = changed R code, M = changed R Module, P = changed Parameters, D = changed Data)
-       [Multiple Regression] [] [2014-12-18 13:09:25] [dc060611fd89d91eb1d5c55ae338991b] [Current]
Feedback Forum

Post a new message
Dataseries X:
12 13 26 7.5
11 11 37 6.5
13 14 67 1.0
11 15 43 1.0
10 14 52 5.5
7 11 52 8.5
10 13 43 6.5
15 16 84 4.5
12 14 67 2.0
12 14 49 5.0
10 15 70 0.5
14 13 58 5.0
6 14 68 2.5
12 11 62 5.0
14 12 43 5.5
11 14 56 3.5
12 12 74 4.0
13 15 63 6.5
11 14 58 4.5
7 12 63 5.5
11 12 53 4.0
7 12 57 7.5
12 14 64 4.0
13 16 53 5.5
9 12 29 2.5
11 12 54 5.5
12 14 58 3.5
12 15 51 4.5
5 14 54 4.5
13 13 56 6.0
6 16 47 5.0
6 15 50 6.5
12 13 35 5.0
11 16 30 6.0
6 16 68 4.5
11 15 56 5.0
12 13 43 5.0
13 12 67 6.5
14 14 62 7.0
12 14 57 4.5
14 10 54 8.5
11 16 61 3.5
10 14 56 6.0
7 14 41 1.5
7 15 53 3.5
10 16 46 7.5
12 15 51 5.0
5 13 37 6.5
10 12 42 6.5
12 12 38 6.5
11 14 66 7.0
12 15 53 1.5
11 11 49 4.0
12 14 49 4.5
10 16 59 0.0
9 13 40 3.5
7 11 63 4.5
9 12 34 0.0
10 12 32 3.0
12 14 67 3.5
14 12 61 3.0
9 13 60 1.0
12 14 63 5.5


Summary of computational transaction
Raw Inputview raw input (R code)
Raw Outputview raw output of R engine
Computing time5 seconds
R Server'George Udny Yule' @ yule.wessa.net

\begin{tabular}{lllllllll}
\hline
Summary of computational transaction \tabularnewline
Raw Input & view raw input (R code)  \tabularnewline
Raw Output & view raw output of R engine  \tabularnewline
Computing time & 5 seconds \tabularnewline
R Server & 'George Udny Yule' @ yule.wessa.net \tabularnewline
\hline
\end{tabular}
%Source: https://freestatistics.org/blog/index.php?pk=270892&T=0

[TABLE]
[ROW][C]Summary of computational transaction[/C][/ROW]
[ROW][C]Raw Input[/C][C]view raw input (R code) [/C][/ROW]
[ROW][C]Raw Output[/C][C]view raw output of R engine [/C][/ROW]
[ROW][C]Computing time[/C][C]5 seconds[/C][/ROW]
[ROW][C]R Server[/C][C]'George Udny Yule' @ yule.wessa.net[/C][/ROW]
[/TABLE]
Source: https://freestatistics.org/blog/index.php?pk=270892&T=0

Globally Unique Identifier (entire table): ba.freestatistics.org/blog/index.php?pk=270892&T=0

As an alternative you can also use a QR Code:  

The GUIDs for individual cells are displayed in the table below:

Summary of computational transaction
Raw Inputview raw input (R code)
Raw Outputview raw output of R engine
Computing time5 seconds
R Server'George Udny Yule' @ yule.wessa.net


Multiple Linear Regression - Estimated Regression Equation
Ex[t] = + 8.57311 + 0.0603715CONFSOFTTOT[t] -0.273106STRESSTOT[t] -0.0174163AMS.I[t] + e[t]

\begin{tabular}{lllllllll}
\hline
Multiple Linear Regression - Estimated Regression Equation \tabularnewline
Ex[t] =  +  8.57311 +  0.0603715CONFSOFTTOT[t] -0.273106STRESSTOT[t] -0.0174163AMS.I[t]  + e[t] \tabularnewline
\hline
\end{tabular}
%Source: https://freestatistics.org/blog/index.php?pk=270892&T=1

[TABLE]
[ROW][C]Multiple Linear Regression - Estimated Regression Equation[/C][/ROW]
[ROW][C]Ex[t] =  +  8.57311 +  0.0603715CONFSOFTTOT[t] -0.273106STRESSTOT[t] -0.0174163AMS.I[t]  + e[t][/C][/ROW]
[/TABLE]
Source: https://freestatistics.org/blog/index.php?pk=270892&T=1

Globally Unique Identifier (entire table): ba.freestatistics.org/blog/index.php?pk=270892&T=1

As an alternative you can also use a QR Code:  

The GUIDs for individual cells are displayed in the table below:

Multiple Linear Regression - Estimated Regression Equation
Ex[t] = + 8.57311 + 0.0603715CONFSOFTTOT[t] -0.273106STRESSTOT[t] -0.0174163AMS.I[t] + e[t]


Multiple Linear Regression - Ordinary Least Squares
VariableParameterS.D.T-STATH0: parameter = 02-tail p-value1-tail p-value
(Intercept)8.573112.573563.3310.001495850.000747926
CONFSOFTTOT0.06037150.1049890.5750.5674590.28373
STRESSTOT-0.2731060.168048-1.6250.1094580.0547288
AMS.I-0.01741630.0222231-0.78370.436350.218175

\begin{tabular}{lllllllll}
\hline
Multiple Linear Regression - Ordinary Least Squares \tabularnewline
Variable & Parameter & S.D. & T-STATH0: parameter = 0 & 2-tail p-value & 1-tail p-value \tabularnewline
(Intercept) & 8.57311 & 2.57356 & 3.331 & 0.00149585 & 0.000747926 \tabularnewline
CONFSOFTTOT & 0.0603715 & 0.104989 & 0.575 & 0.567459 & 0.28373 \tabularnewline
STRESSTOT & -0.273106 & 0.168048 & -1.625 & 0.109458 & 0.0547288 \tabularnewline
AMS.I & -0.0174163 & 0.0222231 & -0.7837 & 0.43635 & 0.218175 \tabularnewline
\hline
\end{tabular}
%Source: https://freestatistics.org/blog/index.php?pk=270892&T=2

[TABLE]
[ROW][C]Multiple Linear Regression - Ordinary Least Squares[/C][/ROW]
[ROW][C]Variable[/C][C]Parameter[/C][C]S.D.[/C][C]T-STATH0: parameter = 0[/C][C]2-tail p-value[/C][C]1-tail p-value[/C][/ROW]
[ROW][C](Intercept)[/C][C]8.57311[/C][C]2.57356[/C][C]3.331[/C][C]0.00149585[/C][C]0.000747926[/C][/ROW]
[ROW][C]CONFSOFTTOT[/C][C]0.0603715[/C][C]0.104989[/C][C]0.575[/C][C]0.567459[/C][C]0.28373[/C][/ROW]
[ROW][C]STRESSTOT[/C][C]-0.273106[/C][C]0.168048[/C][C]-1.625[/C][C]0.109458[/C][C]0.0547288[/C][/ROW]
[ROW][C]AMS.I[/C][C]-0.0174163[/C][C]0.0222231[/C][C]-0.7837[/C][C]0.43635[/C][C]0.218175[/C][/ROW]
[/TABLE]
Source: https://freestatistics.org/blog/index.php?pk=270892&T=2

Globally Unique Identifier (entire table): ba.freestatistics.org/blog/index.php?pk=270892&T=2

As an alternative you can also use a QR Code:  

The GUIDs for individual cells are displayed in the table below:

Multiple Linear Regression - Ordinary Least Squares
VariableParameterS.D.T-STATH0: parameter = 02-tail p-value1-tail p-value
(Intercept)8.573112.573563.3310.001495850.000747926
CONFSOFTTOT0.06037150.1049890.5750.5674590.28373
STRESSTOT-0.2731060.168048-1.6250.1094580.0547288
AMS.I-0.01741630.0222231-0.78370.436350.218175


Multiple Linear Regression - Regression Statistics
Multiple R0.258743
R-squared0.0669478
Adjusted R-squared0.0195045
F-TEST (value)1.41111
F-TEST (DF numerator)3
F-TEST (DF denominator)59
p-value0.24853
Multiple Linear Regression - Residual Statistics
Residual Standard Deviation2.00725
Sum Squared Residuals237.714

\begin{tabular}{lllllllll}
\hline
Multiple Linear Regression - Regression Statistics \tabularnewline
Multiple R & 0.258743 \tabularnewline
R-squared & 0.0669478 \tabularnewline
Adjusted R-squared & 0.0195045 \tabularnewline
F-TEST (value) & 1.41111 \tabularnewline
F-TEST (DF numerator) & 3 \tabularnewline
F-TEST (DF denominator) & 59 \tabularnewline
p-value & 0.24853 \tabularnewline
Multiple Linear Regression - Residual Statistics \tabularnewline
Residual Standard Deviation & 2.00725 \tabularnewline
Sum Squared Residuals & 237.714 \tabularnewline
\hline
\end{tabular}
%Source: https://freestatistics.org/blog/index.php?pk=270892&T=3

[TABLE]
[ROW][C]Multiple Linear Regression - Regression Statistics[/C][/ROW]
[ROW][C]Multiple R[/C][C]0.258743[/C][/ROW]
[ROW][C]R-squared[/C][C]0.0669478[/C][/ROW]
[ROW][C]Adjusted R-squared[/C][C]0.0195045[/C][/ROW]
[ROW][C]F-TEST (value)[/C][C]1.41111[/C][/ROW]
[ROW][C]F-TEST (DF numerator)[/C][C]3[/C][/ROW]
[ROW][C]F-TEST (DF denominator)[/C][C]59[/C][/ROW]
[ROW][C]p-value[/C][C]0.24853[/C][/ROW]
[ROW][C]Multiple Linear Regression - Residual Statistics[/C][/ROW]
[ROW][C]Residual Standard Deviation[/C][C]2.00725[/C][/ROW]
[ROW][C]Sum Squared Residuals[/C][C]237.714[/C][/ROW]
[/TABLE]
Source: https://freestatistics.org/blog/index.php?pk=270892&T=3

Globally Unique Identifier (entire table): ba.freestatistics.org/blog/index.php?pk=270892&T=3

As an alternative you can also use a QR Code:  

The GUIDs for individual cells are displayed in the table below:

Multiple Linear Regression - Regression Statistics
Multiple R0.258743
R-squared0.0669478
Adjusted R-squared0.0195045
F-TEST (value)1.41111
F-TEST (DF numerator)3
F-TEST (DF denominator)59
p-value0.24853
Multiple Linear Regression - Residual Statistics
Residual Standard Deviation2.00725
Sum Squared Residuals237.714


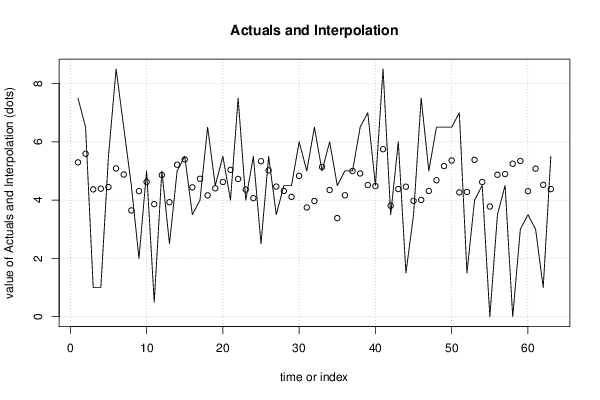
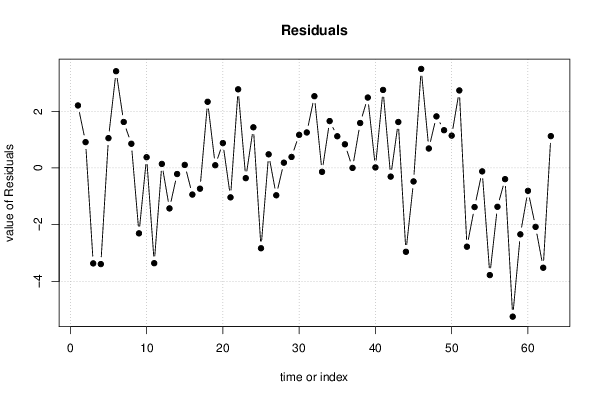
Multiple Linear Regression - Actuals, Interpolation, and Residuals
Time or IndexActualsInterpolationForecastResidualsPrediction Error
17.55.294372.20563
26.55.588630.911374
314.36756-3.36756
414.39171-3.39171
55.54.447691.05231
68.55.08593.4141
76.54.877551.62245
84.53.646020.853983
924.30719-2.30719
1054.620690.379315
110.53.86109-3.36109
1254.857790.142213
132.53.92755-1.42755
1455.21359-0.21359
155.55.392140.107863
163.54.4384-0.938399
1744.73149-0.731489
186.54.164122.33588
194.54.403570.0964333
205.54.621210.87879
2145.03686-1.03686
227.54.725712.77429
2344.35944-0.35944
245.54.065181.43482
252.55.33411-2.83411
265.55.019440.480557
273.54.46394-0.963938
284.54.312750.187253
294.54.1110.388997
3064.832251.16775
3153.747081.25292
326.53.967932.53207
3355.13762-0.137619
3464.345011.65499
354.53.381331.11867
3654.165290.834706
3754.998290.00171137
386.54.913771.58623
3974.515022.48498
404.54.481350.0186455
418.55.746772.75323
423.53.80511-0.305106
4364.378031.62197
441.54.45816-2.95816
453.53.97606-0.476056
467.54.005983.49402
4754.312750.687253
486.54.680191.81981
496.55.168071.33193
506.55.358481.14152
5174.264242.73576
521.54.27791-2.77791
5345.37963-1.37963
544.54.62069-0.120685
5503.77957-3.77957
563.54.86942-1.36942
574.54.89432-0.394316
5805.24703-5.24703
5935.34223-2.34223
603.54.30719-0.807191
6135.07864-2.07864
6214.5211-3.5211
635.54.376861.12314

\begin{tabular}{lllllllll}
\hline
Multiple Linear Regression - Actuals, Interpolation, and Residuals \tabularnewline
Time or Index & Actuals & InterpolationForecast & ResidualsPrediction Error \tabularnewline
1 & 7.5 & 5.29437 & 2.20563 \tabularnewline
2 & 6.5 & 5.58863 & 0.911374 \tabularnewline
3 & 1 & 4.36756 & -3.36756 \tabularnewline
4 & 1 & 4.39171 & -3.39171 \tabularnewline
5 & 5.5 & 4.44769 & 1.05231 \tabularnewline
6 & 8.5 & 5.0859 & 3.4141 \tabularnewline
7 & 6.5 & 4.87755 & 1.62245 \tabularnewline
8 & 4.5 & 3.64602 & 0.853983 \tabularnewline
9 & 2 & 4.30719 & -2.30719 \tabularnewline
10 & 5 & 4.62069 & 0.379315 \tabularnewline
11 & 0.5 & 3.86109 & -3.36109 \tabularnewline
12 & 5 & 4.85779 & 0.142213 \tabularnewline
13 & 2.5 & 3.92755 & -1.42755 \tabularnewline
14 & 5 & 5.21359 & -0.21359 \tabularnewline
15 & 5.5 & 5.39214 & 0.107863 \tabularnewline
16 & 3.5 & 4.4384 & -0.938399 \tabularnewline
17 & 4 & 4.73149 & -0.731489 \tabularnewline
18 & 6.5 & 4.16412 & 2.33588 \tabularnewline
19 & 4.5 & 4.40357 & 0.0964333 \tabularnewline
20 & 5.5 & 4.62121 & 0.87879 \tabularnewline
21 & 4 & 5.03686 & -1.03686 \tabularnewline
22 & 7.5 & 4.72571 & 2.77429 \tabularnewline
23 & 4 & 4.35944 & -0.35944 \tabularnewline
24 & 5.5 & 4.06518 & 1.43482 \tabularnewline
25 & 2.5 & 5.33411 & -2.83411 \tabularnewline
26 & 5.5 & 5.01944 & 0.480557 \tabularnewline
27 & 3.5 & 4.46394 & -0.963938 \tabularnewline
28 & 4.5 & 4.31275 & 0.187253 \tabularnewline
29 & 4.5 & 4.111 & 0.388997 \tabularnewline
30 & 6 & 4.83225 & 1.16775 \tabularnewline
31 & 5 & 3.74708 & 1.25292 \tabularnewline
32 & 6.5 & 3.96793 & 2.53207 \tabularnewline
33 & 5 & 5.13762 & -0.137619 \tabularnewline
34 & 6 & 4.34501 & 1.65499 \tabularnewline
35 & 4.5 & 3.38133 & 1.11867 \tabularnewline
36 & 5 & 4.16529 & 0.834706 \tabularnewline
37 & 5 & 4.99829 & 0.00171137 \tabularnewline
38 & 6.5 & 4.91377 & 1.58623 \tabularnewline
39 & 7 & 4.51502 & 2.48498 \tabularnewline
40 & 4.5 & 4.48135 & 0.0186455 \tabularnewline
41 & 8.5 & 5.74677 & 2.75323 \tabularnewline
42 & 3.5 & 3.80511 & -0.305106 \tabularnewline
43 & 6 & 4.37803 & 1.62197 \tabularnewline
44 & 1.5 & 4.45816 & -2.95816 \tabularnewline
45 & 3.5 & 3.97606 & -0.476056 \tabularnewline
46 & 7.5 & 4.00598 & 3.49402 \tabularnewline
47 & 5 & 4.31275 & 0.687253 \tabularnewline
48 & 6.5 & 4.68019 & 1.81981 \tabularnewline
49 & 6.5 & 5.16807 & 1.33193 \tabularnewline
50 & 6.5 & 5.35848 & 1.14152 \tabularnewline
51 & 7 & 4.26424 & 2.73576 \tabularnewline
52 & 1.5 & 4.27791 & -2.77791 \tabularnewline
53 & 4 & 5.37963 & -1.37963 \tabularnewline
54 & 4.5 & 4.62069 & -0.120685 \tabularnewline
55 & 0 & 3.77957 & -3.77957 \tabularnewline
56 & 3.5 & 4.86942 & -1.36942 \tabularnewline
57 & 4.5 & 4.89432 & -0.394316 \tabularnewline
58 & 0 & 5.24703 & -5.24703 \tabularnewline
59 & 3 & 5.34223 & -2.34223 \tabularnewline
60 & 3.5 & 4.30719 & -0.807191 \tabularnewline
61 & 3 & 5.07864 & -2.07864 \tabularnewline
62 & 1 & 4.5211 & -3.5211 \tabularnewline
63 & 5.5 & 4.37686 & 1.12314 \tabularnewline
\hline
\end{tabular}
%Source: https://freestatistics.org/blog/index.php?pk=270892&T=4

[TABLE]
[ROW][C]Multiple Linear Regression - Actuals, Interpolation, and Residuals[/C][/ROW]
[ROW][C]Time or Index[/C][C]Actuals[/C][C]InterpolationForecast[/C][C]ResidualsPrediction Error[/C][/ROW]
[ROW][C]1[/C][C]7.5[/C][C]5.29437[/C][C]2.20563[/C][/ROW]
[ROW][C]2[/C][C]6.5[/C][C]5.58863[/C][C]0.911374[/C][/ROW]
[ROW][C]3[/C][C]1[/C][C]4.36756[/C][C]-3.36756[/C][/ROW]
[ROW][C]4[/C][C]1[/C][C]4.39171[/C][C]-3.39171[/C][/ROW]
[ROW][C]5[/C][C]5.5[/C][C]4.44769[/C][C]1.05231[/C][/ROW]
[ROW][C]6[/C][C]8.5[/C][C]5.0859[/C][C]3.4141[/C][/ROW]
[ROW][C]7[/C][C]6.5[/C][C]4.87755[/C][C]1.62245[/C][/ROW]
[ROW][C]8[/C][C]4.5[/C][C]3.64602[/C][C]0.853983[/C][/ROW]
[ROW][C]9[/C][C]2[/C][C]4.30719[/C][C]-2.30719[/C][/ROW]
[ROW][C]10[/C][C]5[/C][C]4.62069[/C][C]0.379315[/C][/ROW]
[ROW][C]11[/C][C]0.5[/C][C]3.86109[/C][C]-3.36109[/C][/ROW]
[ROW][C]12[/C][C]5[/C][C]4.85779[/C][C]0.142213[/C][/ROW]
[ROW][C]13[/C][C]2.5[/C][C]3.92755[/C][C]-1.42755[/C][/ROW]
[ROW][C]14[/C][C]5[/C][C]5.21359[/C][C]-0.21359[/C][/ROW]
[ROW][C]15[/C][C]5.5[/C][C]5.39214[/C][C]0.107863[/C][/ROW]
[ROW][C]16[/C][C]3.5[/C][C]4.4384[/C][C]-0.938399[/C][/ROW]
[ROW][C]17[/C][C]4[/C][C]4.73149[/C][C]-0.731489[/C][/ROW]
[ROW][C]18[/C][C]6.5[/C][C]4.16412[/C][C]2.33588[/C][/ROW]
[ROW][C]19[/C][C]4.5[/C][C]4.40357[/C][C]0.0964333[/C][/ROW]
[ROW][C]20[/C][C]5.5[/C][C]4.62121[/C][C]0.87879[/C][/ROW]
[ROW][C]21[/C][C]4[/C][C]5.03686[/C][C]-1.03686[/C][/ROW]
[ROW][C]22[/C][C]7.5[/C][C]4.72571[/C][C]2.77429[/C][/ROW]
[ROW][C]23[/C][C]4[/C][C]4.35944[/C][C]-0.35944[/C][/ROW]
[ROW][C]24[/C][C]5.5[/C][C]4.06518[/C][C]1.43482[/C][/ROW]
[ROW][C]25[/C][C]2.5[/C][C]5.33411[/C][C]-2.83411[/C][/ROW]
[ROW][C]26[/C][C]5.5[/C][C]5.01944[/C][C]0.480557[/C][/ROW]
[ROW][C]27[/C][C]3.5[/C][C]4.46394[/C][C]-0.963938[/C][/ROW]
[ROW][C]28[/C][C]4.5[/C][C]4.31275[/C][C]0.187253[/C][/ROW]
[ROW][C]29[/C][C]4.5[/C][C]4.111[/C][C]0.388997[/C][/ROW]
[ROW][C]30[/C][C]6[/C][C]4.83225[/C][C]1.16775[/C][/ROW]
[ROW][C]31[/C][C]5[/C][C]3.74708[/C][C]1.25292[/C][/ROW]
[ROW][C]32[/C][C]6.5[/C][C]3.96793[/C][C]2.53207[/C][/ROW]
[ROW][C]33[/C][C]5[/C][C]5.13762[/C][C]-0.137619[/C][/ROW]
[ROW][C]34[/C][C]6[/C][C]4.34501[/C][C]1.65499[/C][/ROW]
[ROW][C]35[/C][C]4.5[/C][C]3.38133[/C][C]1.11867[/C][/ROW]
[ROW][C]36[/C][C]5[/C][C]4.16529[/C][C]0.834706[/C][/ROW]
[ROW][C]37[/C][C]5[/C][C]4.99829[/C][C]0.00171137[/C][/ROW]
[ROW][C]38[/C][C]6.5[/C][C]4.91377[/C][C]1.58623[/C][/ROW]
[ROW][C]39[/C][C]7[/C][C]4.51502[/C][C]2.48498[/C][/ROW]
[ROW][C]40[/C][C]4.5[/C][C]4.48135[/C][C]0.0186455[/C][/ROW]
[ROW][C]41[/C][C]8.5[/C][C]5.74677[/C][C]2.75323[/C][/ROW]
[ROW][C]42[/C][C]3.5[/C][C]3.80511[/C][C]-0.305106[/C][/ROW]
[ROW][C]43[/C][C]6[/C][C]4.37803[/C][C]1.62197[/C][/ROW]
[ROW][C]44[/C][C]1.5[/C][C]4.45816[/C][C]-2.95816[/C][/ROW]
[ROW][C]45[/C][C]3.5[/C][C]3.97606[/C][C]-0.476056[/C][/ROW]
[ROW][C]46[/C][C]7.5[/C][C]4.00598[/C][C]3.49402[/C][/ROW]
[ROW][C]47[/C][C]5[/C][C]4.31275[/C][C]0.687253[/C][/ROW]
[ROW][C]48[/C][C]6.5[/C][C]4.68019[/C][C]1.81981[/C][/ROW]
[ROW][C]49[/C][C]6.5[/C][C]5.16807[/C][C]1.33193[/C][/ROW]
[ROW][C]50[/C][C]6.5[/C][C]5.35848[/C][C]1.14152[/C][/ROW]
[ROW][C]51[/C][C]7[/C][C]4.26424[/C][C]2.73576[/C][/ROW]
[ROW][C]52[/C][C]1.5[/C][C]4.27791[/C][C]-2.77791[/C][/ROW]
[ROW][C]53[/C][C]4[/C][C]5.37963[/C][C]-1.37963[/C][/ROW]
[ROW][C]54[/C][C]4.5[/C][C]4.62069[/C][C]-0.120685[/C][/ROW]
[ROW][C]55[/C][C]0[/C][C]3.77957[/C][C]-3.77957[/C][/ROW]
[ROW][C]56[/C][C]3.5[/C][C]4.86942[/C][C]-1.36942[/C][/ROW]
[ROW][C]57[/C][C]4.5[/C][C]4.89432[/C][C]-0.394316[/C][/ROW]
[ROW][C]58[/C][C]0[/C][C]5.24703[/C][C]-5.24703[/C][/ROW]
[ROW][C]59[/C][C]3[/C][C]5.34223[/C][C]-2.34223[/C][/ROW]
[ROW][C]60[/C][C]3.5[/C][C]4.30719[/C][C]-0.807191[/C][/ROW]
[ROW][C]61[/C][C]3[/C][C]5.07864[/C][C]-2.07864[/C][/ROW]
[ROW][C]62[/C][C]1[/C][C]4.5211[/C][C]-3.5211[/C][/ROW]
[ROW][C]63[/C][C]5.5[/C][C]4.37686[/C][C]1.12314[/C][/ROW]
[/TABLE]
Source: https://freestatistics.org/blog/index.php?pk=270892&T=4

Globally Unique Identifier (entire table): ba.freestatistics.org/blog/index.php?pk=270892&T=4

As an alternative you can also use a QR Code:  

The GUIDs for individual cells are displayed in the table below:

Multiple Linear Regression - Actuals, Interpolation, and Residuals
Time or IndexActualsInterpolationForecastResidualsPrediction Error
17.55.294372.20563
26.55.588630.911374
314.36756-3.36756
414.39171-3.39171
55.54.447691.05231
68.55.08593.4141
76.54.877551.62245
84.53.646020.853983
924.30719-2.30719
1054.620690.379315
110.53.86109-3.36109
1254.857790.142213
132.53.92755-1.42755
1455.21359-0.21359
155.55.392140.107863
163.54.4384-0.938399
1744.73149-0.731489
186.54.164122.33588
194.54.403570.0964333
205.54.621210.87879
2145.03686-1.03686
227.54.725712.77429
2344.35944-0.35944
245.54.065181.43482
252.55.33411-2.83411
265.55.019440.480557
273.54.46394-0.963938
284.54.312750.187253
294.54.1110.388997
3064.832251.16775
3153.747081.25292
326.53.967932.53207
3355.13762-0.137619
3464.345011.65499
354.53.381331.11867
3654.165290.834706
3754.998290.00171137
386.54.913771.58623
3974.515022.48498
404.54.481350.0186455
418.55.746772.75323
423.53.80511-0.305106
4364.378031.62197
441.54.45816-2.95816
453.53.97606-0.476056
467.54.005983.49402
4754.312750.687253
486.54.680191.81981
496.55.168071.33193
506.55.358481.14152
5174.264242.73576
521.54.27791-2.77791
5345.37963-1.37963
544.54.62069-0.120685
5503.77957-3.77957
563.54.86942-1.36942
574.54.89432-0.394316
5805.24703-5.24703
5935.34223-2.34223
603.54.30719-0.807191
6135.07864-2.07864
6214.5211-3.5211
635.54.376861.12314


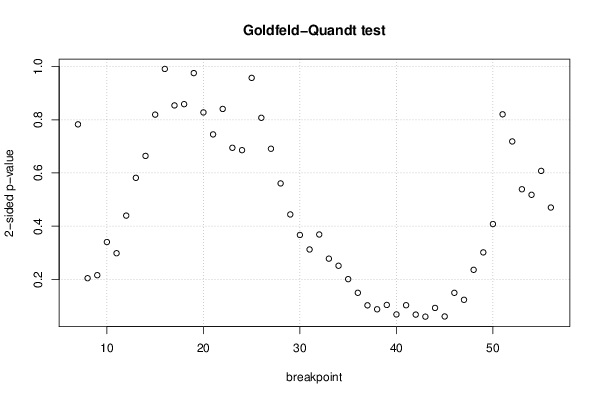
Goldfeld-Quandt test for Heteroskedasticity
p-valuesAlternative Hypothesis
breakpoint indexgreater2-sidedless
70.6085720.7828560.391428
80.8978370.2043260.102163
90.8921670.2156650.107833
100.8298270.3403460.170173
110.850870.2982610.14913
120.7801210.4397570.219879
130.7091370.5817260.290863
140.6679120.6641770.332088
150.5902630.8194750.409737
160.5044010.9911980.495599
170.4270370.8540750.572963
180.5705990.8588020.429401
190.48780.9756010.5122
200.4138720.8277440.586128
210.3725160.7450320.627484
220.4204050.8408090.579595
230.3473750.6947510.652625
240.3428830.6857670.657117
250.4788320.9576630.521168
260.4037540.8075070.596246
270.3455690.6911380.654431
280.2804120.5608250.719588
290.2220230.4440460.777977
300.1834420.3668840.816558
310.1561730.3123470.843827
320.1843550.3687090.815645
330.1389280.2778560.861072
340.1255620.2511250.874438
350.1003770.2007540.899623
360.07472980.149460.92527
370.05120890.1024180.948791
380.04375670.08751350.956243
390.05186070.1037210.948139
400.03405550.0681110.965944
410.05136480.102730.948635
420.03376790.06753570.966232
430.02988380.05976770.970116
440.04625790.09251580.953742
450.03022280.06044560.969777
460.07468120.1493620.925319
470.0615580.1231160.938442
480.1179530.2359060.882047
490.1507220.3014450.849278
500.2040290.4080590.795971
510.4103250.8206490.589675
520.3593010.7186020.640699
530.2694110.5388220.730589
540.2589670.5179340.741033
550.3039120.6078240.696088
560.2350640.4701270.764936

\begin{tabular}{lllllllll}
\hline
Goldfeld-Quandt test for Heteroskedasticity \tabularnewline
p-values & Alternative Hypothesis \tabularnewline
breakpoint index & greater & 2-sided & less \tabularnewline
7 & 0.608572 & 0.782856 & 0.391428 \tabularnewline
8 & 0.897837 & 0.204326 & 0.102163 \tabularnewline
9 & 0.892167 & 0.215665 & 0.107833 \tabularnewline
10 & 0.829827 & 0.340346 & 0.170173 \tabularnewline
11 & 0.85087 & 0.298261 & 0.14913 \tabularnewline
12 & 0.780121 & 0.439757 & 0.219879 \tabularnewline
13 & 0.709137 & 0.581726 & 0.290863 \tabularnewline
14 & 0.667912 & 0.664177 & 0.332088 \tabularnewline
15 & 0.590263 & 0.819475 & 0.409737 \tabularnewline
16 & 0.504401 & 0.991198 & 0.495599 \tabularnewline
17 & 0.427037 & 0.854075 & 0.572963 \tabularnewline
18 & 0.570599 & 0.858802 & 0.429401 \tabularnewline
19 & 0.4878 & 0.975601 & 0.5122 \tabularnewline
20 & 0.413872 & 0.827744 & 0.586128 \tabularnewline
21 & 0.372516 & 0.745032 & 0.627484 \tabularnewline
22 & 0.420405 & 0.840809 & 0.579595 \tabularnewline
23 & 0.347375 & 0.694751 & 0.652625 \tabularnewline
24 & 0.342883 & 0.685767 & 0.657117 \tabularnewline
25 & 0.478832 & 0.957663 & 0.521168 \tabularnewline
26 & 0.403754 & 0.807507 & 0.596246 \tabularnewline
27 & 0.345569 & 0.691138 & 0.654431 \tabularnewline
28 & 0.280412 & 0.560825 & 0.719588 \tabularnewline
29 & 0.222023 & 0.444046 & 0.777977 \tabularnewline
30 & 0.183442 & 0.366884 & 0.816558 \tabularnewline
31 & 0.156173 & 0.312347 & 0.843827 \tabularnewline
32 & 0.184355 & 0.368709 & 0.815645 \tabularnewline
33 & 0.138928 & 0.277856 & 0.861072 \tabularnewline
34 & 0.125562 & 0.251125 & 0.874438 \tabularnewline
35 & 0.100377 & 0.200754 & 0.899623 \tabularnewline
36 & 0.0747298 & 0.14946 & 0.92527 \tabularnewline
37 & 0.0512089 & 0.102418 & 0.948791 \tabularnewline
38 & 0.0437567 & 0.0875135 & 0.956243 \tabularnewline
39 & 0.0518607 & 0.103721 & 0.948139 \tabularnewline
40 & 0.0340555 & 0.068111 & 0.965944 \tabularnewline
41 & 0.0513648 & 0.10273 & 0.948635 \tabularnewline
42 & 0.0337679 & 0.0675357 & 0.966232 \tabularnewline
43 & 0.0298838 & 0.0597677 & 0.970116 \tabularnewline
44 & 0.0462579 & 0.0925158 & 0.953742 \tabularnewline
45 & 0.0302228 & 0.0604456 & 0.969777 \tabularnewline
46 & 0.0746812 & 0.149362 & 0.925319 \tabularnewline
47 & 0.061558 & 0.123116 & 0.938442 \tabularnewline
48 & 0.117953 & 0.235906 & 0.882047 \tabularnewline
49 & 0.150722 & 0.301445 & 0.849278 \tabularnewline
50 & 0.204029 & 0.408059 & 0.795971 \tabularnewline
51 & 0.410325 & 0.820649 & 0.589675 \tabularnewline
52 & 0.359301 & 0.718602 & 0.640699 \tabularnewline
53 & 0.269411 & 0.538822 & 0.730589 \tabularnewline
54 & 0.258967 & 0.517934 & 0.741033 \tabularnewline
55 & 0.303912 & 0.607824 & 0.696088 \tabularnewline
56 & 0.235064 & 0.470127 & 0.764936 \tabularnewline
\hline
\end{tabular}
%Source: https://freestatistics.org/blog/index.php?pk=270892&T=5

[TABLE]
[ROW][C]Goldfeld-Quandt test for Heteroskedasticity[/C][/ROW]
[ROW][C]p-values[/C][C]Alternative Hypothesis[/C][/ROW]
[ROW][C]breakpoint index[/C][C]greater[/C][C]2-sided[/C][C]less[/C][/ROW]
[ROW][C]7[/C][C]0.608572[/C][C]0.782856[/C][C]0.391428[/C][/ROW]
[ROW][C]8[/C][C]0.897837[/C][C]0.204326[/C][C]0.102163[/C][/ROW]
[ROW][C]9[/C][C]0.892167[/C][C]0.215665[/C][C]0.107833[/C][/ROW]
[ROW][C]10[/C][C]0.829827[/C][C]0.340346[/C][C]0.170173[/C][/ROW]
[ROW][C]11[/C][C]0.85087[/C][C]0.298261[/C][C]0.14913[/C][/ROW]
[ROW][C]12[/C][C]0.780121[/C][C]0.439757[/C][C]0.219879[/C][/ROW]
[ROW][C]13[/C][C]0.709137[/C][C]0.581726[/C][C]0.290863[/C][/ROW]
[ROW][C]14[/C][C]0.667912[/C][C]0.664177[/C][C]0.332088[/C][/ROW]
[ROW][C]15[/C][C]0.590263[/C][C]0.819475[/C][C]0.409737[/C][/ROW]
[ROW][C]16[/C][C]0.504401[/C][C]0.991198[/C][C]0.495599[/C][/ROW]
[ROW][C]17[/C][C]0.427037[/C][C]0.854075[/C][C]0.572963[/C][/ROW]
[ROW][C]18[/C][C]0.570599[/C][C]0.858802[/C][C]0.429401[/C][/ROW]
[ROW][C]19[/C][C]0.4878[/C][C]0.975601[/C][C]0.5122[/C][/ROW]
[ROW][C]20[/C][C]0.413872[/C][C]0.827744[/C][C]0.586128[/C][/ROW]
[ROW][C]21[/C][C]0.372516[/C][C]0.745032[/C][C]0.627484[/C][/ROW]
[ROW][C]22[/C][C]0.420405[/C][C]0.840809[/C][C]0.579595[/C][/ROW]
[ROW][C]23[/C][C]0.347375[/C][C]0.694751[/C][C]0.652625[/C][/ROW]
[ROW][C]24[/C][C]0.342883[/C][C]0.685767[/C][C]0.657117[/C][/ROW]
[ROW][C]25[/C][C]0.478832[/C][C]0.957663[/C][C]0.521168[/C][/ROW]
[ROW][C]26[/C][C]0.403754[/C][C]0.807507[/C][C]0.596246[/C][/ROW]
[ROW][C]27[/C][C]0.345569[/C][C]0.691138[/C][C]0.654431[/C][/ROW]
[ROW][C]28[/C][C]0.280412[/C][C]0.560825[/C][C]0.719588[/C][/ROW]
[ROW][C]29[/C][C]0.222023[/C][C]0.444046[/C][C]0.777977[/C][/ROW]
[ROW][C]30[/C][C]0.183442[/C][C]0.366884[/C][C]0.816558[/C][/ROW]
[ROW][C]31[/C][C]0.156173[/C][C]0.312347[/C][C]0.843827[/C][/ROW]
[ROW][C]32[/C][C]0.184355[/C][C]0.368709[/C][C]0.815645[/C][/ROW]
[ROW][C]33[/C][C]0.138928[/C][C]0.277856[/C][C]0.861072[/C][/ROW]
[ROW][C]34[/C][C]0.125562[/C][C]0.251125[/C][C]0.874438[/C][/ROW]
[ROW][C]35[/C][C]0.100377[/C][C]0.200754[/C][C]0.899623[/C][/ROW]
[ROW][C]36[/C][C]0.0747298[/C][C]0.14946[/C][C]0.92527[/C][/ROW]
[ROW][C]37[/C][C]0.0512089[/C][C]0.102418[/C][C]0.948791[/C][/ROW]
[ROW][C]38[/C][C]0.0437567[/C][C]0.0875135[/C][C]0.956243[/C][/ROW]
[ROW][C]39[/C][C]0.0518607[/C][C]0.103721[/C][C]0.948139[/C][/ROW]
[ROW][C]40[/C][C]0.0340555[/C][C]0.068111[/C][C]0.965944[/C][/ROW]
[ROW][C]41[/C][C]0.0513648[/C][C]0.10273[/C][C]0.948635[/C][/ROW]
[ROW][C]42[/C][C]0.0337679[/C][C]0.0675357[/C][C]0.966232[/C][/ROW]
[ROW][C]43[/C][C]0.0298838[/C][C]0.0597677[/C][C]0.970116[/C][/ROW]
[ROW][C]44[/C][C]0.0462579[/C][C]0.0925158[/C][C]0.953742[/C][/ROW]
[ROW][C]45[/C][C]0.0302228[/C][C]0.0604456[/C][C]0.969777[/C][/ROW]
[ROW][C]46[/C][C]0.0746812[/C][C]0.149362[/C][C]0.925319[/C][/ROW]
[ROW][C]47[/C][C]0.061558[/C][C]0.123116[/C][C]0.938442[/C][/ROW]
[ROW][C]48[/C][C]0.117953[/C][C]0.235906[/C][C]0.882047[/C][/ROW]
[ROW][C]49[/C][C]0.150722[/C][C]0.301445[/C][C]0.849278[/C][/ROW]
[ROW][C]50[/C][C]0.204029[/C][C]0.408059[/C][C]0.795971[/C][/ROW]
[ROW][C]51[/C][C]0.410325[/C][C]0.820649[/C][C]0.589675[/C][/ROW]
[ROW][C]52[/C][C]0.359301[/C][C]0.718602[/C][C]0.640699[/C][/ROW]
[ROW][C]53[/C][C]0.269411[/C][C]0.538822[/C][C]0.730589[/C][/ROW]
[ROW][C]54[/C][C]0.258967[/C][C]0.517934[/C][C]0.741033[/C][/ROW]
[ROW][C]55[/C][C]0.303912[/C][C]0.607824[/C][C]0.696088[/C][/ROW]
[ROW][C]56[/C][C]0.235064[/C][C]0.470127[/C][C]0.764936[/C][/ROW]
[/TABLE]
Source: https://freestatistics.org/blog/index.php?pk=270892&T=5

Globally Unique Identifier (entire table): ba.freestatistics.org/blog/index.php?pk=270892&T=5

As an alternative you can also use a QR Code:  

The GUIDs for individual cells are displayed in the table below:

Goldfeld-Quandt test for Heteroskedasticity
p-valuesAlternative Hypothesis
breakpoint indexgreater2-sidedless
70.6085720.7828560.391428
80.8978370.2043260.102163
90.8921670.2156650.107833
100.8298270.3403460.170173
110.850870.2982610.14913
120.7801210.4397570.219879
130.7091370.5817260.290863
140.6679120.6641770.332088
150.5902630.8194750.409737
160.5044010.9911980.495599
170.4270370.8540750.572963
180.5705990.8588020.429401
190.48780.9756010.5122
200.4138720.8277440.586128
210.3725160.7450320.627484
220.4204050.8408090.579595
230.3473750.6947510.652625
240.3428830.6857670.657117
250.4788320.9576630.521168
260.4037540.8075070.596246
270.3455690.6911380.654431
280.2804120.5608250.719588
290.2220230.4440460.777977
300.1834420.3668840.816558
310.1561730.3123470.843827
320.1843550.3687090.815645
330.1389280.2778560.861072
340.1255620.2511250.874438
350.1003770.2007540.899623
360.07472980.149460.92527
370.05120890.1024180.948791
380.04375670.08751350.956243
390.05186070.1037210.948139
400.03405550.0681110.965944
410.05136480.102730.948635
420.03376790.06753570.966232
430.02988380.05976770.970116
440.04625790.09251580.953742
450.03022280.06044560.969777
460.07468120.1493620.925319
470.0615580.1231160.938442
480.1179530.2359060.882047
490.1507220.3014450.849278
500.2040290.4080590.795971
510.4103250.8206490.589675
520.3593010.7186020.640699
530.2694110.5388220.730589
540.2589670.5179340.741033
550.3039120.6078240.696088
560.2350640.4701270.764936


Meta Analysis of Goldfeld-Quandt test for Heteroskedasticity
Description# significant tests% significant testsOK/NOK
1% type I error level00OK
5% type I error level00OK
10% type I error level60.12NOK

\begin{tabular}{lllllllll}
\hline
Meta Analysis of Goldfeld-Quandt test for Heteroskedasticity \tabularnewline
Description & # significant tests & % significant tests & OK/NOK \tabularnewline
1% type I error level & 0 & 0 & OK \tabularnewline
5% type I error level & 0 & 0 & OK \tabularnewline
10% type I error level & 6 & 0.12 & NOK \tabularnewline
\hline
\end{tabular}
%Source: https://freestatistics.org/blog/index.php?pk=270892&T=6

[TABLE]
[ROW][C]Meta Analysis of Goldfeld-Quandt test for Heteroskedasticity[/C][/ROW]
[ROW][C]Description[/C][C]# significant tests[/C][C]% significant tests[/C][C]OK/NOK[/C][/ROW]
[ROW][C]1% type I error level[/C][C]0[/C][C]0[/C][C]OK[/C][/ROW]
[ROW][C]5% type I error level[/C][C]0[/C][C]0[/C][C]OK[/C][/ROW]
[ROW][C]10% type I error level[/C][C]6[/C][C]0.12[/C][C]NOK[/C][/ROW]
[/TABLE]
Source: https://freestatistics.org/blog/index.php?pk=270892&T=6

Globally Unique Identifier (entire table): ba.freestatistics.org/blog/index.php?pk=270892&T=6

As an alternative you can also use a QR Code:  

The GUIDs for individual cells are displayed in the table below:

Meta Analysis of Goldfeld-Quandt test for Heteroskedasticity
Description# significant tests% significant testsOK/NOK
1% type I error level00OK
5% type I error level00OK
10% type I error level60.12NOK


Parameters (Session):
par1 = 4 ; par2 = Do not include Seasonal Dummies ; par3 = No Linear Trend ;
Parameters (R input):
par1 = 4 ; par2 = Do not include Seasonal Dummies ; par3 = No Linear Trend ;
R code (references can be found in the software module):
library(lattice)
library(lmtest)
n25 <- 25 #minimum number of obs. for Goldfeld-Quandt test
par1 <- as.numeric(par1)
x <- t(y)
k <- length(x[1,])
n <- length(x[,1])
x1 <- cbind(x[,par1], x[,1:k!=par1])
mycolnames <- c(colnames(x)[par1], colnames(x)[1:k!=par1])
colnames(x1) <- mycolnames #colnames(x)[par1]
x <- x1
if (par3 == 'First Differences'){
x2 <- array(0, dim=c(n-1,k), dimnames=list(1:(n-1), paste('(1-B)',colnames(x),sep='')))
for (i in 1:n-1) {
for (j in 1:k) {
x2[i,j] <- x[i+1,j] - x[i,j]
}
}
x <- x2
}
if (par2 == 'Include Monthly Dummies'){
x2 <- array(0, dim=c(n,11), dimnames=list(1:n, paste('M', seq(1:11), sep ='')))
for (i in 1:11){
x2[seq(i,n,12),i] <- 1
}
x <- cbind(x, x2)
}
if (par2 == 'Include Quarterly Dummies'){
x2 <- array(0, dim=c(n,3), dimnames=list(1:n, paste('Q', seq(1:3), sep ='')))
for (i in 1:3){
x2[seq(i,n,4),i] <- 1
}
x <- cbind(x, x2)
}
k <- length(x[1,])
if (par3 == 'Linear Trend'){
x <- cbind(x, c(1:n))
colnames(x)[k+1] <- 't'
}
x
k <- length(x[1,])
df <- as.data.frame(x)
(mylm <- lm(df))
(mysum <- summary(mylm))
if (n > n25) {
kp3 <- k + 3
nmkm3 <- n - k - 3
gqarr <- array(NA, dim=c(nmkm3-kp3+1,3))
numgqtests <- 0
numsignificant1 <- 0
numsignificant5 <- 0
numsignificant10 <- 0
for (mypoint in kp3:nmkm3) {
j <- 0
numgqtests <- numgqtests + 1
for (myalt in c('greater', 'two.sided', 'less')) {
j <- j + 1
gqarr[mypoint-kp3+1,j] <- gqtest(mylm, point=mypoint, alternative=myalt)$p.value
}
if (gqarr[mypoint-kp3+1,2] < 0.01) numsignificant1 <- numsignificant1 + 1
if (gqarr[mypoint-kp3+1,2] < 0.05) numsignificant5 <- numsignificant5 + 1
if (gqarr[mypoint-kp3+1,2] < 0.10) numsignificant10 <- numsignificant10 + 1
}
gqarr
}
bitmap(file='test0.png')
plot(x[,1], type='l', main='Actuals and Interpolation', ylab='value of Actuals and Interpolation (dots)', xlab='time or index')
points(x[,1]-mysum$resid)
grid()
dev.off()
bitmap(file='test1.png')
plot(mysum$resid, type='b', pch=19, main='Residuals', ylab='value of Residuals', xlab='time or index')
grid()
dev.off()
bitmap(file='test2.png')
hist(mysum$resid, main='Residual Histogram', xlab='values of Residuals')
grid()
dev.off()
bitmap(file='test3.png')
densityplot(~mysum$resid,col='black',main='Residual Density Plot', xlab='values of Residuals')
dev.off()
bitmap(file='test4.png')
qqnorm(mysum$resid, main='Residual Normal Q-Q Plot')
qqline(mysum$resid)
grid()
dev.off()
(myerror <- as.ts(mysum$resid))
bitmap(file='test5.png')
dum <- cbind(lag(myerror,k=1),myerror)
dum
dum1 <- dum[2:length(myerror),]
dum1
z <- as.data.frame(dum1)
z
plot(z,main=paste('Residual Lag plot, lowess, and regression line'), ylab='values of Residuals', xlab='lagged values of Residuals')
lines(lowess(z))
abline(lm(z))
grid()
dev.off()
bitmap(file='test6.png')
acf(mysum$resid, lag.max=length(mysum$resid)/2, main='Residual Autocorrelation Function')
grid()
dev.off()
bitmap(file='test7.png')
pacf(mysum$resid, lag.max=length(mysum$resid)/2, main='Residual Partial Autocorrelation Function')
grid()
dev.off()
bitmap(file='test8.png')
opar <- par(mfrow = c(2,2), oma = c(0, 0, 1.1, 0))
plot(mylm, las = 1, sub='Residual Diagnostics')
par(opar)
dev.off()
if (n > n25) {
bitmap(file='test9.png')
plot(kp3:nmkm3,gqarr[,2], main='Goldfeld-Quandt test',ylab='2-sided p-value',xlab='breakpoint')
grid()
dev.off()
}
load(file='createtable')
a<-table.start()
a<-table.row.start(a)
a<-table.element(a, 'Multiple Linear Regression - Estimated Regression Equation', 1, TRUE)
a<-table.row.end(a)
myeq <- colnames(x)[1]
myeq <- paste(myeq, '[t] = ', sep='')
for (i in 1:k){
if (mysum$coefficients[i,1] > 0) myeq <- paste(myeq, '+', '')
myeq <- paste(myeq, signif(mysum$coefficients[i,1],6), sep=' ')
if (rownames(mysum$coefficients)[i] != '(Intercept)') {
myeq <- paste(myeq, rownames(mysum$coefficients)[i], sep='')
if (rownames(mysum$coefficients)[i] != 't') myeq <- paste(myeq, '[t]', sep='')
}
}
myeq <- paste(myeq, ' + e[t]')
a<-table.row.start(a)
a<-table.element(a, myeq)
a<-table.row.end(a)
a<-table.end(a)
table.save(a,file='mytable1.tab')
a<-table.start()
a<-table.row.start(a)
a<-table.element(a,hyperlink('ols1.htm','Multiple Linear Regression - Ordinary Least Squares',''), 6, TRUE)
a<-table.row.end(a)
a<-table.row.start(a)
a<-table.element(a,'Variable',header=TRUE)
a<-table.element(a,'Parameter',header=TRUE)
a<-table.element(a,'S.D.',header=TRUE)
a<-table.element(a,'T-STAT
H0: parameter = 0',header=TRUE)
a<-table.element(a,'2-tail p-value',header=TRUE)
a<-table.element(a,'1-tail p-value',header=TRUE)
a<-table.row.end(a)
for (i in 1:k){
a<-table.row.start(a)
a<-table.element(a,rownames(mysum$coefficients)[i],header=TRUE)
a<-table.element(a,signif(mysum$coefficients[i,1],6))
a<-table.element(a, signif(mysum$coefficients[i,2],6))
a<-table.element(a, signif(mysum$coefficients[i,3],4))
a<-table.element(a, signif(mysum$coefficients[i,4],6))
a<-table.element(a, signif(mysum$coefficients[i,4]/2,6))
a<-table.row.end(a)
}
a<-table.end(a)
table.save(a,file='mytable2.tab')
a<-table.start()
a<-table.row.start(a)
a<-table.element(a, 'Multiple Linear Regression - Regression Statistics', 2, TRUE)
a<-table.row.end(a)
a<-table.row.start(a)
a<-table.element(a, 'Multiple R',1,TRUE)
a<-table.element(a, signif(sqrt(mysum$r.squared),6))
a<-table.row.end(a)
a<-table.row.start(a)
a<-table.element(a, 'R-squared',1,TRUE)
a<-table.element(a, signif(mysum$r.squared,6))
a<-table.row.end(a)
a<-table.row.start(a)
a<-table.element(a, 'Adjusted R-squared',1,TRUE)
a<-table.element(a, signif(mysum$adj.r.squared,6))
a<-table.row.end(a)
a<-table.row.start(a)
a<-table.element(a, 'F-TEST (value)',1,TRUE)
a<-table.element(a, signif(mysum$fstatistic[1],6))
a<-table.row.end(a)
a<-table.row.start(a)
a<-table.element(a, 'F-TEST (DF numerator)',1,TRUE)
a<-table.element(a, signif(mysum$fstatistic[2],6))
a<-table.row.end(a)
a<-table.row.start(a)
a<-table.element(a, 'F-TEST (DF denominator)',1,TRUE)
a<-table.element(a, signif(mysum$fstatistic[3],6))
a<-table.row.end(a)
a<-table.row.start(a)
a<-table.element(a, 'p-value',1,TRUE)
a<-table.element(a, signif(1-pf(mysum$fstatistic[1],mysum$fstatistic[2],mysum$fstatistic[3]),6))
a<-table.row.end(a)
a<-table.row.start(a)
a<-table.element(a, 'Multiple Linear Regression - Residual Statistics', 2, TRUE)
a<-table.row.end(a)
a<-table.row.start(a)
a<-table.element(a, 'Residual Standard Deviation',1,TRUE)
a<-table.element(a, signif(mysum$sigma,6))
a<-table.row.end(a)
a<-table.row.start(a)
a<-table.element(a, 'Sum Squared Residuals',1,TRUE)
a<-table.element(a, signif(sum(myerror*myerror),6))
a<-table.row.end(a)
a<-table.end(a)
table.save(a,file='mytable3.tab')
a<-table.start()
a<-table.row.start(a)
a<-table.element(a, 'Multiple Linear Regression - Actuals, Interpolation, and Residuals', 4, TRUE)
a<-table.row.end(a)
a<-table.row.start(a)
a<-table.element(a, 'Time or Index', 1, TRUE)
a<-table.element(a, 'Actuals', 1, TRUE)
a<-table.element(a, 'Interpolation
Forecast', 1, TRUE)
a<-table.element(a, 'Residuals
Prediction Error', 1, TRUE)
a<-table.row.end(a)
for (i in 1:n) {
a<-table.row.start(a)
a<-table.element(a,i, 1, TRUE)
a<-table.element(a,signif(x[i],6))
a<-table.element(a,signif(x[i]-mysum$resid[i],6))
a<-table.element(a,signif(mysum$resid[i],6))
a<-table.row.end(a)
}
a<-table.end(a)
table.save(a,file='mytable4.tab')
if (n > n25) {
a<-table.start()
a<-table.row.start(a)
a<-table.element(a,'Goldfeld-Quandt test for Heteroskedasticity',4,TRUE)
a<-table.row.end(a)
a<-table.row.start(a)
a<-table.element(a,'p-values',header=TRUE)
a<-table.element(a,'Alternative Hypothesis',3,header=TRUE)
a<-table.row.end(a)
a<-table.row.start(a)
a<-table.element(a,'breakpoint index',header=TRUE)
a<-table.element(a,'greater',header=TRUE)
a<-table.element(a,'2-sided',header=TRUE)
a<-table.element(a,'less',header=TRUE)
a<-table.row.end(a)
for (mypoint in kp3:nmkm3) {
a<-table.row.start(a)
a<-table.element(a,mypoint,header=TRUE)
a<-table.element(a,signif(gqarr[mypoint-kp3+1,1],6))
a<-table.element(a,signif(gqarr[mypoint-kp3+1,2],6))
a<-table.element(a,signif(gqarr[mypoint-kp3+1,3],6))
a<-table.row.end(a)
}
a<-table.end(a)
table.save(a,file='mytable5.tab')
a<-table.start()
a<-table.row.start(a)
a<-table.element(a,'Meta Analysis of Goldfeld-Quandt test for Heteroskedasticity',4,TRUE)
a<-table.row.end(a)
a<-table.row.start(a)
a<-table.element(a,'Description',header=TRUE)
a<-table.element(a,'# significant tests',header=TRUE)
a<-table.element(a,'% significant tests',header=TRUE)
a<-table.element(a,'OK/NOK',header=TRUE)
a<-table.row.end(a)
a<-table.row.start(a)
a<-table.element(a,'1% type I error level',header=TRUE)
a<-table.element(a,signif(numsignificant1,6))
a<-table.element(a,signif(numsignificant1/numgqtests,6))
if (numsignificant1/numgqtests < 0.01) dum <- 'OK' else dum <- 'NOK'
a<-table.element(a,dum)
a<-table.row.end(a)
a<-table.row.start(a)
a<-table.element(a,'5% type I error level',header=TRUE)
a<-table.element(a,signif(numsignificant5,6))
a<-table.element(a,signif(numsignificant5/numgqtests,6))
if (numsignificant5/numgqtests < 0.05) dum <- 'OK' else dum <- 'NOK'
a<-table.element(a,dum)
a<-table.row.end(a)
a<-table.row.start(a)
a<-table.element(a,'10% type I error level',header=TRUE)
a<-table.element(a,signif(numsignificant10,6))
a<-table.element(a,signif(numsignificant10/numgqtests,6))
if (numsignificant10/numgqtests < 0.1) dum <- 'OK' else dum <- 'NOK'
a<-table.element(a,dum)
a<-table.row.end(a)
a<-table.end(a)
table.save(a,file='mytable6.tab')
}