Free Statistics

of Irreproducible Research!

Author's title

Author*The author of this computation has been verified*
R Software Modulerwasp_Simple Regression Y ~ X.wasp
Title produced by softwareSimple Linear Regression
Date of computationThu, 18 Dec 2014 13:31:48 +0000
Cite this page as followsStatistical Computations at FreeStatistics.org, Office for Research Development and Education, URL https://freestatistics.org/blog/index.php?v=date/2014/Dec/18/t14189095330gja9gw1vfyert6.htm/, Retrieved Fri, 17 May 2024 15:40:14 +0000
Statistical Computations at FreeStatistics.org, Office for Research Development and Education, URL https://freestatistics.org/blog/index.php?pk=270915, Retrieved Fri, 17 May 2024 15:40:14 +0000
QR Codes:

Original text written by user:
IsPrivate?No (this computation is public)
User-defined keywords
Estimated Impact87
Family? (F = Feedback message, R = changed R code, M = changed R Module, P = changed Parameters, D = changed Data)
-       [Simple Linear Regression] [] [2014-12-18 13:31:48] [578aae52f3152e8435e37fe3b2f57a45] [Current]
Feedback Forum

Post a new message
Dataseries X:
2000	387.35
2000	316.17
2000	283.48
2000	280.57
2000	266.03
2000	273.23
2000	265.68
2000	266.23
2000        257.77
2000	269.87
2000	287.53
2000	285.9
2001	325.87
2001	302.25
2001	294
2001	285.43
2001	286.19
2001	276.7
2001	267.77
2001	267.03
2001	257.87
2001	257.19
2001	275.6
2001	305.68
2002	358.06
2002	320.07
2002	295.9
2002	291.27
2002	272.87
2002	269.27
2002	271.32
2002	267.45
2002	260.33
2002	277.94
2002	277.07
2002	312.65
2003	319.71
2003	318.39
2003	304.9
2003	303.73
2003	273.29
2003	274.33
2003	270.45
2003	278.23
2003	274.03
2003	279
2003	287.5
2003	336.87
2004	334.1
2004	296.07
2004	286.84
2004	277.63
2004	261.32
2004	264.07
2004	261.94
2004	252.84
2004	257.83
2004	271.16
2004	273.63
2004	304.87
2005	323.9
2005	336.11
2005	335.65
2005	282.23
2005	273.03
2005	270.07
2005	246.03
2005	242.35
2005	250.33
2005	267.45
2005	268.8
2005	302.68
2006	313.1
2006	306.39
2006	305.61
2006	277.27
2006	264.94
2006	268.63
2006	293.9
2006	248.65
2006	256
2006	258.52
2006	266.9
2006	281.23
2007	306
2007	325.46
2007	291.13
2007	282.53
2007	256.52
2007	258.63
2007	252.74
2007	245.16
2007	255.03
2007	268.35
2007	293.73
2007	278.39


Summary of computational transaction
Raw Inputview raw input (R code)
Raw Outputview raw output of R engine
Computing time2 seconds
R Server'Gertrude Mary Cox' @ cox.wessa.net
R Framework error message
Warning: there are blank lines in the 'Data X' field.
Please, use NA for missing data - blank lines are simply
 deleted and are NOT treated as missing values.

\begin{tabular}{lllllllll}
\hline
Summary of computational transaction \tabularnewline
Raw Input & view raw input (R code)  \tabularnewline
Raw Output & view raw output of R engine  \tabularnewline
Computing time & 2 seconds \tabularnewline
R Server & 'Gertrude Mary Cox' @ cox.wessa.net \tabularnewline
R Framework error message & 
Warning: there are blank lines in the 'Data X' field.
Please, use NA for missing data - blank lines are simply
 deleted and are NOT treated as missing values.
\tabularnewline \hline \end{tabular} %Source: https://freestatistics.org/blog/index.php?pk=270915&T=0

[TABLE]
[ROW][C]Summary of computational transaction[/C][/ROW]
[ROW][C]Raw Input[/C][C]view raw input (R code) [/C][/ROW]
[ROW][C]Raw Output[/C][C]view raw output of R engine [/C][/ROW]
[ROW][C]Computing time[/C][C]2 seconds[/C][/ROW]
[ROW][C]R Server[/C][C]'Gertrude Mary Cox' @ cox.wessa.net[/C][/ROW]
[ROW][C]R Framework error message[/C][C]
Warning: there are blank lines in the 'Data X' field.
Please, use NA for missing data - blank lines are simply
 deleted and are NOT treated as missing values.
[/C][/ROW] [/TABLE] Source: https://freestatistics.org/blog/index.php?pk=270915&T=0

Globally Unique Identifier (entire table): ba.freestatistics.org/blog/index.php?pk=270915&T=0

As an alternative you can also use a QR Code:  

The GUIDs for individual cells are displayed in the table below:

Summary of computational transaction
Raw Inputview raw input (R code)
Raw Outputview raw output of R engine
Computing time2 seconds
R Server'Gertrude Mary Cox' @ cox.wessa.net
R Framework error message
Warning: there are blank lines in the 'Data X' field.
Please, use NA for missing data - blank lines are simply
 deleted and are NOT treated as missing values.


Linear Regression Model
Y ~ X
coefficients:
EstimateStd. Errort valuePr(>|t|)
(Intercept)3443.9872344.4861.4690.145
X-1.5771.17-1.3480.181
- - -
Residual Std. Err. 26.271 on 94 df
Multiple R-sq. 0.019
Adjusted R-sq. 0.009

\begin{tabular}{lllllllll}
\hline
Linear Regression Model \tabularnewline
Y ~ X \tabularnewline
coefficients: &   \tabularnewline
  & Estimate & Std. Error & t value & Pr(>|t|) \tabularnewline
(Intercept) & 3443.987 & 2344.486 & 1.469 & 0.145 \tabularnewline
X & -1.577 & 1.17 & -1.348 & 0.181 \tabularnewline
- - -  &   \tabularnewline
Residual Std. Err.  & 26.271  on  94 df \tabularnewline
Multiple R-sq.  & 0.019 \tabularnewline
Adjusted R-sq.  & 0.009 \tabularnewline
\hline
\end{tabular}
%Source: https://freestatistics.org/blog/index.php?pk=270915&T=1

[TABLE]
[ROW][C]Linear Regression Model[/C][/ROW]
[ROW][C]Y ~ X[/C][/ROW]
[ROW][C]coefficients:[/C][C] [/C][/ROW]
[ROW][C] [/C][C]Estimate[/C][C]Std. Error[/C][C]t value[/C][C]Pr(>|t|)[/C][/ROW]
[C](Intercept)[/C][C]3443.987[/C][C]2344.486[/C][C]1.469[/C][C]0.145[/C][/ROW]
[C]X[/C][C]-1.577[/C][C]1.17[/C][C]-1.348[/C][C]0.181[/C][/ROW]
[ROW][C]- - - [/C][C] [/C][/ROW]
[ROW][C]Residual Std. Err. [/C][C]26.271  on  94 df[/C][/ROW]
[ROW][C]Multiple R-sq. [/C][C]0.019[/C][/ROW]
[ROW][C]Adjusted R-sq. [/C][C]0.009[/C][/ROW]
[/TABLE]
Source: https://freestatistics.org/blog/index.php?pk=270915&T=1

Globally Unique Identifier (entire table): ba.freestatistics.org/blog/index.php?pk=270915&T=1

As an alternative you can also use a QR Code:  

The GUIDs for individual cells are displayed in the table below:

Linear Regression Model
Y ~ X
coefficients:
EstimateStd. Errort valuePr(>|t|)
(Intercept)3443.9872344.4861.4690.145
X-1.5771.17-1.3480.181
- - -
Residual Std. Err. 26.271 on 94 df
Multiple R-sq. 0.019
Adjusted R-sq. 0.009


ANOVA Statistics
DfSum SqMean SqF valuePr(>F)
Jaar11254.0491254.0491.8170.181
Residuals9464874.575690.155

\begin{tabular}{lllllllll}
\hline
ANOVA Statistics \tabularnewline
  & Df & Sum Sq & Mean Sq & F value & Pr(>F) \tabularnewline
Jaar & 1 & 1254.049 & 1254.049 & 1.817 & 0.181 \tabularnewline
Residuals & 94 & 64874.575 & 690.155 &   &   \tabularnewline
\hline
\end{tabular}
%Source: https://freestatistics.org/blog/index.php?pk=270915&T=2

[TABLE]
[ROW][C]ANOVA Statistics[/C][/ROW]
[ROW][C] [/C][C]Df[/C][C]Sum Sq[/C][C]Mean Sq[/C][C]F value[/C][C]Pr(>F)[/C][/ROW]
[ROW][C]Jaar[/C][C]1[/C][C]1254.049[/C][C]1254.049[/C][C]1.817[/C][C]0.181[/C][/ROW]
[ROW][C]Residuals[/C][C]94[/C][C]64874.575[/C][C]690.155[/C][C] [/C][C] [/C][/ROW]
[/TABLE]
Source: https://freestatistics.org/blog/index.php?pk=270915&T=2

Globally Unique Identifier (entire table): ba.freestatistics.org/blog/index.php?pk=270915&T=2

As an alternative you can also use a QR Code:  

The GUIDs for individual cells are displayed in the table below:

ANOVA Statistics
DfSum SqMean SqF valuePr(>F)
Jaar11254.0491254.0491.8170.181
Residuals9464874.575690.155


Parameters (Session):
par1 = 2 ; par2 = 1 ; par3 = TRUE ;
Parameters (R input):
par1 = 2 ; par2 = 1 ; par3 = TRUE ;
R code (references can be found in the software module):
cat1 <- as.numeric(par1)
cat2<- as.numeric(par2)
intercept<-as.logical(par3)
x <- t(x)
xdf<-data.frame(t(y))
(V1<-dimnames(y)[[1]][cat1])
(V2<-dimnames(y)[[1]][cat2])
xdf <- data.frame(xdf[[cat1]], xdf[[cat2]])
names(xdf)<-c('Y', 'X')
if(intercept == FALSE) (lmxdf<-lm(Y~ X - 1, data = xdf) ) else (lmxdf<-lm(Y~ X, data = xdf) )
sumlmxdf<-summary(lmxdf)
(aov.xdf<-aov(lmxdf) )
(anova.xdf<-anova(lmxdf) )
load(file='createtable')
a<-table.start()
nc <- ncol(sumlmxdf$'coefficients')
nr <- nrow(sumlmxdf$'coefficients')
a<-table.row.start(a)
a<-table.element(a,'Linear Regression Model', nc+1,TRUE)
a<-table.row.end(a)
a<-table.row.start(a)
a<-table.element(a, lmxdf$call['formula'],nc+1)
a<-table.row.end(a)
a<-table.row.start(a)
a<-table.element(a, 'coefficients:',1,TRUE)
a<-table.element(a, ' ',nc,TRUE)
a<-table.row.end(a)
a<-table.row.start(a)
a<-table.element(a, ' ',1,TRUE)
for(i in 1 : nc){
a<-table.element(a, dimnames(sumlmxdf$'coefficients')[[2]][i],1,TRUE)
}#end header
a<-table.row.end(a)
for(i in 1: nr){
a<-table.element(a,dimnames(sumlmxdf$'coefficients')[[1]][i] ,1,TRUE)
for(j in 1 : nc){
a<-table.element(a, round(sumlmxdf$coefficients[i, j], digits=3), 1 ,FALSE)
}
a<-table.row.end(a)
}
a<-table.row.start(a)
a<-table.element(a, '- - - ',1,TRUE)
a<-table.element(a, ' ',nc,FALSE)
a<-table.row.end(a)
a<-table.row.start(a)
a<-table.element(a, 'Residual Std. Err. ',1,TRUE)
a<-table.element(a, paste(round(sumlmxdf$'sigma', digits=3), ' on ', sumlmxdf$'df'[2], 'df') ,nc, FALSE)
a<-table.row.end(a)
a<-table.row.start(a)
a<-table.element(a, 'Multiple R-sq. ',1,TRUE)
a<-table.element(a, round(sumlmxdf$'r.squared', digits=3) ,nc, FALSE)
a<-table.row.end(a)
a<-table.row.start(a)
a<-table.element(a, 'Adjusted R-sq. ',1,TRUE)
a<-table.element(a, round(sumlmxdf$'adj.r.squared', digits=3) ,nc, FALSE)
a<-table.row.end(a)
a<-table.end(a)
table.save(a,file='mytable.tab')
a<-table.start()
a<-table.row.start(a)
a<-table.element(a,'ANOVA Statistics', 5+1,TRUE)
a<-table.row.end(a)
a<-table.row.start(a)
a<-table.element(a, ' ',1,TRUE)
a<-table.element(a, 'Df',1,TRUE)
a<-table.element(a, 'Sum Sq',1,TRUE)
a<-table.element(a, 'Mean Sq',1,TRUE)
a<-table.element(a, 'F value',1,TRUE)
a<-table.element(a, 'Pr(>F)',1,TRUE)
a<-table.row.end(a)
a<-table.row.start(a)
a<-table.element(a, V2,1,TRUE)
a<-table.element(a, anova.xdf$Df[1])
a<-table.element(a, round(anova.xdf$'Sum Sq'[1], digits=3))
a<-table.element(a, round(anova.xdf$'Mean Sq'[1], digits=3))
a<-table.element(a, round(anova.xdf$'F value'[1], digits=3))
a<-table.element(a, round(anova.xdf$'Pr(>F)'[1], digits=3))
a<-table.row.end(a)
a<-table.row.start(a)
a<-table.element(a, 'Residuals',1,TRUE)
a<-table.element(a, anova.xdf$Df[2])
a<-table.element(a, round(anova.xdf$'Sum Sq'[2], digits=3))
a<-table.element(a, round(anova.xdf$'Mean Sq'[2], digits=3))
a<-table.element(a, ' ')
a<-table.row.end(a)
a<-table.end(a)
table.save(a,file='mytable1.tab')
bitmap(file='regressionplot.png')
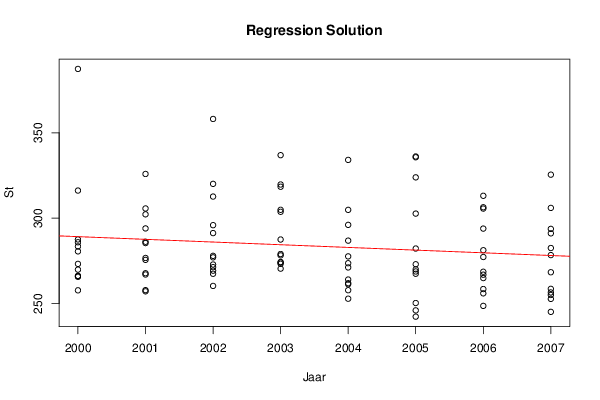
plot(Y~ X, data=xdf, xlab=V2, ylab=V1, main='Regression Solution')
if(intercept == TRUE) abline(coef(lmxdf), col='red')
if(intercept == FALSE) abline(0.0, coef(lmxdf), col='red')
dev.off()
library(car)
bitmap(file='residualsQQplot.png')
qq.plot(resid(lmxdf), main='QQplot of Residuals of Fit')
dev.off()
bitmap(file='residualsplot.png')
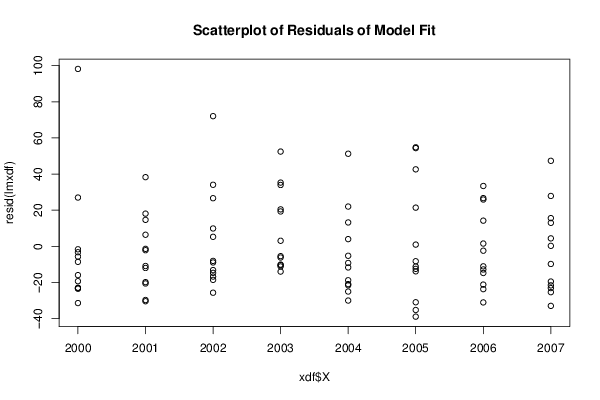
plot(xdf$X, resid(lmxdf), main='Scatterplot of Residuals of Model Fit')
dev.off()
bitmap(file='cooksDistanceLmplot.png')
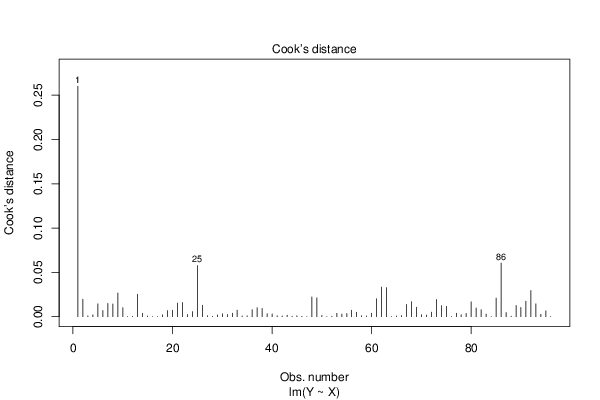
plot.lm(lmxdf, which=4)
dev.off()