Free Statistics

of Irreproducible Research!

Author's title

Author*Unverified author*
R Software Modulerwasp_autocorrelation.wasp
Title produced by software(Partial) Autocorrelation Function
Date of computationThu, 18 Dec 2014 14:30:22 +0000
Cite this page as followsStatistical Computations at FreeStatistics.org, Office for Research Development and Education, URL https://freestatistics.org/blog/index.php?v=date/2014/Dec/18/t1418913035qy9tua8hf13lzrb.htm/, Retrieved Fri, 17 May 2024 13:29:13 +0000
Statistical Computations at FreeStatistics.org, Office for Research Development and Education, URL https://freestatistics.org/blog/index.php?pk=270997, Retrieved Fri, 17 May 2024 13:29:13 +0000
QR Codes:

Original text written by user:
IsPrivate?No (this computation is public)
User-defined keywords
Estimated Impact79
Family? (F = Feedback message, R = changed R code, M = changed R Module, P = changed Parameters, D = changed Data)
-       [(Partial) Autocorrelation Function] [] [2014-12-18 14:30:22] [d4b037465b17855a5e62fa4428b30753] [Current]
Feedback Forum

Post a new message
Dataseries X:
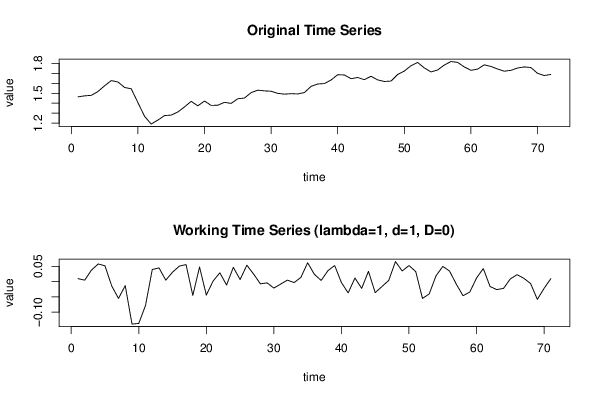
1.464
1.474
1.479
1.517
1.575
1.627
1.613
1.558
1.545
1.406
1.269
1.191
1.231
1.276
1.281
1.312
1.363
1.419
1.374
1.422
1.378
1.38
1.409
1.398
1.445
1.452
1.506
1.531
1.524
1.52
1.499
1.491
1.496
1.493
1.507
1.569
1.593
1.597
1.633
1.686
1.683
1.646
1.658
1.636
1.67
1.634
1.618
1.622
1.688
1.723
1.776
1.809
1.754
1.714
1.733
1.783
1.818
1.81
1.764
1.73
1.742
1.785
1.769
1.743
1.721
1.73
1.753
1.764
1.758
1.7
1.678
1.688


Summary of computational transaction
Raw Inputview raw input (R code)
Raw Outputview raw output of R engine
Computing time2 seconds
R Server'Sir Ronald Aylmer Fisher' @ fisher.wessa.net

\begin{tabular}{lllllllll}
\hline
Summary of computational transaction \tabularnewline
Raw Input & view raw input (R code)  \tabularnewline
Raw Output & view raw output of R engine  \tabularnewline
Computing time & 2 seconds \tabularnewline
R Server & 'Sir Ronald Aylmer Fisher' @ fisher.wessa.net \tabularnewline
\hline
\end{tabular}
%Source: https://freestatistics.org/blog/index.php?pk=270997&T=0

[TABLE]
[ROW][C]Summary of computational transaction[/C][/ROW]
[ROW][C]Raw Input[/C][C]view raw input (R code) [/C][/ROW]
[ROW][C]Raw Output[/C][C]view raw output of R engine [/C][/ROW]
[ROW][C]Computing time[/C][C]2 seconds[/C][/ROW]
[ROW][C]R Server[/C][C]'Sir Ronald Aylmer Fisher' @ fisher.wessa.net[/C][/ROW]
[/TABLE]
Source: https://freestatistics.org/blog/index.php?pk=270997&T=0

Globally Unique Identifier (entire table): ba.freestatistics.org/blog/index.php?pk=270997&T=0

As an alternative you can also use a QR Code:  

The GUIDs for individual cells are displayed in the table below:

Summary of computational transaction
Raw Inputview raw input (R code)
Raw Outputview raw output of R engine
Computing time2 seconds
R Server'Sir Ronald Aylmer Fisher' @ fisher.wessa.net


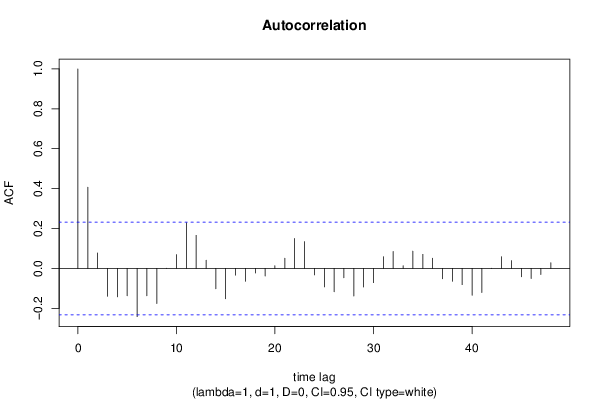
Autocorrelation Function
Time lag kACF(k)T-STATP-value
10.406723.42710.000509
20.0773470.65170.258338
3-0.139541-1.17580.121803
4-0.142673-1.20220.116643
5-0.137033-1.15470.126051
6-0.241953-2.03870.022601
7-0.13717-1.15580.125816
8-0.176221-1.48490.071003
90.0002480.00210.499169
100.0690620.58190.281229
110.2287471.92750.028962
120.1654881.39440.083768
130.0410550.34590.365207
14-0.10176-0.85740.197043
15-0.152522-1.28520.101454
16-0.033903-0.28570.387982
17-0.064493-0.54340.29427
18-0.023388-0.19710.422167
19-0.038148-0.32140.37441
200.0134150.1130.455161
210.0512330.43170.333634
220.1498881.2630.105364
230.1341941.13070.130984
24-0.032463-0.27350.392616
25-0.092584-0.78010.218955
26-0.117125-0.98690.163518
27-0.047308-0.39860.345685
28-0.138117-1.16380.124202
29-0.093739-0.78990.21612
30-0.071578-0.60310.274174
310.0584380.49240.311975
320.0849970.71620.23811
330.0129930.10950.456565
340.0864660.72860.23433
350.0704720.59380.277264
360.0508120.42810.334919
37-0.051708-0.43570.332189
38-0.064251-0.54140.294966
39-0.081516-0.68690.247203
40-0.134797-1.13580.129926
41-0.121004-1.01960.15569
420.0002740.00230.499082
430.05860.49380.311496
440.0388970.32770.372033
45-0.042026-0.35410.36215
46-0.050654-0.42680.335403
47-0.030827-0.25980.397902
480.0282510.2380.406264

\begin{tabular}{lllllllll}
\hline
Autocorrelation Function \tabularnewline
Time lag k & ACF(k) & T-STAT & P-value \tabularnewline
1 & 0.40672 & 3.4271 & 0.000509 \tabularnewline
2 & 0.077347 & 0.6517 & 0.258338 \tabularnewline
3 & -0.139541 & -1.1758 & 0.121803 \tabularnewline
4 & -0.142673 & -1.2022 & 0.116643 \tabularnewline
5 & -0.137033 & -1.1547 & 0.126051 \tabularnewline
6 & -0.241953 & -2.0387 & 0.022601 \tabularnewline
7 & -0.13717 & -1.1558 & 0.125816 \tabularnewline
8 & -0.176221 & -1.4849 & 0.071003 \tabularnewline
9 & 0.000248 & 0.0021 & 0.499169 \tabularnewline
10 & 0.069062 & 0.5819 & 0.281229 \tabularnewline
11 & 0.228747 & 1.9275 & 0.028962 \tabularnewline
12 & 0.165488 & 1.3944 & 0.083768 \tabularnewline
13 & 0.041055 & 0.3459 & 0.365207 \tabularnewline
14 & -0.10176 & -0.8574 & 0.197043 \tabularnewline
15 & -0.152522 & -1.2852 & 0.101454 \tabularnewline
16 & -0.033903 & -0.2857 & 0.387982 \tabularnewline
17 & -0.064493 & -0.5434 & 0.29427 \tabularnewline
18 & -0.023388 & -0.1971 & 0.422167 \tabularnewline
19 & -0.038148 & -0.3214 & 0.37441 \tabularnewline
20 & 0.013415 & 0.113 & 0.455161 \tabularnewline
21 & 0.051233 & 0.4317 & 0.333634 \tabularnewline
22 & 0.149888 & 1.263 & 0.105364 \tabularnewline
23 & 0.134194 & 1.1307 & 0.130984 \tabularnewline
24 & -0.032463 & -0.2735 & 0.392616 \tabularnewline
25 & -0.092584 & -0.7801 & 0.218955 \tabularnewline
26 & -0.117125 & -0.9869 & 0.163518 \tabularnewline
27 & -0.047308 & -0.3986 & 0.345685 \tabularnewline
28 & -0.138117 & -1.1638 & 0.124202 \tabularnewline
29 & -0.093739 & -0.7899 & 0.21612 \tabularnewline
30 & -0.071578 & -0.6031 & 0.274174 \tabularnewline
31 & 0.058438 & 0.4924 & 0.311975 \tabularnewline
32 & 0.084997 & 0.7162 & 0.23811 \tabularnewline
33 & 0.012993 & 0.1095 & 0.456565 \tabularnewline
34 & 0.086466 & 0.7286 & 0.23433 \tabularnewline
35 & 0.070472 & 0.5938 & 0.277264 \tabularnewline
36 & 0.050812 & 0.4281 & 0.334919 \tabularnewline
37 & -0.051708 & -0.4357 & 0.332189 \tabularnewline
38 & -0.064251 & -0.5414 & 0.294966 \tabularnewline
39 & -0.081516 & -0.6869 & 0.247203 \tabularnewline
40 & -0.134797 & -1.1358 & 0.129926 \tabularnewline
41 & -0.121004 & -1.0196 & 0.15569 \tabularnewline
42 & 0.000274 & 0.0023 & 0.499082 \tabularnewline
43 & 0.0586 & 0.4938 & 0.311496 \tabularnewline
44 & 0.038897 & 0.3277 & 0.372033 \tabularnewline
45 & -0.042026 & -0.3541 & 0.36215 \tabularnewline
46 & -0.050654 & -0.4268 & 0.335403 \tabularnewline
47 & -0.030827 & -0.2598 & 0.397902 \tabularnewline
48 & 0.028251 & 0.238 & 0.406264 \tabularnewline
\hline
\end{tabular}
%Source: https://freestatistics.org/blog/index.php?pk=270997&T=1

[TABLE]
[ROW][C]Autocorrelation Function[/C][/ROW]
[ROW][C]Time lag k[/C][C]ACF(k)[/C][C]T-STAT[/C][C]P-value[/C][/ROW]
[ROW][C]1[/C][C]0.40672[/C][C]3.4271[/C][C]0.000509[/C][/ROW]
[ROW][C]2[/C][C]0.077347[/C][C]0.6517[/C][C]0.258338[/C][/ROW]
[ROW][C]3[/C][C]-0.139541[/C][C]-1.1758[/C][C]0.121803[/C][/ROW]
[ROW][C]4[/C][C]-0.142673[/C][C]-1.2022[/C][C]0.116643[/C][/ROW]
[ROW][C]5[/C][C]-0.137033[/C][C]-1.1547[/C][C]0.126051[/C][/ROW]
[ROW][C]6[/C][C]-0.241953[/C][C]-2.0387[/C][C]0.022601[/C][/ROW]
[ROW][C]7[/C][C]-0.13717[/C][C]-1.1558[/C][C]0.125816[/C][/ROW]
[ROW][C]8[/C][C]-0.176221[/C][C]-1.4849[/C][C]0.071003[/C][/ROW]
[ROW][C]9[/C][C]0.000248[/C][C]0.0021[/C][C]0.499169[/C][/ROW]
[ROW][C]10[/C][C]0.069062[/C][C]0.5819[/C][C]0.281229[/C][/ROW]
[ROW][C]11[/C][C]0.228747[/C][C]1.9275[/C][C]0.028962[/C][/ROW]
[ROW][C]12[/C][C]0.165488[/C][C]1.3944[/C][C]0.083768[/C][/ROW]
[ROW][C]13[/C][C]0.041055[/C][C]0.3459[/C][C]0.365207[/C][/ROW]
[ROW][C]14[/C][C]-0.10176[/C][C]-0.8574[/C][C]0.197043[/C][/ROW]
[ROW][C]15[/C][C]-0.152522[/C][C]-1.2852[/C][C]0.101454[/C][/ROW]
[ROW][C]16[/C][C]-0.033903[/C][C]-0.2857[/C][C]0.387982[/C][/ROW]
[ROW][C]17[/C][C]-0.064493[/C][C]-0.5434[/C][C]0.29427[/C][/ROW]
[ROW][C]18[/C][C]-0.023388[/C][C]-0.1971[/C][C]0.422167[/C][/ROW]
[ROW][C]19[/C][C]-0.038148[/C][C]-0.3214[/C][C]0.37441[/C][/ROW]
[ROW][C]20[/C][C]0.013415[/C][C]0.113[/C][C]0.455161[/C][/ROW]
[ROW][C]21[/C][C]0.051233[/C][C]0.4317[/C][C]0.333634[/C][/ROW]
[ROW][C]22[/C][C]0.149888[/C][C]1.263[/C][C]0.105364[/C][/ROW]
[ROW][C]23[/C][C]0.134194[/C][C]1.1307[/C][C]0.130984[/C][/ROW]
[ROW][C]24[/C][C]-0.032463[/C][C]-0.2735[/C][C]0.392616[/C][/ROW]
[ROW][C]25[/C][C]-0.092584[/C][C]-0.7801[/C][C]0.218955[/C][/ROW]
[ROW][C]26[/C][C]-0.117125[/C][C]-0.9869[/C][C]0.163518[/C][/ROW]
[ROW][C]27[/C][C]-0.047308[/C][C]-0.3986[/C][C]0.345685[/C][/ROW]
[ROW][C]28[/C][C]-0.138117[/C][C]-1.1638[/C][C]0.124202[/C][/ROW]
[ROW][C]29[/C][C]-0.093739[/C][C]-0.7899[/C][C]0.21612[/C][/ROW]
[ROW][C]30[/C][C]-0.071578[/C][C]-0.6031[/C][C]0.274174[/C][/ROW]
[ROW][C]31[/C][C]0.058438[/C][C]0.4924[/C][C]0.311975[/C][/ROW]
[ROW][C]32[/C][C]0.084997[/C][C]0.7162[/C][C]0.23811[/C][/ROW]
[ROW][C]33[/C][C]0.012993[/C][C]0.1095[/C][C]0.456565[/C][/ROW]
[ROW][C]34[/C][C]0.086466[/C][C]0.7286[/C][C]0.23433[/C][/ROW]
[ROW][C]35[/C][C]0.070472[/C][C]0.5938[/C][C]0.277264[/C][/ROW]
[ROW][C]36[/C][C]0.050812[/C][C]0.4281[/C][C]0.334919[/C][/ROW]
[ROW][C]37[/C][C]-0.051708[/C][C]-0.4357[/C][C]0.332189[/C][/ROW]
[ROW][C]38[/C][C]-0.064251[/C][C]-0.5414[/C][C]0.294966[/C][/ROW]
[ROW][C]39[/C][C]-0.081516[/C][C]-0.6869[/C][C]0.247203[/C][/ROW]
[ROW][C]40[/C][C]-0.134797[/C][C]-1.1358[/C][C]0.129926[/C][/ROW]
[ROW][C]41[/C][C]-0.121004[/C][C]-1.0196[/C][C]0.15569[/C][/ROW]
[ROW][C]42[/C][C]0.000274[/C][C]0.0023[/C][C]0.499082[/C][/ROW]
[ROW][C]43[/C][C]0.0586[/C][C]0.4938[/C][C]0.311496[/C][/ROW]
[ROW][C]44[/C][C]0.038897[/C][C]0.3277[/C][C]0.372033[/C][/ROW]
[ROW][C]45[/C][C]-0.042026[/C][C]-0.3541[/C][C]0.36215[/C][/ROW]
[ROW][C]46[/C][C]-0.050654[/C][C]-0.4268[/C][C]0.335403[/C][/ROW]
[ROW][C]47[/C][C]-0.030827[/C][C]-0.2598[/C][C]0.397902[/C][/ROW]
[ROW][C]48[/C][C]0.028251[/C][C]0.238[/C][C]0.406264[/C][/ROW]
[/TABLE]
Source: https://freestatistics.org/blog/index.php?pk=270997&T=1

Globally Unique Identifier (entire table): ba.freestatistics.org/blog/index.php?pk=270997&T=1

As an alternative you can also use a QR Code:  

The GUIDs for individual cells are displayed in the table below:

Autocorrelation Function
Time lag kACF(k)T-STATP-value
10.406723.42710.000509
20.0773470.65170.258338
3-0.139541-1.17580.121803
4-0.142673-1.20220.116643
5-0.137033-1.15470.126051
6-0.241953-2.03870.022601
7-0.13717-1.15580.125816
8-0.176221-1.48490.071003
90.0002480.00210.499169
100.0690620.58190.281229
110.2287471.92750.028962
120.1654881.39440.083768
130.0410550.34590.365207
14-0.10176-0.85740.197043
15-0.152522-1.28520.101454
16-0.033903-0.28570.387982
17-0.064493-0.54340.29427
18-0.023388-0.19710.422167
19-0.038148-0.32140.37441
200.0134150.1130.455161
210.0512330.43170.333634
220.1498881.2630.105364
230.1341941.13070.130984
24-0.032463-0.27350.392616
25-0.092584-0.78010.218955
26-0.117125-0.98690.163518
27-0.047308-0.39860.345685
28-0.138117-1.16380.124202
29-0.093739-0.78990.21612
30-0.071578-0.60310.274174
310.0584380.49240.311975
320.0849970.71620.23811
330.0129930.10950.456565
340.0864660.72860.23433
350.0704720.59380.277264
360.0508120.42810.334919
37-0.051708-0.43570.332189
38-0.064251-0.54140.294966
39-0.081516-0.68690.247203
40-0.134797-1.13580.129926
41-0.121004-1.01960.15569
420.0002740.00230.499082
430.05860.49380.311496
440.0388970.32770.372033
45-0.042026-0.35410.36215
46-0.050654-0.42680.335403
47-0.030827-0.25980.397902
480.0282510.2380.406264


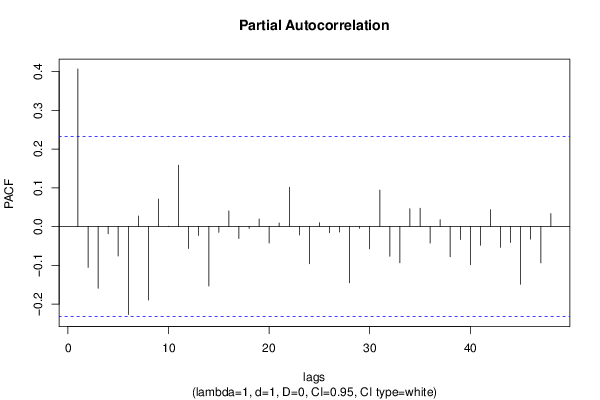
Partial Autocorrelation Function
Time lag kPACF(k)T-STATP-value
10.406723.42710.000509
2-0.105532-0.88920.188442
3-0.159214-1.34160.092006
4-0.018516-0.1560.438231
5-0.076232-0.64230.261359
6-0.226888-1.91180.02997
70.0273020.23010.409356
8-0.18962-1.59780.057268
90.0710650.59880.275604
100.0006370.00540.497867
110.1583581.33430.093177
12-0.056605-0.4770.317427
13-0.02323-0.19570.422686
14-0.153528-1.29370.099989
15-0.015023-0.12660.449812
160.0403360.33990.367477
17-0.030832-0.25980.397885
18-0.004717-0.03970.484205
190.0194190.16360.435244
20-0.042393-0.35720.360996
210.0089340.07530.470101
220.1013350.85390.198027
23-0.021809-0.18380.427361
24-0.096194-0.81050.210169
250.0095790.08070.467949
26-0.016-0.13480.44657
27-0.014308-0.12060.45219
28-0.145282-1.22420.112468
29-0.004885-0.04120.483642
30-0.057603-0.48540.314454
310.0939280.79150.215659
32-0.076797-0.64710.259825
33-0.09366-0.78920.216314
340.045930.3870.349953
350.0473390.39890.345588
36-0.042765-0.36030.359831
370.0174290.14690.441831
38-0.078089-0.6580.256336
39-0.033504-0.28230.389264
40-0.098493-0.82990.204683
41-0.048225-0.40640.342852
420.0433330.36510.358049
43-0.053888-0.45410.325583
44-0.041301-0.3480.364432
45-0.148956-1.25510.106775
46-0.032602-0.27470.392168
47-0.093904-0.79130.215716
480.0332610.28030.390045

\begin{tabular}{lllllllll}
\hline
Partial Autocorrelation Function \tabularnewline
Time lag k & PACF(k) & T-STAT & P-value \tabularnewline
1 & 0.40672 & 3.4271 & 0.000509 \tabularnewline
2 & -0.105532 & -0.8892 & 0.188442 \tabularnewline
3 & -0.159214 & -1.3416 & 0.092006 \tabularnewline
4 & -0.018516 & -0.156 & 0.438231 \tabularnewline
5 & -0.076232 & -0.6423 & 0.261359 \tabularnewline
6 & -0.226888 & -1.9118 & 0.02997 \tabularnewline
7 & 0.027302 & 0.2301 & 0.409356 \tabularnewline
8 & -0.18962 & -1.5978 & 0.057268 \tabularnewline
9 & 0.071065 & 0.5988 & 0.275604 \tabularnewline
10 & 0.000637 & 0.0054 & 0.497867 \tabularnewline
11 & 0.158358 & 1.3343 & 0.093177 \tabularnewline
12 & -0.056605 & -0.477 & 0.317427 \tabularnewline
13 & -0.02323 & -0.1957 & 0.422686 \tabularnewline
14 & -0.153528 & -1.2937 & 0.099989 \tabularnewline
15 & -0.015023 & -0.1266 & 0.449812 \tabularnewline
16 & 0.040336 & 0.3399 & 0.367477 \tabularnewline
17 & -0.030832 & -0.2598 & 0.397885 \tabularnewline
18 & -0.004717 & -0.0397 & 0.484205 \tabularnewline
19 & 0.019419 & 0.1636 & 0.435244 \tabularnewline
20 & -0.042393 & -0.3572 & 0.360996 \tabularnewline
21 & 0.008934 & 0.0753 & 0.470101 \tabularnewline
22 & 0.101335 & 0.8539 & 0.198027 \tabularnewline
23 & -0.021809 & -0.1838 & 0.427361 \tabularnewline
24 & -0.096194 & -0.8105 & 0.210169 \tabularnewline
25 & 0.009579 & 0.0807 & 0.467949 \tabularnewline
26 & -0.016 & -0.1348 & 0.44657 \tabularnewline
27 & -0.014308 & -0.1206 & 0.45219 \tabularnewline
28 & -0.145282 & -1.2242 & 0.112468 \tabularnewline
29 & -0.004885 & -0.0412 & 0.483642 \tabularnewline
30 & -0.057603 & -0.4854 & 0.314454 \tabularnewline
31 & 0.093928 & 0.7915 & 0.215659 \tabularnewline
32 & -0.076797 & -0.6471 & 0.259825 \tabularnewline
33 & -0.09366 & -0.7892 & 0.216314 \tabularnewline
34 & 0.04593 & 0.387 & 0.349953 \tabularnewline
35 & 0.047339 & 0.3989 & 0.345588 \tabularnewline
36 & -0.042765 & -0.3603 & 0.359831 \tabularnewline
37 & 0.017429 & 0.1469 & 0.441831 \tabularnewline
38 & -0.078089 & -0.658 & 0.256336 \tabularnewline
39 & -0.033504 & -0.2823 & 0.389264 \tabularnewline
40 & -0.098493 & -0.8299 & 0.204683 \tabularnewline
41 & -0.048225 & -0.4064 & 0.342852 \tabularnewline
42 & 0.043333 & 0.3651 & 0.358049 \tabularnewline
43 & -0.053888 & -0.4541 & 0.325583 \tabularnewline
44 & -0.041301 & -0.348 & 0.364432 \tabularnewline
45 & -0.148956 & -1.2551 & 0.106775 \tabularnewline
46 & -0.032602 & -0.2747 & 0.392168 \tabularnewline
47 & -0.093904 & -0.7913 & 0.215716 \tabularnewline
48 & 0.033261 & 0.2803 & 0.390045 \tabularnewline
\hline
\end{tabular}
%Source: https://freestatistics.org/blog/index.php?pk=270997&T=2

[TABLE]
[ROW][C]Partial Autocorrelation Function[/C][/ROW]
[ROW][C]Time lag k[/C][C]PACF(k)[/C][C]T-STAT[/C][C]P-value[/C][/ROW]
[ROW][C]1[/C][C]0.40672[/C][C]3.4271[/C][C]0.000509[/C][/ROW]
[ROW][C]2[/C][C]-0.105532[/C][C]-0.8892[/C][C]0.188442[/C][/ROW]
[ROW][C]3[/C][C]-0.159214[/C][C]-1.3416[/C][C]0.092006[/C][/ROW]
[ROW][C]4[/C][C]-0.018516[/C][C]-0.156[/C][C]0.438231[/C][/ROW]
[ROW][C]5[/C][C]-0.076232[/C][C]-0.6423[/C][C]0.261359[/C][/ROW]
[ROW][C]6[/C][C]-0.226888[/C][C]-1.9118[/C][C]0.02997[/C][/ROW]
[ROW][C]7[/C][C]0.027302[/C][C]0.2301[/C][C]0.409356[/C][/ROW]
[ROW][C]8[/C][C]-0.18962[/C][C]-1.5978[/C][C]0.057268[/C][/ROW]
[ROW][C]9[/C][C]0.071065[/C][C]0.5988[/C][C]0.275604[/C][/ROW]
[ROW][C]10[/C][C]0.000637[/C][C]0.0054[/C][C]0.497867[/C][/ROW]
[ROW][C]11[/C][C]0.158358[/C][C]1.3343[/C][C]0.093177[/C][/ROW]
[ROW][C]12[/C][C]-0.056605[/C][C]-0.477[/C][C]0.317427[/C][/ROW]
[ROW][C]13[/C][C]-0.02323[/C][C]-0.1957[/C][C]0.422686[/C][/ROW]
[ROW][C]14[/C][C]-0.153528[/C][C]-1.2937[/C][C]0.099989[/C][/ROW]
[ROW][C]15[/C][C]-0.015023[/C][C]-0.1266[/C][C]0.449812[/C][/ROW]
[ROW][C]16[/C][C]0.040336[/C][C]0.3399[/C][C]0.367477[/C][/ROW]
[ROW][C]17[/C][C]-0.030832[/C][C]-0.2598[/C][C]0.397885[/C][/ROW]
[ROW][C]18[/C][C]-0.004717[/C][C]-0.0397[/C][C]0.484205[/C][/ROW]
[ROW][C]19[/C][C]0.019419[/C][C]0.1636[/C][C]0.435244[/C][/ROW]
[ROW][C]20[/C][C]-0.042393[/C][C]-0.3572[/C][C]0.360996[/C][/ROW]
[ROW][C]21[/C][C]0.008934[/C][C]0.0753[/C][C]0.470101[/C][/ROW]
[ROW][C]22[/C][C]0.101335[/C][C]0.8539[/C][C]0.198027[/C][/ROW]
[ROW][C]23[/C][C]-0.021809[/C][C]-0.1838[/C][C]0.427361[/C][/ROW]
[ROW][C]24[/C][C]-0.096194[/C][C]-0.8105[/C][C]0.210169[/C][/ROW]
[ROW][C]25[/C][C]0.009579[/C][C]0.0807[/C][C]0.467949[/C][/ROW]
[ROW][C]26[/C][C]-0.016[/C][C]-0.1348[/C][C]0.44657[/C][/ROW]
[ROW][C]27[/C][C]-0.014308[/C][C]-0.1206[/C][C]0.45219[/C][/ROW]
[ROW][C]28[/C][C]-0.145282[/C][C]-1.2242[/C][C]0.112468[/C][/ROW]
[ROW][C]29[/C][C]-0.004885[/C][C]-0.0412[/C][C]0.483642[/C][/ROW]
[ROW][C]30[/C][C]-0.057603[/C][C]-0.4854[/C][C]0.314454[/C][/ROW]
[ROW][C]31[/C][C]0.093928[/C][C]0.7915[/C][C]0.215659[/C][/ROW]
[ROW][C]32[/C][C]-0.076797[/C][C]-0.6471[/C][C]0.259825[/C][/ROW]
[ROW][C]33[/C][C]-0.09366[/C][C]-0.7892[/C][C]0.216314[/C][/ROW]
[ROW][C]34[/C][C]0.04593[/C][C]0.387[/C][C]0.349953[/C][/ROW]
[ROW][C]35[/C][C]0.047339[/C][C]0.3989[/C][C]0.345588[/C][/ROW]
[ROW][C]36[/C][C]-0.042765[/C][C]-0.3603[/C][C]0.359831[/C][/ROW]
[ROW][C]37[/C][C]0.017429[/C][C]0.1469[/C][C]0.441831[/C][/ROW]
[ROW][C]38[/C][C]-0.078089[/C][C]-0.658[/C][C]0.256336[/C][/ROW]
[ROW][C]39[/C][C]-0.033504[/C][C]-0.2823[/C][C]0.389264[/C][/ROW]
[ROW][C]40[/C][C]-0.098493[/C][C]-0.8299[/C][C]0.204683[/C][/ROW]
[ROW][C]41[/C][C]-0.048225[/C][C]-0.4064[/C][C]0.342852[/C][/ROW]
[ROW][C]42[/C][C]0.043333[/C][C]0.3651[/C][C]0.358049[/C][/ROW]
[ROW][C]43[/C][C]-0.053888[/C][C]-0.4541[/C][C]0.325583[/C][/ROW]
[ROW][C]44[/C][C]-0.041301[/C][C]-0.348[/C][C]0.364432[/C][/ROW]
[ROW][C]45[/C][C]-0.148956[/C][C]-1.2551[/C][C]0.106775[/C][/ROW]
[ROW][C]46[/C][C]-0.032602[/C][C]-0.2747[/C][C]0.392168[/C][/ROW]
[ROW][C]47[/C][C]-0.093904[/C][C]-0.7913[/C][C]0.215716[/C][/ROW]
[ROW][C]48[/C][C]0.033261[/C][C]0.2803[/C][C]0.390045[/C][/ROW]
[/TABLE]
Source: https://freestatistics.org/blog/index.php?pk=270997&T=2

Globally Unique Identifier (entire table): ba.freestatistics.org/blog/index.php?pk=270997&T=2

As an alternative you can also use a QR Code:  

The GUIDs for individual cells are displayed in the table below:

Partial Autocorrelation Function
Time lag kPACF(k)T-STATP-value
10.406723.42710.000509
2-0.105532-0.88920.188442
3-0.159214-1.34160.092006
4-0.018516-0.1560.438231
5-0.076232-0.64230.261359
6-0.226888-1.91180.02997
70.0273020.23010.409356
8-0.18962-1.59780.057268
90.0710650.59880.275604
100.0006370.00540.497867
110.1583581.33430.093177
12-0.056605-0.4770.317427
13-0.02323-0.19570.422686
14-0.153528-1.29370.099989
15-0.015023-0.12660.449812
160.0403360.33990.367477
17-0.030832-0.25980.397885
18-0.004717-0.03970.484205
190.0194190.16360.435244
20-0.042393-0.35720.360996
210.0089340.07530.470101
220.1013350.85390.198027
23-0.021809-0.18380.427361
24-0.096194-0.81050.210169
250.0095790.08070.467949
26-0.016-0.13480.44657
27-0.014308-0.12060.45219
28-0.145282-1.22420.112468
29-0.004885-0.04120.483642
30-0.057603-0.48540.314454
310.0939280.79150.215659
32-0.076797-0.64710.259825
33-0.09366-0.78920.216314
340.045930.3870.349953
350.0473390.39890.345588
36-0.042765-0.36030.359831
370.0174290.14690.441831
38-0.078089-0.6580.256336
39-0.033504-0.28230.389264
40-0.098493-0.82990.204683
41-0.048225-0.40640.342852
420.0433330.36510.358049
43-0.053888-0.45410.325583
44-0.041301-0.3480.364432
45-0.148956-1.25510.106775
46-0.032602-0.27470.392168
47-0.093904-0.79130.215716
480.0332610.28030.390045


Parameters (Session):
par1 = 48 ; par2 = 1 ; par3 = 1 ; par4 = 0 ; par5 = 12 ; par6 = White Noise ; par7 = 0.95 ;
Parameters (R input):
par1 = 48 ; par2 = 1 ; par3 = 1 ; par4 = 0 ; par5 = 12 ; par6 = White Noise ; par7 = 0.95 ; par8 = ;
R code (references can be found in the software module):
par8 <- ''
par7 <- '0.95'
par6 <- 'White Noise'
par5 <- '12'
par4 <- '0'
par3 <- '0'
par2 <- '1'
par1 <- '48'
if (par1 == 'Default') {
par1 = 10*log10(length(x))
} else {
par1 <- as.numeric(par1)
}
par2 <- as.numeric(par2)
par3 <- as.numeric(par3)
par4 <- as.numeric(par4)
par5 <- as.numeric(par5)
if (par6 == 'White Noise') par6 <- 'white' else par6 <- 'ma'
par7 <- as.numeric(par7)
if (par8 != '') par8 <- as.numeric(par8)
ox <- x
if (par8 == '') {
if (par2 == 0) {
x <- log(x)
} else {
x <- (x ^ par2 - 1) / par2
}
} else {
x <- log(x,base=par8)
}
if (par3 > 0) x <- diff(x,lag=1,difference=par3)
if (par4 > 0) x <- diff(x,lag=par5,difference=par4)
bitmap(file='picts.png')
op <- par(mfrow=c(2,1))
plot(ox,type='l',main='Original Time Series',xlab='time',ylab='value')
if (par8=='') {
mytitle <- paste('Working Time Series (lambda=',par2,', d=',par3,', D=',par4,')',sep='')
mysub <- paste('(lambda=',par2,', d=',par3,', D=',par4,', CI=', par7, ', CI type=',par6,')',sep='')
} else {
mytitle <- paste('Working Time Series (base=',par8,', d=',par3,', D=',par4,')',sep='')
mysub <- paste('(base=',par8,', d=',par3,', D=',par4,', CI=', par7, ', CI type=',par6,')',sep='')
}
plot(x,type='l', main=mytitle,xlab='time',ylab='value')
par(op)
dev.off()
bitmap(file='pic1.png')
racf <- acf(x, par1, main='Autocorrelation', xlab='time lag', ylab='ACF', ci.type=par6, ci=par7, sub=mysub)
dev.off()
bitmap(file='pic2.png')
rpacf <- pacf(x,par1,main='Partial Autocorrelation',xlab='lags',ylab='PACF',sub=mysub)
dev.off()
(myacf <- c(racf$acf))
(mypacf <- c(rpacf$acf))
lengthx <- length(x)
sqrtn <- sqrt(lengthx)
load(file='createtable')
a<-table.start()
a<-table.row.start(a)
a<-table.element(a,'Autocorrelation Function',4,TRUE)
a<-table.row.end(a)
a<-table.row.start(a)
a<-table.element(a,'Time lag k',header=TRUE)
a<-table.element(a,hyperlink('basics.htm','ACF(k)','click here for more information about the Autocorrelation Function'),header=TRUE)
a<-table.element(a,'T-STAT',header=TRUE)
a<-table.element(a,'P-value',header=TRUE)
a<-table.row.end(a)
for (i in 2:(par1+1)) {
a<-table.row.start(a)
a<-table.element(a,i-1,header=TRUE)
a<-table.element(a,round(myacf[i],6))
mytstat <- myacf[i]*sqrtn
a<-table.element(a,round(mytstat,4))
a<-table.element(a,round(1-pt(abs(mytstat),lengthx),6))
a<-table.row.end(a)
}
a<-table.end(a)
table.save(a,file='mytable.tab')
a<-table.start()
a<-table.row.start(a)
a<-table.element(a,'Partial Autocorrelation Function',4,TRUE)
a<-table.row.end(a)
a<-table.row.start(a)
a<-table.element(a,'Time lag k',header=TRUE)
a<-table.element(a,hyperlink('basics.htm','PACF(k)','click here for more information about the Partial Autocorrelation Function'),header=TRUE)
a<-table.element(a,'T-STAT',header=TRUE)
a<-table.element(a,'P-value',header=TRUE)
a<-table.row.end(a)
for (i in 1:par1) {
a<-table.row.start(a)
a<-table.element(a,i,header=TRUE)
a<-table.element(a,round(mypacf[i],6))
mytstat <- mypacf[i]*sqrtn
a<-table.element(a,round(mytstat,4))
a<-table.element(a,round(1-pt(abs(mytstat),lengthx),6))
a<-table.row.end(a)
}
a<-table.end(a)
table.save(a,file='mytable1.tab')