Free Statistics

of Irreproducible Research!

Author's title

Author*The author of this computation has been verified*
R Software Modulerwasp_multipleregression.wasp
Title produced by softwareMultiple Regression
Date of computationThu, 18 Dec 2014 16:52:06 +0000
Cite this page as followsStatistical Computations at FreeStatistics.org, Office for Research Development and Education, URL https://freestatistics.org/blog/index.php?v=date/2014/Dec/18/t1418921608p4yfbxbz844xb8c.htm/, Retrieved Fri, 17 May 2024 19:47:32 +0000
Statistical Computations at FreeStatistics.org, Office for Research Development and Education, URL https://freestatistics.org/blog/index.php?pk=271138, Retrieved Fri, 17 May 2024 19:47:32 +0000
QR Codes:

Original text written by user:
IsPrivate?No (this computation is public)
User-defined keywords
Estimated Impact84
Family? (F = Feedback message, R = changed R code, M = changed R Module, P = changed Parameters, D = changed Data)
-       [Multiple Regression] [] [2014-12-18 16:52:06] [6ac057e9f6255a74ae39891d7e02481c] [Current]
Feedback Forum

Post a new message
Dataseries X:
0	7.5	1.8	2.1	1.5	12.9
0	2.5	1.6	1.5	1.8	7.4
1	6	2.1	2	2.1	12.2
0	6.5	2.2	2	2.1	12.8
1	1	2.3	2.1	1.9	7.4
1	1	2.1	2	1.6	6.7
1	5.5	2.7	2.3	2.1	12.6
0	8.5	2.1	2.1	2.1	14.8
1	6.5	2.4	2.1	2.2	13.3
1	4.5	2.9	2.2	1.5	11.1
1	2	2.2	2.1	1.9	8.2
1	5	2.1	2.1	2.2	11.4
1	0.5	2.2	2.1	1.6	6.4
1	5	2.2	2	1.5	10.6
0	5	2.7	2.3	1.9	12
0	2.5	1.9	1.8	0.1	6.3
0	5	2	2	2.2	11.3
1	5.5	2.5	2.2	1.8	11.9
0	3.5	2.2	2	1.6	9.3
1	3	2.3	2.1	2.2	9.6
0	4	1.9	2	2.1	10
1	0.5	2.1	1.8	1.9	6.4
1	6.5	3.5	2.2	1.6	13.8
0	4.5	2.1	2.2	1.9	10.8
1	7.5	2.3	1.7	2.2	13.8
1	5.5	2.3	2.1	1.8	11.7
1	4	2.2	2.3	2.4	10.9
1	7.5	3.5	2.7	2.4	16.1
0	7	1.9	1.9	2.5	13.4
1	4	1.9	2	1.9	9.9
0	5.5	1.9	2	2.1	11.5
0	2.5	1.9	1.9	1.9	8.3
0	5.5	2.1	2	2.1	11.7
1	0.5	1.6	2	1.9	6.1
1	3.5	2	2	1.5	9
1	2.5	3.2	2.1	1.9	9.7
1	4.5	2.3	2	2.1	10.8
1	4.5	2.5	1.8	1.5	10.3
0	4.5	1.8	2	2.1	10.4
1	6	2.4	2.2	2.1	12.7
1	2.5	2.8	2.2	1.8	9.3
0	5	2.3	2.1	2.4	11.8
1	0	2	1.8	2.1	5.9
1	5	2.5	1.9	1.9	11.4
1	6.5	2.3	2.1	2.1	13
1	5	1.8	2	1.9	10.8
1	6	1.9	1.9	2.4	12.3
0	4.5	2.6	2.2	2.1	11.3
1	5.5	2	2	2.2	11.8
1	1	2.6	2	2.2	7.9
0	7.5	1.6	1.7	1.8	12.7
1	6	2.2	2	2.1	12.3
1	5	2.1	2.2	2.4	11.6
1	1	1.8	1.7	2.2	6.7
1	5	1.8	2	2.1	10.9
1	6.5	1.9	2.2	1.5	12.1
1	7	2.4	2	1.9	13.3
1	4.5	1.9	1.9	1.8	10.1
0	0	2	2	1.8	5.7
1	8.5	2.1	2	1.6	14.3
0	3.5	1.7	1.6	1.2	8
1	7.5	1.9	2.1	1.8	13.3
1	3.5	2.1	2.1	1.5	9.3
0	6	2.4	2	2.1	12.5
0	1.5	1.8	1.9	2.4	7.6
1	9	2.3	2.2	2.4	15.9
0	3.5	2.1	2.1	1.5	9.2
1	3.5	2	1.8	1.8	9.1
0	4	2.8	2.3	2.1	11.1
1	6.5	2	2.3	2.2	13
1	7.5	2.7	2.2	2.1	14.5
0	6	2.1	2.1	1.9	12.2
0	5	2.9	2.2	2.1	12.3
0	5.5	2	1.9	1.9	11.4
0	3.5	1.8	1.8	1.6	8.8
1	7.5	2.6	2.1	2.4	14.6
1	1	2.5	1.8	1.9	7.3
0	6.5	2.1	2	1.9	12.6
1	NA	2.3	1.7	1.9	NA
0	6.5	2.3	2.1	2.1	13
1	6.5	2.2	2.1	1.8	12.6
0	7	2	2.1	2.1	13.2
0	3.5	2.2	1.8	2.4	9.9
1	1.5	2.1	2	2.1	7.7
0	4	2.1	2.1	2.2	10.5
0	7.5	1.9	1.9	2.1	13.4
0	4.5	2	2.1	2.2	10.9
1	0	1.7	1	1.6	4.3
0	3.5	2.2	2.2	2.4	10.3
1	5.5	2.2	2.1	2.1	11.8
1	5	2.3	1.9	1.9	11.2
0	4.5	2.4	2	2.4	11.4
0	2.5	2.1	1.9	2.1	8.6
0	7.5	1.9	2	1.8	13.2
1	7	1.7	1.8	2.1	12.6
1	0	1.8	2	1.8	5.6
1	4.5	1.5	2	1.9	9.9
0	3	1.9	2	1.9	8.8
1	1.5	1.9	1.8	2.4	7.7
0	3.5	1.7	2	1.8	9


Summary of computational transaction
Raw Inputview raw input (R code)
Raw Outputview raw output of R engine
Computing time6 seconds
R Server'George Udny Yule' @ yule.wessa.net

\begin{tabular}{lllllllll}
\hline
Summary of computational transaction \tabularnewline
Raw Input & view raw input (R code)  \tabularnewline
Raw Output & view raw output of R engine  \tabularnewline
Computing time & 6 seconds \tabularnewline
R Server & 'George Udny Yule' @ yule.wessa.net \tabularnewline
\hline
\end{tabular}
%Source: https://freestatistics.org/blog/index.php?pk=271138&T=0

[TABLE]
[ROW][C]Summary of computational transaction[/C][/ROW]
[ROW][C]Raw Input[/C][C]view raw input (R code) [/C][/ROW]
[ROW][C]Raw Output[/C][C]view raw output of R engine [/C][/ROW]
[ROW][C]Computing time[/C][C]6 seconds[/C][/ROW]
[ROW][C]R Server[/C][C]'George Udny Yule' @ yule.wessa.net[/C][/ROW]
[/TABLE]
Source: https://freestatistics.org/blog/index.php?pk=271138&T=0

Globally Unique Identifier (entire table): ba.freestatistics.org/blog/index.php?pk=271138&T=0

As an alternative you can also use a QR Code:  

The GUIDs for individual cells are displayed in the table below:

Summary of computational transaction
Raw Inputview raw input (R code)
Raw Outputview raw output of R engine
Computing time6 seconds
R Server'George Udny Yule' @ yule.wessa.net


Multiple Linear Regression - Estimated Regression Equation
G[t] = + 0.195434 + 0.38458EX[t] + 0.734645PR[t] + 0.292626PE[t] + 0.418586PA[t] -0.407082TOT[t] + e[t]

\begin{tabular}{lllllllll}
\hline
Multiple Linear Regression - Estimated Regression Equation \tabularnewline
G[t] =  +  0.195434 +  0.38458EX[t] +  0.734645PR[t] +  0.292626PE[t] +  0.418586PA[t] -0.407082TOT[t]  + e[t] \tabularnewline
\hline
\end{tabular}
%Source: https://freestatistics.org/blog/index.php?pk=271138&T=1

[TABLE]
[ROW][C]Multiple Linear Regression - Estimated Regression Equation[/C][/ROW]
[ROW][C]G[t] =  +  0.195434 +  0.38458EX[t] +  0.734645PR[t] +  0.292626PE[t] +  0.418586PA[t] -0.407082TOT[t]  + e[t][/C][/ROW]
[/TABLE]
Source: https://freestatistics.org/blog/index.php?pk=271138&T=1

Globally Unique Identifier (entire table): ba.freestatistics.org/blog/index.php?pk=271138&T=1

As an alternative you can also use a QR Code:  

The GUIDs for individual cells are displayed in the table below:

Multiple Linear Regression - Estimated Regression Equation
G[t] = + 0.195434 + 0.38458EX[t] + 0.734645PR[t] + 0.292626PE[t] + 0.418586PA[t] -0.407082TOT[t] + e[t]


Multiple Linear Regression - Ordinary Least Squares
VariableParameterS.D.T-STATH0: parameter = 02-tail p-value1-tail p-value
(Intercept)0.1954340.5558850.35160.7259540.362977
EX0.384580.8783480.43780.6625140.331257
PR0.7346450.8886260.82670.4105120.205256
PE0.2926260.8846060.33080.7415410.370771
PA0.4185860.9071920.46140.6455830.322792
TOT-0.4070820.876921-0.46420.6435770.321788

\begin{tabular}{lllllllll}
\hline
Multiple Linear Regression - Ordinary Least Squares \tabularnewline
Variable & Parameter & S.D. & T-STATH0: parameter = 0 & 2-tail p-value & 1-tail p-value \tabularnewline
(Intercept) & 0.195434 & 0.555885 & 0.3516 & 0.725954 & 0.362977 \tabularnewline
EX & 0.38458 & 0.878348 & 0.4378 & 0.662514 & 0.331257 \tabularnewline
PR & 0.734645 & 0.888626 & 0.8267 & 0.410512 & 0.205256 \tabularnewline
PE & 0.292626 & 0.884606 & 0.3308 & 0.741541 & 0.370771 \tabularnewline
PA & 0.418586 & 0.907192 & 0.4614 & 0.645583 & 0.322792 \tabularnewline
TOT & -0.407082 & 0.876921 & -0.4642 & 0.643577 & 0.321788 \tabularnewline
\hline
\end{tabular}
%Source: https://freestatistics.org/blog/index.php?pk=271138&T=2

[TABLE]
[ROW][C]Multiple Linear Regression - Ordinary Least Squares[/C][/ROW]
[ROW][C]Variable[/C][C]Parameter[/C][C]S.D.[/C][C]T-STATH0: parameter = 0[/C][C]2-tail p-value[/C][C]1-tail p-value[/C][/ROW]
[ROW][C](Intercept)[/C][C]0.195434[/C][C]0.555885[/C][C]0.3516[/C][C]0.725954[/C][C]0.362977[/C][/ROW]
[ROW][C]EX[/C][C]0.38458[/C][C]0.878348[/C][C]0.4378[/C][C]0.662514[/C][C]0.331257[/C][/ROW]
[ROW][C]PR[/C][C]0.734645[/C][C]0.888626[/C][C]0.8267[/C][C]0.410512[/C][C]0.205256[/C][/ROW]
[ROW][C]PE[/C][C]0.292626[/C][C]0.884606[/C][C]0.3308[/C][C]0.741541[/C][C]0.370771[/C][/ROW]
[ROW][C]PA[/C][C]0.418586[/C][C]0.907192[/C][C]0.4614[/C][C]0.645583[/C][C]0.322792[/C][/ROW]
[ROW][C]TOT[/C][C]-0.407082[/C][C]0.876921[/C][C]-0.4642[/C][C]0.643577[/C][C]0.321788[/C][/ROW]
[/TABLE]
Source: https://freestatistics.org/blog/index.php?pk=271138&T=2

Globally Unique Identifier (entire table): ba.freestatistics.org/blog/index.php?pk=271138&T=2

As an alternative you can also use a QR Code:  

The GUIDs for individual cells are displayed in the table below:

Multiple Linear Regression - Ordinary Least Squares
VariableParameterS.D.T-STATH0: parameter = 02-tail p-value1-tail p-value
(Intercept)0.1954340.5558850.35160.7259540.362977
EX0.384580.8783480.43780.6625140.331257
PR0.7346450.8886260.82670.4105120.205256
PE0.2926260.8846060.33080.7415410.370771
PA0.4185860.9071920.46140.6455830.322792
TOT-0.4070820.876921-0.46420.6435770.321788


Multiple Linear Regression - Regression Statistics
Multiple R0.243828
R-squared0.059452
Adjusted R-squared0.00888493
F-TEST (value)1.17571
F-TEST (DF numerator)5
F-TEST (DF denominator)93
p-value0.327078
Multiple Linear Regression - Residual Statistics
Residual Standard Deviation0.492876
Sum Squared Residuals22.5922

\begin{tabular}{lllllllll}
\hline
Multiple Linear Regression - Regression Statistics \tabularnewline
Multiple R & 0.243828 \tabularnewline
R-squared & 0.059452 \tabularnewline
Adjusted R-squared & 0.00888493 \tabularnewline
F-TEST (value) & 1.17571 \tabularnewline
F-TEST (DF numerator) & 5 \tabularnewline
F-TEST (DF denominator) & 93 \tabularnewline
p-value & 0.327078 \tabularnewline
Multiple Linear Regression - Residual Statistics \tabularnewline
Residual Standard Deviation & 0.492876 \tabularnewline
Sum Squared Residuals & 22.5922 \tabularnewline
\hline
\end{tabular}
%Source: https://freestatistics.org/blog/index.php?pk=271138&T=3

[TABLE]
[ROW][C]Multiple Linear Regression - Regression Statistics[/C][/ROW]
[ROW][C]Multiple R[/C][C]0.243828[/C][/ROW]
[ROW][C]R-squared[/C][C]0.059452[/C][/ROW]
[ROW][C]Adjusted R-squared[/C][C]0.00888493[/C][/ROW]
[ROW][C]F-TEST (value)[/C][C]1.17571[/C][/ROW]
[ROW][C]F-TEST (DF numerator)[/C][C]5[/C][/ROW]
[ROW][C]F-TEST (DF denominator)[/C][C]93[/C][/ROW]
[ROW][C]p-value[/C][C]0.327078[/C][/ROW]
[ROW][C]Multiple Linear Regression - Residual Statistics[/C][/ROW]
[ROW][C]Residual Standard Deviation[/C][C]0.492876[/C][/ROW]
[ROW][C]Sum Squared Residuals[/C][C]22.5922[/C][/ROW]
[/TABLE]
Source: https://freestatistics.org/blog/index.php?pk=271138&T=3

Globally Unique Identifier (entire table): ba.freestatistics.org/blog/index.php?pk=271138&T=3

As an alternative you can also use a QR Code:  

The GUIDs for individual cells are displayed in the table below:

Multiple Linear Regression - Regression Statistics
Multiple R0.243828
R-squared0.059452
Adjusted R-squared0.00888493
F-TEST (value)1.17571
F-TEST (DF numerator)5
F-TEST (DF denominator)93
p-value0.327078
Multiple Linear Regression - Residual Statistics
Residual Standard Deviation0.492876
Sum Squared Residuals22.5922


Multiple Linear Regression - Actuals, Interpolation, and Residuals
Time or IndexActualsInterpolationForecastResidualsPrediction Error
100.393176-0.393176
200.512301-0.512301
310.5435470.456453
400.565052-0.565052
510.6671170.332883
610.6503070.349693
710.7169990.283001
800.475845-0.475845
910.5795610.420439
1010.8095570.190443
1110.6525660.347434
1210.5557540.444246
1310.6828690.317131
1410.6326110.367389
1500.685241-0.685241
1600.556676-0.556676
1700.493735-0.493735
1810.7001890.299811
1900.626807-0.626807
2010.6662710.333729
2100.523039-0.523039
2210.6471920.352808
2310.962240.0377599
2400.5114-0.5114
2510.5700850.429915
2610.6054140.394586
2710.5904220.409578
2810.8917130.108287
2900.430871-0.430871
3010.480030.51997
3100.489285-0.489285
3200.525229-0.525229
3300.554798-0.554798
3410.460520.53948
3510.5601440.439856
3610.9688780.0311222
3710.6835210.316479
3810.7243140.275686
3900.479031-0.479031
4010.6189240.381076
4110.8252570.174743
4200.623567-0.623567
4310.6686960.331304
4410.6655110.334489
4510.5863620.413638
4610.4247710.575229
4710.4522230.547777
4800.758899-0.758899
4910.4824840.517516
5010.7802820.219718
5100.336189-0.336189
5210.5763030.423697
5310.5873170.412683
5410.5932770.406723
5510.467780.53222
5610.4369890.563011
5710.6170120.382988
5810.5197820.480218
5900.683062-0.683062
6010.440830.55917
6100.504207-0.504207
6210.4293840.570616
6310.5407470.459253
6400.641815-0.641815
6500.561435-0.561435
6610.5221120.477888
6700.581455-0.581455
6810.5864870.413513
6900.824217-0.824217
7010.4663530.533647
7110.6834390.316561
7200.489092-0.489092
7300.7645-0.7645
7400.490478-0.490478
7500.477965-0.477965
7610.665580.33442
7710.7669660.233034
7800.489286-0.489286
7911.58636-0.586362
800-0.4498450.449845
8111.47684-0.476842
8200.658901-0.658901
830-0.3551920.355192
8411.53755-0.537548
8500.455726-0.455726
8600.493541-0.493541
870-0.343760.34376
8811.61312-0.613119
890-0.3831830.383183
9010.5999980.400002
9111.63831-0.638312
9200.633751-0.633751
9300.440829-0.440829
940-0.587090.58709
9510.5768410.423159
9610.3784620.621538
9711.54324-0.543241
980-0.4350710.435071
9911.46533-0.465326
1000NANA

\begin{tabular}{lllllllll}
\hline
Multiple Linear Regression - Actuals, Interpolation, and Residuals \tabularnewline
Time or Index & Actuals & InterpolationForecast & ResidualsPrediction Error \tabularnewline
1 & 0 & 0.393176 & -0.393176 \tabularnewline
2 & 0 & 0.512301 & -0.512301 \tabularnewline
3 & 1 & 0.543547 & 0.456453 \tabularnewline
4 & 0 & 0.565052 & -0.565052 \tabularnewline
5 & 1 & 0.667117 & 0.332883 \tabularnewline
6 & 1 & 0.650307 & 0.349693 \tabularnewline
7 & 1 & 0.716999 & 0.283001 \tabularnewline
8 & 0 & 0.475845 & -0.475845 \tabularnewline
9 & 1 & 0.579561 & 0.420439 \tabularnewline
10 & 1 & 0.809557 & 0.190443 \tabularnewline
11 & 1 & 0.652566 & 0.347434 \tabularnewline
12 & 1 & 0.555754 & 0.444246 \tabularnewline
13 & 1 & 0.682869 & 0.317131 \tabularnewline
14 & 1 & 0.632611 & 0.367389 \tabularnewline
15 & 0 & 0.685241 & -0.685241 \tabularnewline
16 & 0 & 0.556676 & -0.556676 \tabularnewline
17 & 0 & 0.493735 & -0.493735 \tabularnewline
18 & 1 & 0.700189 & 0.299811 \tabularnewline
19 & 0 & 0.626807 & -0.626807 \tabularnewline
20 & 1 & 0.666271 & 0.333729 \tabularnewline
21 & 0 & 0.523039 & -0.523039 \tabularnewline
22 & 1 & 0.647192 & 0.352808 \tabularnewline
23 & 1 & 0.96224 & 0.0377599 \tabularnewline
24 & 0 & 0.5114 & -0.5114 \tabularnewline
25 & 1 & 0.570085 & 0.429915 \tabularnewline
26 & 1 & 0.605414 & 0.394586 \tabularnewline
27 & 1 & 0.590422 & 0.409578 \tabularnewline
28 & 1 & 0.891713 & 0.108287 \tabularnewline
29 & 0 & 0.430871 & -0.430871 \tabularnewline
30 & 1 & 0.48003 & 0.51997 \tabularnewline
31 & 0 & 0.489285 & -0.489285 \tabularnewline
32 & 0 & 0.525229 & -0.525229 \tabularnewline
33 & 0 & 0.554798 & -0.554798 \tabularnewline
34 & 1 & 0.46052 & 0.53948 \tabularnewline
35 & 1 & 0.560144 & 0.439856 \tabularnewline
36 & 1 & 0.968878 & 0.0311222 \tabularnewline
37 & 1 & 0.683521 & 0.316479 \tabularnewline
38 & 1 & 0.724314 & 0.275686 \tabularnewline
39 & 0 & 0.479031 & -0.479031 \tabularnewline
40 & 1 & 0.618924 & 0.381076 \tabularnewline
41 & 1 & 0.825257 & 0.174743 \tabularnewline
42 & 0 & 0.623567 & -0.623567 \tabularnewline
43 & 1 & 0.668696 & 0.331304 \tabularnewline
44 & 1 & 0.665511 & 0.334489 \tabularnewline
45 & 1 & 0.586362 & 0.413638 \tabularnewline
46 & 1 & 0.424771 & 0.575229 \tabularnewline
47 & 1 & 0.452223 & 0.547777 \tabularnewline
48 & 0 & 0.758899 & -0.758899 \tabularnewline
49 & 1 & 0.482484 & 0.517516 \tabularnewline
50 & 1 & 0.780282 & 0.219718 \tabularnewline
51 & 0 & 0.336189 & -0.336189 \tabularnewline
52 & 1 & 0.576303 & 0.423697 \tabularnewline
53 & 1 & 0.587317 & 0.412683 \tabularnewline
54 & 1 & 0.593277 & 0.406723 \tabularnewline
55 & 1 & 0.46778 & 0.53222 \tabularnewline
56 & 1 & 0.436989 & 0.563011 \tabularnewline
57 & 1 & 0.617012 & 0.382988 \tabularnewline
58 & 1 & 0.519782 & 0.480218 \tabularnewline
59 & 0 & 0.683062 & -0.683062 \tabularnewline
60 & 1 & 0.44083 & 0.55917 \tabularnewline
61 & 0 & 0.504207 & -0.504207 \tabularnewline
62 & 1 & 0.429384 & 0.570616 \tabularnewline
63 & 1 & 0.540747 & 0.459253 \tabularnewline
64 & 0 & 0.641815 & -0.641815 \tabularnewline
65 & 0 & 0.561435 & -0.561435 \tabularnewline
66 & 1 & 0.522112 & 0.477888 \tabularnewline
67 & 0 & 0.581455 & -0.581455 \tabularnewline
68 & 1 & 0.586487 & 0.413513 \tabularnewline
69 & 0 & 0.824217 & -0.824217 \tabularnewline
70 & 1 & 0.466353 & 0.533647 \tabularnewline
71 & 1 & 0.683439 & 0.316561 \tabularnewline
72 & 0 & 0.489092 & -0.489092 \tabularnewline
73 & 0 & 0.7645 & -0.7645 \tabularnewline
74 & 0 & 0.490478 & -0.490478 \tabularnewline
75 & 0 & 0.477965 & -0.477965 \tabularnewline
76 & 1 & 0.66558 & 0.33442 \tabularnewline
77 & 1 & 0.766966 & 0.233034 \tabularnewline
78 & 0 & 0.489286 & -0.489286 \tabularnewline
79 & 1 & 1.58636 & -0.586362 \tabularnewline
80 & 0 & -0.449845 & 0.449845 \tabularnewline
81 & 1 & 1.47684 & -0.476842 \tabularnewline
82 & 0 & 0.658901 & -0.658901 \tabularnewline
83 & 0 & -0.355192 & 0.355192 \tabularnewline
84 & 1 & 1.53755 & -0.537548 \tabularnewline
85 & 0 & 0.455726 & -0.455726 \tabularnewline
86 & 0 & 0.493541 & -0.493541 \tabularnewline
87 & 0 & -0.34376 & 0.34376 \tabularnewline
88 & 1 & 1.61312 & -0.613119 \tabularnewline
89 & 0 & -0.383183 & 0.383183 \tabularnewline
90 & 1 & 0.599998 & 0.400002 \tabularnewline
91 & 1 & 1.63831 & -0.638312 \tabularnewline
92 & 0 & 0.633751 & -0.633751 \tabularnewline
93 & 0 & 0.440829 & -0.440829 \tabularnewline
94 & 0 & -0.58709 & 0.58709 \tabularnewline
95 & 1 & 0.576841 & 0.423159 \tabularnewline
96 & 1 & 0.378462 & 0.621538 \tabularnewline
97 & 1 & 1.54324 & -0.543241 \tabularnewline
98 & 0 & -0.435071 & 0.435071 \tabularnewline
99 & 1 & 1.46533 & -0.465326 \tabularnewline
100 & 0 & NA & NA \tabularnewline
\hline
\end{tabular}
%Source: https://freestatistics.org/blog/index.php?pk=271138&T=4

[TABLE]
[ROW][C]Multiple Linear Regression - Actuals, Interpolation, and Residuals[/C][/ROW]
[ROW][C]Time or Index[/C][C]Actuals[/C][C]InterpolationForecast[/C][C]ResidualsPrediction Error[/C][/ROW]
[ROW][C]1[/C][C]0[/C][C]0.393176[/C][C]-0.393176[/C][/ROW]
[ROW][C]2[/C][C]0[/C][C]0.512301[/C][C]-0.512301[/C][/ROW]
[ROW][C]3[/C][C]1[/C][C]0.543547[/C][C]0.456453[/C][/ROW]
[ROW][C]4[/C][C]0[/C][C]0.565052[/C][C]-0.565052[/C][/ROW]
[ROW][C]5[/C][C]1[/C][C]0.667117[/C][C]0.332883[/C][/ROW]
[ROW][C]6[/C][C]1[/C][C]0.650307[/C][C]0.349693[/C][/ROW]
[ROW][C]7[/C][C]1[/C][C]0.716999[/C][C]0.283001[/C][/ROW]
[ROW][C]8[/C][C]0[/C][C]0.475845[/C][C]-0.475845[/C][/ROW]
[ROW][C]9[/C][C]1[/C][C]0.579561[/C][C]0.420439[/C][/ROW]
[ROW][C]10[/C][C]1[/C][C]0.809557[/C][C]0.190443[/C][/ROW]
[ROW][C]11[/C][C]1[/C][C]0.652566[/C][C]0.347434[/C][/ROW]
[ROW][C]12[/C][C]1[/C][C]0.555754[/C][C]0.444246[/C][/ROW]
[ROW][C]13[/C][C]1[/C][C]0.682869[/C][C]0.317131[/C][/ROW]
[ROW][C]14[/C][C]1[/C][C]0.632611[/C][C]0.367389[/C][/ROW]
[ROW][C]15[/C][C]0[/C][C]0.685241[/C][C]-0.685241[/C][/ROW]
[ROW][C]16[/C][C]0[/C][C]0.556676[/C][C]-0.556676[/C][/ROW]
[ROW][C]17[/C][C]0[/C][C]0.493735[/C][C]-0.493735[/C][/ROW]
[ROW][C]18[/C][C]1[/C][C]0.700189[/C][C]0.299811[/C][/ROW]
[ROW][C]19[/C][C]0[/C][C]0.626807[/C][C]-0.626807[/C][/ROW]
[ROW][C]20[/C][C]1[/C][C]0.666271[/C][C]0.333729[/C][/ROW]
[ROW][C]21[/C][C]0[/C][C]0.523039[/C][C]-0.523039[/C][/ROW]
[ROW][C]22[/C][C]1[/C][C]0.647192[/C][C]0.352808[/C][/ROW]
[ROW][C]23[/C][C]1[/C][C]0.96224[/C][C]0.0377599[/C][/ROW]
[ROW][C]24[/C][C]0[/C][C]0.5114[/C][C]-0.5114[/C][/ROW]
[ROW][C]25[/C][C]1[/C][C]0.570085[/C][C]0.429915[/C][/ROW]
[ROW][C]26[/C][C]1[/C][C]0.605414[/C][C]0.394586[/C][/ROW]
[ROW][C]27[/C][C]1[/C][C]0.590422[/C][C]0.409578[/C][/ROW]
[ROW][C]28[/C][C]1[/C][C]0.891713[/C][C]0.108287[/C][/ROW]
[ROW][C]29[/C][C]0[/C][C]0.430871[/C][C]-0.430871[/C][/ROW]
[ROW][C]30[/C][C]1[/C][C]0.48003[/C][C]0.51997[/C][/ROW]
[ROW][C]31[/C][C]0[/C][C]0.489285[/C][C]-0.489285[/C][/ROW]
[ROW][C]32[/C][C]0[/C][C]0.525229[/C][C]-0.525229[/C][/ROW]
[ROW][C]33[/C][C]0[/C][C]0.554798[/C][C]-0.554798[/C][/ROW]
[ROW][C]34[/C][C]1[/C][C]0.46052[/C][C]0.53948[/C][/ROW]
[ROW][C]35[/C][C]1[/C][C]0.560144[/C][C]0.439856[/C][/ROW]
[ROW][C]36[/C][C]1[/C][C]0.968878[/C][C]0.0311222[/C][/ROW]
[ROW][C]37[/C][C]1[/C][C]0.683521[/C][C]0.316479[/C][/ROW]
[ROW][C]38[/C][C]1[/C][C]0.724314[/C][C]0.275686[/C][/ROW]
[ROW][C]39[/C][C]0[/C][C]0.479031[/C][C]-0.479031[/C][/ROW]
[ROW][C]40[/C][C]1[/C][C]0.618924[/C][C]0.381076[/C][/ROW]
[ROW][C]41[/C][C]1[/C][C]0.825257[/C][C]0.174743[/C][/ROW]
[ROW][C]42[/C][C]0[/C][C]0.623567[/C][C]-0.623567[/C][/ROW]
[ROW][C]43[/C][C]1[/C][C]0.668696[/C][C]0.331304[/C][/ROW]
[ROW][C]44[/C][C]1[/C][C]0.665511[/C][C]0.334489[/C][/ROW]
[ROW][C]45[/C][C]1[/C][C]0.586362[/C][C]0.413638[/C][/ROW]
[ROW][C]46[/C][C]1[/C][C]0.424771[/C][C]0.575229[/C][/ROW]
[ROW][C]47[/C][C]1[/C][C]0.452223[/C][C]0.547777[/C][/ROW]
[ROW][C]48[/C][C]0[/C][C]0.758899[/C][C]-0.758899[/C][/ROW]
[ROW][C]49[/C][C]1[/C][C]0.482484[/C][C]0.517516[/C][/ROW]
[ROW][C]50[/C][C]1[/C][C]0.780282[/C][C]0.219718[/C][/ROW]
[ROW][C]51[/C][C]0[/C][C]0.336189[/C][C]-0.336189[/C][/ROW]
[ROW][C]52[/C][C]1[/C][C]0.576303[/C][C]0.423697[/C][/ROW]
[ROW][C]53[/C][C]1[/C][C]0.587317[/C][C]0.412683[/C][/ROW]
[ROW][C]54[/C][C]1[/C][C]0.593277[/C][C]0.406723[/C][/ROW]
[ROW][C]55[/C][C]1[/C][C]0.46778[/C][C]0.53222[/C][/ROW]
[ROW][C]56[/C][C]1[/C][C]0.436989[/C][C]0.563011[/C][/ROW]
[ROW][C]57[/C][C]1[/C][C]0.617012[/C][C]0.382988[/C][/ROW]
[ROW][C]58[/C][C]1[/C][C]0.519782[/C][C]0.480218[/C][/ROW]
[ROW][C]59[/C][C]0[/C][C]0.683062[/C][C]-0.683062[/C][/ROW]
[ROW][C]60[/C][C]1[/C][C]0.44083[/C][C]0.55917[/C][/ROW]
[ROW][C]61[/C][C]0[/C][C]0.504207[/C][C]-0.504207[/C][/ROW]
[ROW][C]62[/C][C]1[/C][C]0.429384[/C][C]0.570616[/C][/ROW]
[ROW][C]63[/C][C]1[/C][C]0.540747[/C][C]0.459253[/C][/ROW]
[ROW][C]64[/C][C]0[/C][C]0.641815[/C][C]-0.641815[/C][/ROW]
[ROW][C]65[/C][C]0[/C][C]0.561435[/C][C]-0.561435[/C][/ROW]
[ROW][C]66[/C][C]1[/C][C]0.522112[/C][C]0.477888[/C][/ROW]
[ROW][C]67[/C][C]0[/C][C]0.581455[/C][C]-0.581455[/C][/ROW]
[ROW][C]68[/C][C]1[/C][C]0.586487[/C][C]0.413513[/C][/ROW]
[ROW][C]69[/C][C]0[/C][C]0.824217[/C][C]-0.824217[/C][/ROW]
[ROW][C]70[/C][C]1[/C][C]0.466353[/C][C]0.533647[/C][/ROW]
[ROW][C]71[/C][C]1[/C][C]0.683439[/C][C]0.316561[/C][/ROW]
[ROW][C]72[/C][C]0[/C][C]0.489092[/C][C]-0.489092[/C][/ROW]
[ROW][C]73[/C][C]0[/C][C]0.7645[/C][C]-0.7645[/C][/ROW]
[ROW][C]74[/C][C]0[/C][C]0.490478[/C][C]-0.490478[/C][/ROW]
[ROW][C]75[/C][C]0[/C][C]0.477965[/C][C]-0.477965[/C][/ROW]
[ROW][C]76[/C][C]1[/C][C]0.66558[/C][C]0.33442[/C][/ROW]
[ROW][C]77[/C][C]1[/C][C]0.766966[/C][C]0.233034[/C][/ROW]
[ROW][C]78[/C][C]0[/C][C]0.489286[/C][C]-0.489286[/C][/ROW]
[ROW][C]79[/C][C]1[/C][C]1.58636[/C][C]-0.586362[/C][/ROW]
[ROW][C]80[/C][C]0[/C][C]-0.449845[/C][C]0.449845[/C][/ROW]
[ROW][C]81[/C][C]1[/C][C]1.47684[/C][C]-0.476842[/C][/ROW]
[ROW][C]82[/C][C]0[/C][C]0.658901[/C][C]-0.658901[/C][/ROW]
[ROW][C]83[/C][C]0[/C][C]-0.355192[/C][C]0.355192[/C][/ROW]
[ROW][C]84[/C][C]1[/C][C]1.53755[/C][C]-0.537548[/C][/ROW]
[ROW][C]85[/C][C]0[/C][C]0.455726[/C][C]-0.455726[/C][/ROW]
[ROW][C]86[/C][C]0[/C][C]0.493541[/C][C]-0.493541[/C][/ROW]
[ROW][C]87[/C][C]0[/C][C]-0.34376[/C][C]0.34376[/C][/ROW]
[ROW][C]88[/C][C]1[/C][C]1.61312[/C][C]-0.613119[/C][/ROW]
[ROW][C]89[/C][C]0[/C][C]-0.383183[/C][C]0.383183[/C][/ROW]
[ROW][C]90[/C][C]1[/C][C]0.599998[/C][C]0.400002[/C][/ROW]
[ROW][C]91[/C][C]1[/C][C]1.63831[/C][C]-0.638312[/C][/ROW]
[ROW][C]92[/C][C]0[/C][C]0.633751[/C][C]-0.633751[/C][/ROW]
[ROW][C]93[/C][C]0[/C][C]0.440829[/C][C]-0.440829[/C][/ROW]
[ROW][C]94[/C][C]0[/C][C]-0.58709[/C][C]0.58709[/C][/ROW]
[ROW][C]95[/C][C]1[/C][C]0.576841[/C][C]0.423159[/C][/ROW]
[ROW][C]96[/C][C]1[/C][C]0.378462[/C][C]0.621538[/C][/ROW]
[ROW][C]97[/C][C]1[/C][C]1.54324[/C][C]-0.543241[/C][/ROW]
[ROW][C]98[/C][C]0[/C][C]-0.435071[/C][C]0.435071[/C][/ROW]
[ROW][C]99[/C][C]1[/C][C]1.46533[/C][C]-0.465326[/C][/ROW]
[ROW][C]100[/C][C]0[/C][C]NA[/C][C]NA[/C][/ROW]
[/TABLE]
Source: https://freestatistics.org/blog/index.php?pk=271138&T=4

Globally Unique Identifier (entire table): ba.freestatistics.org/blog/index.php?pk=271138&T=4

As an alternative you can also use a QR Code:  

The GUIDs for individual cells are displayed in the table below:

Multiple Linear Regression - Actuals, Interpolation, and Residuals
Time or IndexActualsInterpolationForecastResidualsPrediction Error
100.393176-0.393176
200.512301-0.512301
310.5435470.456453
400.565052-0.565052
510.6671170.332883
610.6503070.349693
710.7169990.283001
800.475845-0.475845
910.5795610.420439
1010.8095570.190443
1110.6525660.347434
1210.5557540.444246
1310.6828690.317131
1410.6326110.367389
1500.685241-0.685241
1600.556676-0.556676
1700.493735-0.493735
1810.7001890.299811
1900.626807-0.626807
2010.6662710.333729
2100.523039-0.523039
2210.6471920.352808
2310.962240.0377599
2400.5114-0.5114
2510.5700850.429915
2610.6054140.394586
2710.5904220.409578
2810.8917130.108287
2900.430871-0.430871
3010.480030.51997
3100.489285-0.489285
3200.525229-0.525229
3300.554798-0.554798
3410.460520.53948
3510.5601440.439856
3610.9688780.0311222
3710.6835210.316479
3810.7243140.275686
3900.479031-0.479031
4010.6189240.381076
4110.8252570.174743
4200.623567-0.623567
4310.6686960.331304
4410.6655110.334489
4510.5863620.413638
4610.4247710.575229
4710.4522230.547777
4800.758899-0.758899
4910.4824840.517516
5010.7802820.219718
5100.336189-0.336189
5210.5763030.423697
5310.5873170.412683
5410.5932770.406723
5510.467780.53222
5610.4369890.563011
5710.6170120.382988
5810.5197820.480218
5900.683062-0.683062
6010.440830.55917
6100.504207-0.504207
6210.4293840.570616
6310.5407470.459253
6400.641815-0.641815
6500.561435-0.561435
6610.5221120.477888
6700.581455-0.581455
6810.5864870.413513
6900.824217-0.824217
7010.4663530.533647
7110.6834390.316561
7200.489092-0.489092
7300.7645-0.7645
7400.490478-0.490478
7500.477965-0.477965
7610.665580.33442
7710.7669660.233034
7800.489286-0.489286
7911.58636-0.586362
800-0.4498450.449845
8111.47684-0.476842
8200.658901-0.658901
830-0.3551920.355192
8411.53755-0.537548
8500.455726-0.455726
8600.493541-0.493541
870-0.343760.34376
8811.61312-0.613119
890-0.3831830.383183
9010.5999980.400002
9111.63831-0.638312
9200.633751-0.633751
9300.440829-0.440829
940-0.587090.58709
9510.5768410.423159
9610.3784620.621538
9711.54324-0.543241
980-0.4350710.435071
9911.46533-0.465326
1000NANA


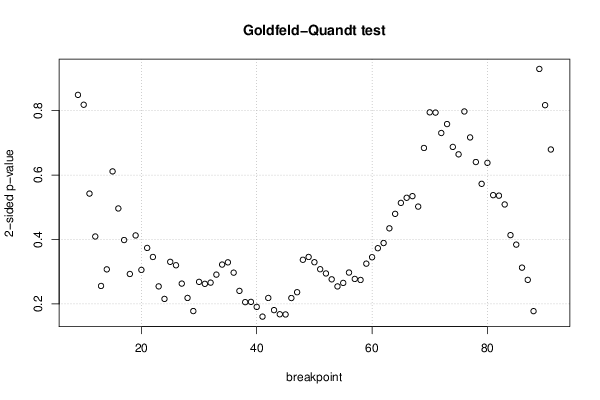
Goldfeld-Quandt test for Heteroskedasticity
p-valuesAlternative Hypothesis
breakpoint indexgreater2-sidedless
90.5757750.848450.424225
100.4089550.817910.591045
110.2711830.5423670.728817
120.2046790.4093570.795321
130.1279470.2558950.872053
140.1537010.3074020.846299
150.305630.6112590.69437
160.2481430.4962860.751857
170.1991680.3983370.800832
180.1465140.2930280.853486
190.2063110.4126220.793689
200.1528790.3057570.847121
210.1868980.3737960.813102
220.1728820.3457640.827118
230.1272930.2545860.872707
240.1078590.2157190.892141
250.1653490.3306990.834651
260.160090.320180.83991
270.1316270.2632540.868373
280.1093710.2187430.890629
290.08902060.1780410.910979
300.134290.2685790.86571
310.1312470.2624940.868753
320.1331020.2662040.866898
330.1455270.2910530.854473
340.1611370.3222750.838863
350.1645750.3291490.835425
360.1485870.2971730.851413
370.120310.2406190.87969
380.1028380.2056760.897162
390.1032390.2064780.896761
400.09550250.1910050.904497
410.0803630.1607260.919637
420.1093330.2186660.890667
430.09052210.1810440.909478
440.08407610.1681520.915924
450.08376410.1675280.916236
460.1092180.2184370.890782
470.1182690.2365380.881731
480.1685480.3370970.831452
490.1729330.3458670.827067
500.1647770.3295540.835223
510.1538980.3077960.846102
520.1473490.2946980.852651
530.1382580.2765150.861742
540.127240.2544810.87276
550.132670.2653390.86733
560.1487620.2975230.851238
570.1388370.2776730.861163
580.1372450.2744910.862755
590.1625170.3250340.837483
600.1725430.3450860.827457
610.1865180.3730360.813482
620.1945340.3890680.805466
630.2173350.4346690.782665
640.2397630.4795270.760237
650.2567610.5135210.743239
660.2647080.5294170.735292
670.2672270.5344530.732773
680.2510370.5020740.748963
690.3419210.6838420.658079
700.3972190.7944380.602781
710.3967690.7935380.603231
720.3651260.7302530.634874
730.379050.7580990.62095
740.3435440.6870880.656456
750.3320740.6641490.667926
760.3985480.7970950.601452
770.3583030.7166060.641697
780.3201460.6402930.679854
790.2863090.5726170.713691
800.3188760.6377510.681124
810.2687370.5374730.731263
820.2679690.5359370.732031
830.2543430.5086850.745657
840.2067850.4135690.793215
850.1920420.3840840.807958
860.1563570.3127150.843643
870.1373840.2747670.862616
880.08891760.1778350.911082
890.4644740.9289480.535526
900.4083180.8166350.591682
910.3395620.6791250.660438

\begin{tabular}{lllllllll}
\hline
Goldfeld-Quandt test for Heteroskedasticity \tabularnewline
p-values & Alternative Hypothesis \tabularnewline
breakpoint index & greater & 2-sided & less \tabularnewline
9 & 0.575775 & 0.84845 & 0.424225 \tabularnewline
10 & 0.408955 & 0.81791 & 0.591045 \tabularnewline
11 & 0.271183 & 0.542367 & 0.728817 \tabularnewline
12 & 0.204679 & 0.409357 & 0.795321 \tabularnewline
13 & 0.127947 & 0.255895 & 0.872053 \tabularnewline
14 & 0.153701 & 0.307402 & 0.846299 \tabularnewline
15 & 0.30563 & 0.611259 & 0.69437 \tabularnewline
16 & 0.248143 & 0.496286 & 0.751857 \tabularnewline
17 & 0.199168 & 0.398337 & 0.800832 \tabularnewline
18 & 0.146514 & 0.293028 & 0.853486 \tabularnewline
19 & 0.206311 & 0.412622 & 0.793689 \tabularnewline
20 & 0.152879 & 0.305757 & 0.847121 \tabularnewline
21 & 0.186898 & 0.373796 & 0.813102 \tabularnewline
22 & 0.172882 & 0.345764 & 0.827118 \tabularnewline
23 & 0.127293 & 0.254586 & 0.872707 \tabularnewline
24 & 0.107859 & 0.215719 & 0.892141 \tabularnewline
25 & 0.165349 & 0.330699 & 0.834651 \tabularnewline
26 & 0.16009 & 0.32018 & 0.83991 \tabularnewline
27 & 0.131627 & 0.263254 & 0.868373 \tabularnewline
28 & 0.109371 & 0.218743 & 0.890629 \tabularnewline
29 & 0.0890206 & 0.178041 & 0.910979 \tabularnewline
30 & 0.13429 & 0.268579 & 0.86571 \tabularnewline
31 & 0.131247 & 0.262494 & 0.868753 \tabularnewline
32 & 0.133102 & 0.266204 & 0.866898 \tabularnewline
33 & 0.145527 & 0.291053 & 0.854473 \tabularnewline
34 & 0.161137 & 0.322275 & 0.838863 \tabularnewline
35 & 0.164575 & 0.329149 & 0.835425 \tabularnewline
36 & 0.148587 & 0.297173 & 0.851413 \tabularnewline
37 & 0.12031 & 0.240619 & 0.87969 \tabularnewline
38 & 0.102838 & 0.205676 & 0.897162 \tabularnewline
39 & 0.103239 & 0.206478 & 0.896761 \tabularnewline
40 & 0.0955025 & 0.191005 & 0.904497 \tabularnewline
41 & 0.080363 & 0.160726 & 0.919637 \tabularnewline
42 & 0.109333 & 0.218666 & 0.890667 \tabularnewline
43 & 0.0905221 & 0.181044 & 0.909478 \tabularnewline
44 & 0.0840761 & 0.168152 & 0.915924 \tabularnewline
45 & 0.0837641 & 0.167528 & 0.916236 \tabularnewline
46 & 0.109218 & 0.218437 & 0.890782 \tabularnewline
47 & 0.118269 & 0.236538 & 0.881731 \tabularnewline
48 & 0.168548 & 0.337097 & 0.831452 \tabularnewline
49 & 0.172933 & 0.345867 & 0.827067 \tabularnewline
50 & 0.164777 & 0.329554 & 0.835223 \tabularnewline
51 & 0.153898 & 0.307796 & 0.846102 \tabularnewline
52 & 0.147349 & 0.294698 & 0.852651 \tabularnewline
53 & 0.138258 & 0.276515 & 0.861742 \tabularnewline
54 & 0.12724 & 0.254481 & 0.87276 \tabularnewline
55 & 0.13267 & 0.265339 & 0.86733 \tabularnewline
56 & 0.148762 & 0.297523 & 0.851238 \tabularnewline
57 & 0.138837 & 0.277673 & 0.861163 \tabularnewline
58 & 0.137245 & 0.274491 & 0.862755 \tabularnewline
59 & 0.162517 & 0.325034 & 0.837483 \tabularnewline
60 & 0.172543 & 0.345086 & 0.827457 \tabularnewline
61 & 0.186518 & 0.373036 & 0.813482 \tabularnewline
62 & 0.194534 & 0.389068 & 0.805466 \tabularnewline
63 & 0.217335 & 0.434669 & 0.782665 \tabularnewline
64 & 0.239763 & 0.479527 & 0.760237 \tabularnewline
65 & 0.256761 & 0.513521 & 0.743239 \tabularnewline
66 & 0.264708 & 0.529417 & 0.735292 \tabularnewline
67 & 0.267227 & 0.534453 & 0.732773 \tabularnewline
68 & 0.251037 & 0.502074 & 0.748963 \tabularnewline
69 & 0.341921 & 0.683842 & 0.658079 \tabularnewline
70 & 0.397219 & 0.794438 & 0.602781 \tabularnewline
71 & 0.396769 & 0.793538 & 0.603231 \tabularnewline
72 & 0.365126 & 0.730253 & 0.634874 \tabularnewline
73 & 0.37905 & 0.758099 & 0.62095 \tabularnewline
74 & 0.343544 & 0.687088 & 0.656456 \tabularnewline
75 & 0.332074 & 0.664149 & 0.667926 \tabularnewline
76 & 0.398548 & 0.797095 & 0.601452 \tabularnewline
77 & 0.358303 & 0.716606 & 0.641697 \tabularnewline
78 & 0.320146 & 0.640293 & 0.679854 \tabularnewline
79 & 0.286309 & 0.572617 & 0.713691 \tabularnewline
80 & 0.318876 & 0.637751 & 0.681124 \tabularnewline
81 & 0.268737 & 0.537473 & 0.731263 \tabularnewline
82 & 0.267969 & 0.535937 & 0.732031 \tabularnewline
83 & 0.254343 & 0.508685 & 0.745657 \tabularnewline
84 & 0.206785 & 0.413569 & 0.793215 \tabularnewline
85 & 0.192042 & 0.384084 & 0.807958 \tabularnewline
86 & 0.156357 & 0.312715 & 0.843643 \tabularnewline
87 & 0.137384 & 0.274767 & 0.862616 \tabularnewline
88 & 0.0889176 & 0.177835 & 0.911082 \tabularnewline
89 & 0.464474 & 0.928948 & 0.535526 \tabularnewline
90 & 0.408318 & 0.816635 & 0.591682 \tabularnewline
91 & 0.339562 & 0.679125 & 0.660438 \tabularnewline
\hline
\end{tabular}
%Source: https://freestatistics.org/blog/index.php?pk=271138&T=5

[TABLE]
[ROW][C]Goldfeld-Quandt test for Heteroskedasticity[/C][/ROW]
[ROW][C]p-values[/C][C]Alternative Hypothesis[/C][/ROW]
[ROW][C]breakpoint index[/C][C]greater[/C][C]2-sided[/C][C]less[/C][/ROW]
[ROW][C]9[/C][C]0.575775[/C][C]0.84845[/C][C]0.424225[/C][/ROW]
[ROW][C]10[/C][C]0.408955[/C][C]0.81791[/C][C]0.591045[/C][/ROW]
[ROW][C]11[/C][C]0.271183[/C][C]0.542367[/C][C]0.728817[/C][/ROW]
[ROW][C]12[/C][C]0.204679[/C][C]0.409357[/C][C]0.795321[/C][/ROW]
[ROW][C]13[/C][C]0.127947[/C][C]0.255895[/C][C]0.872053[/C][/ROW]
[ROW][C]14[/C][C]0.153701[/C][C]0.307402[/C][C]0.846299[/C][/ROW]
[ROW][C]15[/C][C]0.30563[/C][C]0.611259[/C][C]0.69437[/C][/ROW]
[ROW][C]16[/C][C]0.248143[/C][C]0.496286[/C][C]0.751857[/C][/ROW]
[ROW][C]17[/C][C]0.199168[/C][C]0.398337[/C][C]0.800832[/C][/ROW]
[ROW][C]18[/C][C]0.146514[/C][C]0.293028[/C][C]0.853486[/C][/ROW]
[ROW][C]19[/C][C]0.206311[/C][C]0.412622[/C][C]0.793689[/C][/ROW]
[ROW][C]20[/C][C]0.152879[/C][C]0.305757[/C][C]0.847121[/C][/ROW]
[ROW][C]21[/C][C]0.186898[/C][C]0.373796[/C][C]0.813102[/C][/ROW]
[ROW][C]22[/C][C]0.172882[/C][C]0.345764[/C][C]0.827118[/C][/ROW]
[ROW][C]23[/C][C]0.127293[/C][C]0.254586[/C][C]0.872707[/C][/ROW]
[ROW][C]24[/C][C]0.107859[/C][C]0.215719[/C][C]0.892141[/C][/ROW]
[ROW][C]25[/C][C]0.165349[/C][C]0.330699[/C][C]0.834651[/C][/ROW]
[ROW][C]26[/C][C]0.16009[/C][C]0.32018[/C][C]0.83991[/C][/ROW]
[ROW][C]27[/C][C]0.131627[/C][C]0.263254[/C][C]0.868373[/C][/ROW]
[ROW][C]28[/C][C]0.109371[/C][C]0.218743[/C][C]0.890629[/C][/ROW]
[ROW][C]29[/C][C]0.0890206[/C][C]0.178041[/C][C]0.910979[/C][/ROW]
[ROW][C]30[/C][C]0.13429[/C][C]0.268579[/C][C]0.86571[/C][/ROW]
[ROW][C]31[/C][C]0.131247[/C][C]0.262494[/C][C]0.868753[/C][/ROW]
[ROW][C]32[/C][C]0.133102[/C][C]0.266204[/C][C]0.866898[/C][/ROW]
[ROW][C]33[/C][C]0.145527[/C][C]0.291053[/C][C]0.854473[/C][/ROW]
[ROW][C]34[/C][C]0.161137[/C][C]0.322275[/C][C]0.838863[/C][/ROW]
[ROW][C]35[/C][C]0.164575[/C][C]0.329149[/C][C]0.835425[/C][/ROW]
[ROW][C]36[/C][C]0.148587[/C][C]0.297173[/C][C]0.851413[/C][/ROW]
[ROW][C]37[/C][C]0.12031[/C][C]0.240619[/C][C]0.87969[/C][/ROW]
[ROW][C]38[/C][C]0.102838[/C][C]0.205676[/C][C]0.897162[/C][/ROW]
[ROW][C]39[/C][C]0.103239[/C][C]0.206478[/C][C]0.896761[/C][/ROW]
[ROW][C]40[/C][C]0.0955025[/C][C]0.191005[/C][C]0.904497[/C][/ROW]
[ROW][C]41[/C][C]0.080363[/C][C]0.160726[/C][C]0.919637[/C][/ROW]
[ROW][C]42[/C][C]0.109333[/C][C]0.218666[/C][C]0.890667[/C][/ROW]
[ROW][C]43[/C][C]0.0905221[/C][C]0.181044[/C][C]0.909478[/C][/ROW]
[ROW][C]44[/C][C]0.0840761[/C][C]0.168152[/C][C]0.915924[/C][/ROW]
[ROW][C]45[/C][C]0.0837641[/C][C]0.167528[/C][C]0.916236[/C][/ROW]
[ROW][C]46[/C][C]0.109218[/C][C]0.218437[/C][C]0.890782[/C][/ROW]
[ROW][C]47[/C][C]0.118269[/C][C]0.236538[/C][C]0.881731[/C][/ROW]
[ROW][C]48[/C][C]0.168548[/C][C]0.337097[/C][C]0.831452[/C][/ROW]
[ROW][C]49[/C][C]0.172933[/C][C]0.345867[/C][C]0.827067[/C][/ROW]
[ROW][C]50[/C][C]0.164777[/C][C]0.329554[/C][C]0.835223[/C][/ROW]
[ROW][C]51[/C][C]0.153898[/C][C]0.307796[/C][C]0.846102[/C][/ROW]
[ROW][C]52[/C][C]0.147349[/C][C]0.294698[/C][C]0.852651[/C][/ROW]
[ROW][C]53[/C][C]0.138258[/C][C]0.276515[/C][C]0.861742[/C][/ROW]
[ROW][C]54[/C][C]0.12724[/C][C]0.254481[/C][C]0.87276[/C][/ROW]
[ROW][C]55[/C][C]0.13267[/C][C]0.265339[/C][C]0.86733[/C][/ROW]
[ROW][C]56[/C][C]0.148762[/C][C]0.297523[/C][C]0.851238[/C][/ROW]
[ROW][C]57[/C][C]0.138837[/C][C]0.277673[/C][C]0.861163[/C][/ROW]
[ROW][C]58[/C][C]0.137245[/C][C]0.274491[/C][C]0.862755[/C][/ROW]
[ROW][C]59[/C][C]0.162517[/C][C]0.325034[/C][C]0.837483[/C][/ROW]
[ROW][C]60[/C][C]0.172543[/C][C]0.345086[/C][C]0.827457[/C][/ROW]
[ROW][C]61[/C][C]0.186518[/C][C]0.373036[/C][C]0.813482[/C][/ROW]
[ROW][C]62[/C][C]0.194534[/C][C]0.389068[/C][C]0.805466[/C][/ROW]
[ROW][C]63[/C][C]0.217335[/C][C]0.434669[/C][C]0.782665[/C][/ROW]
[ROW][C]64[/C][C]0.239763[/C][C]0.479527[/C][C]0.760237[/C][/ROW]
[ROW][C]65[/C][C]0.256761[/C][C]0.513521[/C][C]0.743239[/C][/ROW]
[ROW][C]66[/C][C]0.264708[/C][C]0.529417[/C][C]0.735292[/C][/ROW]
[ROW][C]67[/C][C]0.267227[/C][C]0.534453[/C][C]0.732773[/C][/ROW]
[ROW][C]68[/C][C]0.251037[/C][C]0.502074[/C][C]0.748963[/C][/ROW]
[ROW][C]69[/C][C]0.341921[/C][C]0.683842[/C][C]0.658079[/C][/ROW]
[ROW][C]70[/C][C]0.397219[/C][C]0.794438[/C][C]0.602781[/C][/ROW]
[ROW][C]71[/C][C]0.396769[/C][C]0.793538[/C][C]0.603231[/C][/ROW]
[ROW][C]72[/C][C]0.365126[/C][C]0.730253[/C][C]0.634874[/C][/ROW]
[ROW][C]73[/C][C]0.37905[/C][C]0.758099[/C][C]0.62095[/C][/ROW]
[ROW][C]74[/C][C]0.343544[/C][C]0.687088[/C][C]0.656456[/C][/ROW]
[ROW][C]75[/C][C]0.332074[/C][C]0.664149[/C][C]0.667926[/C][/ROW]
[ROW][C]76[/C][C]0.398548[/C][C]0.797095[/C][C]0.601452[/C][/ROW]
[ROW][C]77[/C][C]0.358303[/C][C]0.716606[/C][C]0.641697[/C][/ROW]
[ROW][C]78[/C][C]0.320146[/C][C]0.640293[/C][C]0.679854[/C][/ROW]
[ROW][C]79[/C][C]0.286309[/C][C]0.572617[/C][C]0.713691[/C][/ROW]
[ROW][C]80[/C][C]0.318876[/C][C]0.637751[/C][C]0.681124[/C][/ROW]
[ROW][C]81[/C][C]0.268737[/C][C]0.537473[/C][C]0.731263[/C][/ROW]
[ROW][C]82[/C][C]0.267969[/C][C]0.535937[/C][C]0.732031[/C][/ROW]
[ROW][C]83[/C][C]0.254343[/C][C]0.508685[/C][C]0.745657[/C][/ROW]
[ROW][C]84[/C][C]0.206785[/C][C]0.413569[/C][C]0.793215[/C][/ROW]
[ROW][C]85[/C][C]0.192042[/C][C]0.384084[/C][C]0.807958[/C][/ROW]
[ROW][C]86[/C][C]0.156357[/C][C]0.312715[/C][C]0.843643[/C][/ROW]
[ROW][C]87[/C][C]0.137384[/C][C]0.274767[/C][C]0.862616[/C][/ROW]
[ROW][C]88[/C][C]0.0889176[/C][C]0.177835[/C][C]0.911082[/C][/ROW]
[ROW][C]89[/C][C]0.464474[/C][C]0.928948[/C][C]0.535526[/C][/ROW]
[ROW][C]90[/C][C]0.408318[/C][C]0.816635[/C][C]0.591682[/C][/ROW]
[ROW][C]91[/C][C]0.339562[/C][C]0.679125[/C][C]0.660438[/C][/ROW]
[/TABLE]
Source: https://freestatistics.org/blog/index.php?pk=271138&T=5

Globally Unique Identifier (entire table): ba.freestatistics.org/blog/index.php?pk=271138&T=5

As an alternative you can also use a QR Code:  

The GUIDs for individual cells are displayed in the table below:

Goldfeld-Quandt test for Heteroskedasticity
p-valuesAlternative Hypothesis
breakpoint indexgreater2-sidedless
90.5757750.848450.424225
100.4089550.817910.591045
110.2711830.5423670.728817
120.2046790.4093570.795321
130.1279470.2558950.872053
140.1537010.3074020.846299
150.305630.6112590.69437
160.2481430.4962860.751857
170.1991680.3983370.800832
180.1465140.2930280.853486
190.2063110.4126220.793689
200.1528790.3057570.847121
210.1868980.3737960.813102
220.1728820.3457640.827118
230.1272930.2545860.872707
240.1078590.2157190.892141
250.1653490.3306990.834651
260.160090.320180.83991
270.1316270.2632540.868373
280.1093710.2187430.890629
290.08902060.1780410.910979
300.134290.2685790.86571
310.1312470.2624940.868753
320.1331020.2662040.866898
330.1455270.2910530.854473
340.1611370.3222750.838863
350.1645750.3291490.835425
360.1485870.2971730.851413
370.120310.2406190.87969
380.1028380.2056760.897162
390.1032390.2064780.896761
400.09550250.1910050.904497
410.0803630.1607260.919637
420.1093330.2186660.890667
430.09052210.1810440.909478
440.08407610.1681520.915924
450.08376410.1675280.916236
460.1092180.2184370.890782
470.1182690.2365380.881731
480.1685480.3370970.831452
490.1729330.3458670.827067
500.1647770.3295540.835223
510.1538980.3077960.846102
520.1473490.2946980.852651
530.1382580.2765150.861742
540.127240.2544810.87276
550.132670.2653390.86733
560.1487620.2975230.851238
570.1388370.2776730.861163
580.1372450.2744910.862755
590.1625170.3250340.837483
600.1725430.3450860.827457
610.1865180.3730360.813482
620.1945340.3890680.805466
630.2173350.4346690.782665
640.2397630.4795270.760237
650.2567610.5135210.743239
660.2647080.5294170.735292
670.2672270.5344530.732773
680.2510370.5020740.748963
690.3419210.6838420.658079
700.3972190.7944380.602781
710.3967690.7935380.603231
720.3651260.7302530.634874
730.379050.7580990.62095
740.3435440.6870880.656456
750.3320740.6641490.667926
760.3985480.7970950.601452
770.3583030.7166060.641697
780.3201460.6402930.679854
790.2863090.5726170.713691
800.3188760.6377510.681124
810.2687370.5374730.731263
820.2679690.5359370.732031
830.2543430.5086850.745657
840.2067850.4135690.793215
850.1920420.3840840.807958
860.1563570.3127150.843643
870.1373840.2747670.862616
880.08891760.1778350.911082
890.4644740.9289480.535526
900.4083180.8166350.591682
910.3395620.6791250.660438


Meta Analysis of Goldfeld-Quandt test for Heteroskedasticity
Description# significant tests% significant testsOK/NOK
1% type I error level00OK
5% type I error level00OK
10% type I error level00OK

\begin{tabular}{lllllllll}
\hline
Meta Analysis of Goldfeld-Quandt test for Heteroskedasticity \tabularnewline
Description & # significant tests & % significant tests & OK/NOK \tabularnewline
1% type I error level & 0 & 0 & OK \tabularnewline
5% type I error level & 0 & 0 & OK \tabularnewline
10% type I error level & 0 & 0 & OK \tabularnewline
\hline
\end{tabular}
%Source: https://freestatistics.org/blog/index.php?pk=271138&T=6

[TABLE]
[ROW][C]Meta Analysis of Goldfeld-Quandt test for Heteroskedasticity[/C][/ROW]
[ROW][C]Description[/C][C]# significant tests[/C][C]% significant tests[/C][C]OK/NOK[/C][/ROW]
[ROW][C]1% type I error level[/C][C]0[/C][C]0[/C][C]OK[/C][/ROW]
[ROW][C]5% type I error level[/C][C]0[/C][C]0[/C][C]OK[/C][/ROW]
[ROW][C]10% type I error level[/C][C]0[/C][C]0[/C][C]OK[/C][/ROW]
[/TABLE]
Source: https://freestatistics.org/blog/index.php?pk=271138&T=6

Globally Unique Identifier (entire table): ba.freestatistics.org/blog/index.php?pk=271138&T=6

As an alternative you can also use a QR Code:  

The GUIDs for individual cells are displayed in the table below:

Meta Analysis of Goldfeld-Quandt test for Heteroskedasticity
Description# significant tests% significant testsOK/NOK
1% type I error level00OK
5% type I error level00OK
10% type I error level00OK


Parameters (Session):
Parameters (R input):
par1 = 1 ; par2 = Do not include Seasonal Dummies ; par3 = No Linear Trend ;
R code (references can be found in the software module):
library(lattice)
library(lmtest)
n25 <- 25 #minimum number of obs. for Goldfeld-Quandt test
par1 <- as.numeric(par1)
x <- t(y)
k <- length(x[1,])
n <- length(x[,1])
x1 <- cbind(x[,par1], x[,1:k!=par1])
mycolnames <- c(colnames(x)[par1], colnames(x)[1:k!=par1])
colnames(x1) <- mycolnames #colnames(x)[par1]
x <- x1
if (par3 == 'First Differences'){
x2 <- array(0, dim=c(n-1,k), dimnames=list(1:(n-1), paste('(1-B)',colnames(x),sep='')))
for (i in 1:n-1) {
for (j in 1:k) {
x2[i,j] <- x[i+1,j] - x[i,j]
}
}
x <- x2
}
if (par2 == 'Include Monthly Dummies'){
x2 <- array(0, dim=c(n,11), dimnames=list(1:n, paste('M', seq(1:11), sep ='')))
for (i in 1:11){
x2[seq(i,n,12),i] <- 1
}
x <- cbind(x, x2)
}
if (par2 == 'Include Quarterly Dummies'){
x2 <- array(0, dim=c(n,3), dimnames=list(1:n, paste('Q', seq(1:3), sep ='')))
for (i in 1:3){
x2[seq(i,n,4),i] <- 1
}
x <- cbind(x, x2)
}
k <- length(x[1,])
if (par3 == 'Linear Trend'){
x <- cbind(x, c(1:n))
colnames(x)[k+1] <- 't'
}
x
k <- length(x[1,])
df <- as.data.frame(x)
(mylm <- lm(df))
(mysum <- summary(mylm))
if (n > n25) {
kp3 <- k + 3
nmkm3 <- n - k - 3
gqarr <- array(NA, dim=c(nmkm3-kp3+1,3))
numgqtests <- 0
numsignificant1 <- 0
numsignificant5 <- 0
numsignificant10 <- 0
for (mypoint in kp3:nmkm3) {
j <- 0
numgqtests <- numgqtests + 1
for (myalt in c('greater', 'two.sided', 'less')) {
j <- j + 1
gqarr[mypoint-kp3+1,j] <- gqtest(mylm, point=mypoint, alternative=myalt)$p.value
}
if (gqarr[mypoint-kp3+1,2] < 0.01) numsignificant1 <- numsignificant1 + 1
if (gqarr[mypoint-kp3+1,2] < 0.05) numsignificant5 <- numsignificant5 + 1
if (gqarr[mypoint-kp3+1,2] < 0.10) numsignificant10 <- numsignificant10 + 1
}
gqarr
}
bitmap(file='test0.png')
plot(x[,1], type='l', main='Actuals and Interpolation', ylab='value of Actuals and Interpolation (dots)', xlab='time or index')
points(x[,1]-mysum$resid)
grid()
dev.off()
bitmap(file='test1.png')
plot(mysum$resid, type='b', pch=19, main='Residuals', ylab='value of Residuals', xlab='time or index')
grid()
dev.off()
bitmap(file='test2.png')
hist(mysum$resid, main='Residual Histogram', xlab='values of Residuals')
grid()
dev.off()
bitmap(file='test3.png')
densityplot(~mysum$resid,col='black',main='Residual Density Plot', xlab='values of Residuals')
dev.off()
bitmap(file='test4.png')
qqnorm(mysum$resid, main='Residual Normal Q-Q Plot')
qqline(mysum$resid)
grid()
dev.off()
(myerror <- as.ts(mysum$resid))
bitmap(file='test5.png')
dum <- cbind(lag(myerror,k=1),myerror)
dum
dum1 <- dum[2:length(myerror),]
dum1
z <- as.data.frame(dum1)
z
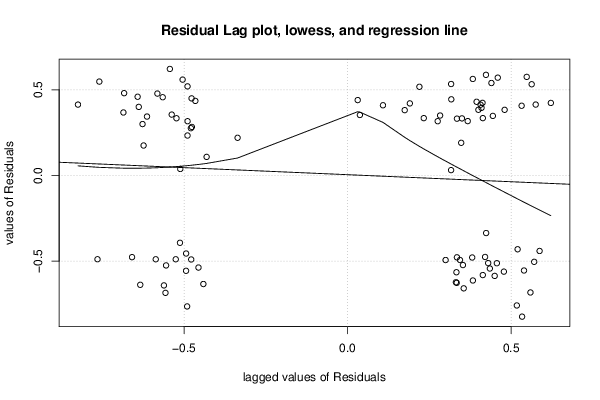
plot(z,main=paste('Residual Lag plot, lowess, and regression line'), ylab='values of Residuals', xlab='lagged values of Residuals')
lines(lowess(z))
abline(lm(z))
grid()
dev.off()
bitmap(file='test6.png')
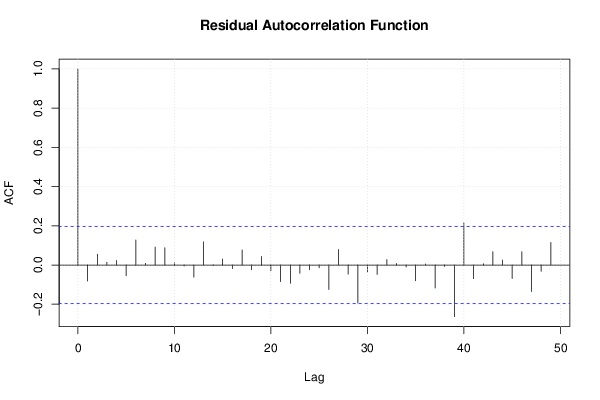
acf(mysum$resid, lag.max=length(mysum$resid)/2, main='Residual Autocorrelation Function')
grid()
dev.off()
bitmap(file='test7.png')
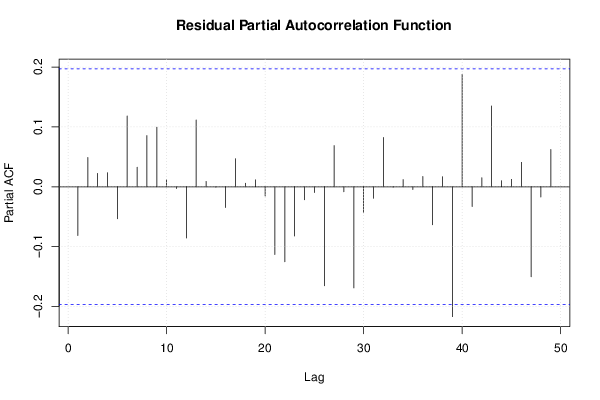
pacf(mysum$resid, lag.max=length(mysum$resid)/2, main='Residual Partial Autocorrelation Function')
grid()
dev.off()
bitmap(file='test8.png')
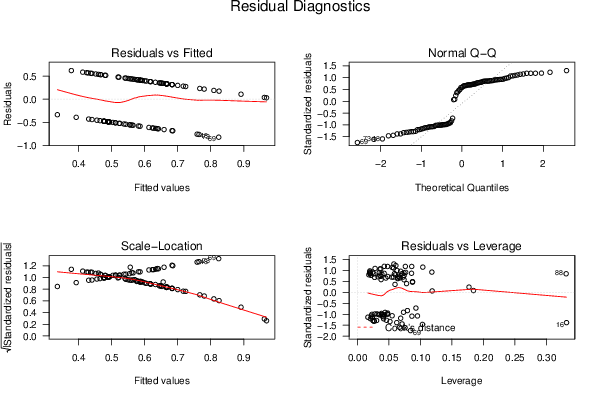
opar <- par(mfrow = c(2,2), oma = c(0, 0, 1.1, 0))
plot(mylm, las = 1, sub='Residual Diagnostics')
par(opar)
dev.off()
if (n > n25) {
bitmap(file='test9.png')
plot(kp3:nmkm3,gqarr[,2], main='Goldfeld-Quandt test',ylab='2-sided p-value',xlab='breakpoint')
grid()
dev.off()
}
load(file='createtable')
a<-table.start()
a<-table.row.start(a)
a<-table.element(a, 'Multiple Linear Regression - Estimated Regression Equation', 1, TRUE)
a<-table.row.end(a)
myeq <- colnames(x)[1]
myeq <- paste(myeq, '[t] = ', sep='')
for (i in 1:k){
if (mysum$coefficients[i,1] > 0) myeq <- paste(myeq, '+', '')
myeq <- paste(myeq, signif(mysum$coefficients[i,1],6), sep=' ')
if (rownames(mysum$coefficients)[i] != '(Intercept)') {
myeq <- paste(myeq, rownames(mysum$coefficients)[i], sep='')
if (rownames(mysum$coefficients)[i] != 't') myeq <- paste(myeq, '[t]', sep='')
}
}
myeq <- paste(myeq, ' + e[t]')
a<-table.row.start(a)
a<-table.element(a, myeq)
a<-table.row.end(a)
a<-table.end(a)
table.save(a,file='mytable1.tab')
a<-table.start()
a<-table.row.start(a)
a<-table.element(a,hyperlink('ols1.htm','Multiple Linear Regression - Ordinary Least Squares',''), 6, TRUE)
a<-table.row.end(a)
a<-table.row.start(a)
a<-table.element(a,'Variable',header=TRUE)
a<-table.element(a,'Parameter',header=TRUE)
a<-table.element(a,'S.D.',header=TRUE)
a<-table.element(a,'T-STAT
H0: parameter = 0',header=TRUE)
a<-table.element(a,'2-tail p-value',header=TRUE)
a<-table.element(a,'1-tail p-value',header=TRUE)
a<-table.row.end(a)
for (i in 1:k){
a<-table.row.start(a)
a<-table.element(a,rownames(mysum$coefficients)[i],header=TRUE)
a<-table.element(a,signif(mysum$coefficients[i,1],6))
a<-table.element(a, signif(mysum$coefficients[i,2],6))
a<-table.element(a, signif(mysum$coefficients[i,3],4))
a<-table.element(a, signif(mysum$coefficients[i,4],6))
a<-table.element(a, signif(mysum$coefficients[i,4]/2,6))
a<-table.row.end(a)
}
a<-table.end(a)
table.save(a,file='mytable2.tab')
a<-table.start()
a<-table.row.start(a)
a<-table.element(a, 'Multiple Linear Regression - Regression Statistics', 2, TRUE)
a<-table.row.end(a)
a<-table.row.start(a)
a<-table.element(a, 'Multiple R',1,TRUE)
a<-table.element(a, signif(sqrt(mysum$r.squared),6))
a<-table.row.end(a)
a<-table.row.start(a)
a<-table.element(a, 'R-squared',1,TRUE)
a<-table.element(a, signif(mysum$r.squared,6))
a<-table.row.end(a)
a<-table.row.start(a)
a<-table.element(a, 'Adjusted R-squared',1,TRUE)
a<-table.element(a, signif(mysum$adj.r.squared,6))
a<-table.row.end(a)
a<-table.row.start(a)
a<-table.element(a, 'F-TEST (value)',1,TRUE)
a<-table.element(a, signif(mysum$fstatistic[1],6))
a<-table.row.end(a)
a<-table.row.start(a)
a<-table.element(a, 'F-TEST (DF numerator)',1,TRUE)
a<-table.element(a, signif(mysum$fstatistic[2],6))
a<-table.row.end(a)
a<-table.row.start(a)
a<-table.element(a, 'F-TEST (DF denominator)',1,TRUE)
a<-table.element(a, signif(mysum$fstatistic[3],6))
a<-table.row.end(a)
a<-table.row.start(a)
a<-table.element(a, 'p-value',1,TRUE)
a<-table.element(a, signif(1-pf(mysum$fstatistic[1],mysum$fstatistic[2],mysum$fstatistic[3]),6))
a<-table.row.end(a)
a<-table.row.start(a)
a<-table.element(a, 'Multiple Linear Regression - Residual Statistics', 2, TRUE)
a<-table.row.end(a)
a<-table.row.start(a)
a<-table.element(a, 'Residual Standard Deviation',1,TRUE)
a<-table.element(a, signif(mysum$sigma,6))
a<-table.row.end(a)
a<-table.row.start(a)
a<-table.element(a, 'Sum Squared Residuals',1,TRUE)
a<-table.element(a, signif(sum(myerror*myerror),6))
a<-table.row.end(a)
a<-table.end(a)
table.save(a,file='mytable3.tab')
a<-table.start()
a<-table.row.start(a)
a<-table.element(a, 'Multiple Linear Regression - Actuals, Interpolation, and Residuals', 4, TRUE)
a<-table.row.end(a)
a<-table.row.start(a)
a<-table.element(a, 'Time or Index', 1, TRUE)
a<-table.element(a, 'Actuals', 1, TRUE)
a<-table.element(a, 'Interpolation
Forecast', 1, TRUE)
a<-table.element(a, 'Residuals
Prediction Error', 1, TRUE)
a<-table.row.end(a)
for (i in 1:n) {
a<-table.row.start(a)
a<-table.element(a,i, 1, TRUE)
a<-table.element(a,signif(x[i],6))
a<-table.element(a,signif(x[i]-mysum$resid[i],6))
a<-table.element(a,signif(mysum$resid[i],6))
a<-table.row.end(a)
}
a<-table.end(a)
table.save(a,file='mytable4.tab')
if (n > n25) {
a<-table.start()
a<-table.row.start(a)
a<-table.element(a,'Goldfeld-Quandt test for Heteroskedasticity',4,TRUE)
a<-table.row.end(a)
a<-table.row.start(a)
a<-table.element(a,'p-values',header=TRUE)
a<-table.element(a,'Alternative Hypothesis',3,header=TRUE)
a<-table.row.end(a)
a<-table.row.start(a)
a<-table.element(a,'breakpoint index',header=TRUE)
a<-table.element(a,'greater',header=TRUE)
a<-table.element(a,'2-sided',header=TRUE)
a<-table.element(a,'less',header=TRUE)
a<-table.row.end(a)
for (mypoint in kp3:nmkm3) {
a<-table.row.start(a)
a<-table.element(a,mypoint,header=TRUE)
a<-table.element(a,signif(gqarr[mypoint-kp3+1,1],6))
a<-table.element(a,signif(gqarr[mypoint-kp3+1,2],6))
a<-table.element(a,signif(gqarr[mypoint-kp3+1,3],6))
a<-table.row.end(a)
}
a<-table.end(a)
table.save(a,file='mytable5.tab')
a<-table.start()
a<-table.row.start(a)
a<-table.element(a,'Meta Analysis of Goldfeld-Quandt test for Heteroskedasticity',4,TRUE)
a<-table.row.end(a)
a<-table.row.start(a)
a<-table.element(a,'Description',header=TRUE)
a<-table.element(a,'# significant tests',header=TRUE)
a<-table.element(a,'% significant tests',header=TRUE)
a<-table.element(a,'OK/NOK',header=TRUE)
a<-table.row.end(a)
a<-table.row.start(a)
a<-table.element(a,'1% type I error level',header=TRUE)
a<-table.element(a,signif(numsignificant1,6))
a<-table.element(a,signif(numsignificant1/numgqtests,6))
if (numsignificant1/numgqtests < 0.01) dum <- 'OK' else dum <- 'NOK'
a<-table.element(a,dum)
a<-table.row.end(a)
a<-table.row.start(a)
a<-table.element(a,'5% type I error level',header=TRUE)
a<-table.element(a,signif(numsignificant5,6))
a<-table.element(a,signif(numsignificant5/numgqtests,6))
if (numsignificant5/numgqtests < 0.05) dum <- 'OK' else dum <- 'NOK'
a<-table.element(a,dum)
a<-table.row.end(a)
a<-table.row.start(a)
a<-table.element(a,'10% type I error level',header=TRUE)
a<-table.element(a,signif(numsignificant10,6))
a<-table.element(a,signif(numsignificant10/numgqtests,6))
if (numsignificant10/numgqtests < 0.1) dum <- 'OK' else dum <- 'NOK'
a<-table.element(a,dum)
a<-table.row.end(a)
a<-table.end(a)
table.save(a,file='mytable6.tab')
}