Free Statistics

of Irreproducible Research!

Author's title

Author*Unverified author*
R Software Modulerwasp_exponentialsmoothing.wasp
Title produced by softwareExponential Smoothing
Date of computationMon, 22 Dec 2014 16:14:41 +0000
Cite this page as followsStatistical Computations at FreeStatistics.org, Office for Research Development and Education, URL https://freestatistics.org/blog/index.php?v=date/2014/Dec/22/t1419264928k15z5h4buoiav5e.htm/, Retrieved Thu, 16 May 2024 05:19:27 +0000
Statistical Computations at FreeStatistics.org, Office for Research Development and Education, URL https://freestatistics.org/blog/index.php?pk=271405, Retrieved Thu, 16 May 2024 05:19:27 +0000
QR Codes:

Original text written by user:
IsPrivate?No (this computation is public)
User-defined keywords
Estimated Impact139
Family? (F = Feedback message, R = changed R code, M = changed R Module, P = changed Parameters, D = changed Data)
-       [Exponential Smoothing] [Opgave 11 (Aangep...] [2014-12-22 16:14:41] [115da6a797a228c0404960d99697d46c] [Current]
Feedback Forum

Post a new message
Dataseries X:
219
231
247
259
278
289
252
224
242
303
305
283
259
224
252
273
252
265
285
224
283
279
296
269
252
226
259
301
260
282
311
263
276
296
310
290
273
267
302
322
314
300
316
299
295
340
333
316
294
309
354
335
313
338
357
324
296
378
343
301
309
271
308
326
336
310
335
298
288
319
328
315


Summary of computational transaction
Raw Inputview raw input (R code)
Raw Outputview raw output of R engine
Computing time2 seconds
R Server'Herman Ole Andreas Wold' @ wold.wessa.net

\begin{tabular}{lllllllll}
\hline
Summary of computational transaction \tabularnewline
Raw Input & view raw input (R code)  \tabularnewline
Raw Output & view raw output of R engine  \tabularnewline
Computing time & 2 seconds \tabularnewline
R Server & 'Herman Ole Andreas Wold' @ wold.wessa.net \tabularnewline
\hline
\end{tabular}
%Source: https://freestatistics.org/blog/index.php?pk=271405&T=0

[TABLE]
[ROW][C]Summary of computational transaction[/C][/ROW]
[ROW][C]Raw Input[/C][C]view raw input (R code) [/C][/ROW]
[ROW][C]Raw Output[/C][C]view raw output of R engine [/C][/ROW]
[ROW][C]Computing time[/C][C]2 seconds[/C][/ROW]
[ROW][C]R Server[/C][C]'Herman Ole Andreas Wold' @ wold.wessa.net[/C][/ROW]
[/TABLE]
Source: https://freestatistics.org/blog/index.php?pk=271405&T=0

Globally Unique Identifier (entire table): ba.freestatistics.org/blog/index.php?pk=271405&T=0

As an alternative you can also use a QR Code:  

The GUIDs for individual cells are displayed in the table below:

Summary of computational transaction
Raw Inputview raw input (R code)
Raw Outputview raw output of R engine
Computing time2 seconds
R Server'Herman Ole Andreas Wold' @ wold.wessa.net


Estimated Parameters of Exponential Smoothing
ParameterValue
alpha0.232054732520118
beta1.47816841688365e-05
gamma0.611076941322128

\begin{tabular}{lllllllll}
\hline
Estimated Parameters of Exponential Smoothing \tabularnewline
Parameter & Value \tabularnewline
alpha & 0.232054732520118 \tabularnewline
beta & 1.47816841688365e-05 \tabularnewline
gamma & 0.611076941322128 \tabularnewline
\hline
\end{tabular}
%Source: https://freestatistics.org/blog/index.php?pk=271405&T=1

[TABLE]
[ROW][C]Estimated Parameters of Exponential Smoothing[/C][/ROW]
[ROW][C]Parameter[/C][C]Value[/C][/ROW]
[ROW][C]alpha[/C][C]0.232054732520118[/C][/ROW]
[ROW][C]beta[/C][C]1.47816841688365e-05[/C][/ROW]
[ROW][C]gamma[/C][C]0.611076941322128[/C][/ROW]
[/TABLE]
Source: https://freestatistics.org/blog/index.php?pk=271405&T=1

Globally Unique Identifier (entire table): ba.freestatistics.org/blog/index.php?pk=271405&T=1

As an alternative you can also use a QR Code:  

The GUIDs for individual cells are displayed in the table below:

Estimated Parameters of Exponential Smoothing
ParameterValue
alpha0.232054732520118
beta1.47816841688365e-05
gamma0.611076941322128


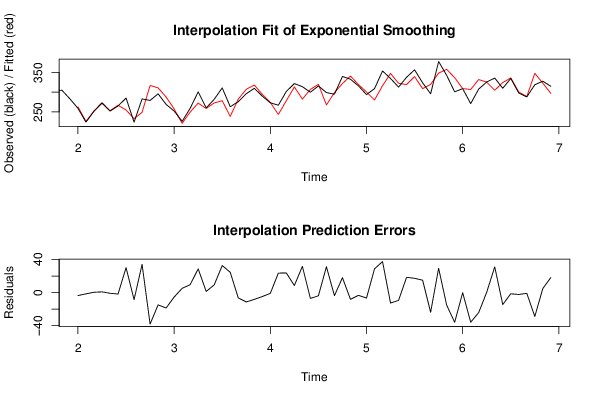
Interpolation Forecasts of Exponential Smoothing
tObservedFittedResiduals
13259262.660523504273-3.6605235042735
14224225.587438609295-1.58743860929471
15252251.662084096610.3379159033897
16273272.1835183694790.816481630521082
17252252.899342218146-0.899342218145961
18265266.800331271005-1.80033127100489
19285254.86723537477530.1327646252248
20224232.636135532148-8.63613553214785
21283248.86683264341134.1331673565891
22279317.147465978809-38.1474659788091
23296310.94657209394-14.9465720939405
24269287.712837497956-18.7128374979557
25252257.428938461663-5.42893846166294
26226220.918243754345.08175624565985
27259249.4439636188299.55603638117108
28301272.3290542949528.6709457050496
29260258.7035126255051.29648737449526
30282272.6913166255999.30868337440108
31311278.32159128498932.6784087150105
32263238.48811665842724.5118833415734
33276282.48170834651-6.48170834650961
34296307.418165225599-11.4181652255993
35310318.307685748115-8.30768574811515
36290294.847335451478-4.84733545147765
37273274.015031466245-1.01503146624549
38267243.46126788471323.5387321152867
39302278.37001250695823.6299874930421
40322313.4915360055258.50846399447494
41314282.34139671681731.6586032831833
42300307.135203498255-7.13520349825529
43316319.916753852348-3.91675385234817
44299267.75909917487631.240900825124
45295298.769974289367-3.76997428936676
46340322.01942089966917.9805791003312
47333341.191094181847-8.19109418184695
48316319.38202007318-3.38202007318012
49294300.688523108904-6.68852310890395
50309280.3409880112628.6590119887402
51354316.48111404841937.5188859515809
52335347.729909847155-12.7299098471546
53313322.515402932127-9.51540293212736
54338319.54988164814818.4501183518524
55357339.7792544308317.2207455691704
56324309.0255836114814.9744163885201
57296319.832373567469-23.8323735674689
58378348.63344865715429.3665513428465
59343358.165894921601-15.1658949216011
60301336.995313864969-35.9953138649695
61309309.182237967431-0.182237967431377
62271306.932351054564-35.9323510545637
63308332.241396693133-24.2413966931329
64326325.5777249310360.422275068963586
65336304.92350713800531.0764928619953
66310324.50092771512-14.5009277151204
67335336.506747270667-1.50674727066701
68298300.35287098966-2.35287098966046
69288288.927459655939-0.927459655938549
70319348.008341922754-29.0083419227537
71328323.0962744182264.9037255817737
72315296.80787512711218.192124872888

\begin{tabular}{lllllllll}
\hline
Interpolation Forecasts of Exponential Smoothing \tabularnewline
t & Observed & Fitted & Residuals \tabularnewline
13 & 259 & 262.660523504273 & -3.6605235042735 \tabularnewline
14 & 224 & 225.587438609295 & -1.58743860929471 \tabularnewline
15 & 252 & 251.66208409661 & 0.3379159033897 \tabularnewline
16 & 273 & 272.183518369479 & 0.816481630521082 \tabularnewline
17 & 252 & 252.899342218146 & -0.899342218145961 \tabularnewline
18 & 265 & 266.800331271005 & -1.80033127100489 \tabularnewline
19 & 285 & 254.867235374775 & 30.1327646252248 \tabularnewline
20 & 224 & 232.636135532148 & -8.63613553214785 \tabularnewline
21 & 283 & 248.866832643411 & 34.1331673565891 \tabularnewline
22 & 279 & 317.147465978809 & -38.1474659788091 \tabularnewline
23 & 296 & 310.94657209394 & -14.9465720939405 \tabularnewline
24 & 269 & 287.712837497956 & -18.7128374979557 \tabularnewline
25 & 252 & 257.428938461663 & -5.42893846166294 \tabularnewline
26 & 226 & 220.91824375434 & 5.08175624565985 \tabularnewline
27 & 259 & 249.443963618829 & 9.55603638117108 \tabularnewline
28 & 301 & 272.32905429495 & 28.6709457050496 \tabularnewline
29 & 260 & 258.703512625505 & 1.29648737449526 \tabularnewline
30 & 282 & 272.691316625599 & 9.30868337440108 \tabularnewline
31 & 311 & 278.321591284989 & 32.6784087150105 \tabularnewline
32 & 263 & 238.488116658427 & 24.5118833415734 \tabularnewline
33 & 276 & 282.48170834651 & -6.48170834650961 \tabularnewline
34 & 296 & 307.418165225599 & -11.4181652255993 \tabularnewline
35 & 310 & 318.307685748115 & -8.30768574811515 \tabularnewline
36 & 290 & 294.847335451478 & -4.84733545147765 \tabularnewline
37 & 273 & 274.015031466245 & -1.01503146624549 \tabularnewline
38 & 267 & 243.461267884713 & 23.5387321152867 \tabularnewline
39 & 302 & 278.370012506958 & 23.6299874930421 \tabularnewline
40 & 322 & 313.491536005525 & 8.50846399447494 \tabularnewline
41 & 314 & 282.341396716817 & 31.6586032831833 \tabularnewline
42 & 300 & 307.135203498255 & -7.13520349825529 \tabularnewline
43 & 316 & 319.916753852348 & -3.91675385234817 \tabularnewline
44 & 299 & 267.759099174876 & 31.240900825124 \tabularnewline
45 & 295 & 298.769974289367 & -3.76997428936676 \tabularnewline
46 & 340 & 322.019420899669 & 17.9805791003312 \tabularnewline
47 & 333 & 341.191094181847 & -8.19109418184695 \tabularnewline
48 & 316 & 319.38202007318 & -3.38202007318012 \tabularnewline
49 & 294 & 300.688523108904 & -6.68852310890395 \tabularnewline
50 & 309 & 280.34098801126 & 28.6590119887402 \tabularnewline
51 & 354 & 316.481114048419 & 37.5188859515809 \tabularnewline
52 & 335 & 347.729909847155 & -12.7299098471546 \tabularnewline
53 & 313 & 322.515402932127 & -9.51540293212736 \tabularnewline
54 & 338 & 319.549881648148 & 18.4501183518524 \tabularnewline
55 & 357 & 339.77925443083 & 17.2207455691704 \tabularnewline
56 & 324 & 309.02558361148 & 14.9744163885201 \tabularnewline
57 & 296 & 319.832373567469 & -23.8323735674689 \tabularnewline
58 & 378 & 348.633448657154 & 29.3665513428465 \tabularnewline
59 & 343 & 358.165894921601 & -15.1658949216011 \tabularnewline
60 & 301 & 336.995313864969 & -35.9953138649695 \tabularnewline
61 & 309 & 309.182237967431 & -0.182237967431377 \tabularnewline
62 & 271 & 306.932351054564 & -35.9323510545637 \tabularnewline
63 & 308 & 332.241396693133 & -24.2413966931329 \tabularnewline
64 & 326 & 325.577724931036 & 0.422275068963586 \tabularnewline
65 & 336 & 304.923507138005 & 31.0764928619953 \tabularnewline
66 & 310 & 324.50092771512 & -14.5009277151204 \tabularnewline
67 & 335 & 336.506747270667 & -1.50674727066701 \tabularnewline
68 & 298 & 300.35287098966 & -2.35287098966046 \tabularnewline
69 & 288 & 288.927459655939 & -0.927459655938549 \tabularnewline
70 & 319 & 348.008341922754 & -29.0083419227537 \tabularnewline
71 & 328 & 323.096274418226 & 4.9037255817737 \tabularnewline
72 & 315 & 296.807875127112 & 18.192124872888 \tabularnewline
\hline
\end{tabular}
%Source: https://freestatistics.org/blog/index.php?pk=271405&T=2

[TABLE]
[ROW][C]Interpolation Forecasts of Exponential Smoothing[/C][/ROW]
[ROW][C]t[/C][C]Observed[/C][C]Fitted[/C][C]Residuals[/C][/ROW]
[ROW][C]13[/C][C]259[/C][C]262.660523504273[/C][C]-3.6605235042735[/C][/ROW]
[ROW][C]14[/C][C]224[/C][C]225.587438609295[/C][C]-1.58743860929471[/C][/ROW]
[ROW][C]15[/C][C]252[/C][C]251.66208409661[/C][C]0.3379159033897[/C][/ROW]
[ROW][C]16[/C][C]273[/C][C]272.183518369479[/C][C]0.816481630521082[/C][/ROW]
[ROW][C]17[/C][C]252[/C][C]252.899342218146[/C][C]-0.899342218145961[/C][/ROW]
[ROW][C]18[/C][C]265[/C][C]266.800331271005[/C][C]-1.80033127100489[/C][/ROW]
[ROW][C]19[/C][C]285[/C][C]254.867235374775[/C][C]30.1327646252248[/C][/ROW]
[ROW][C]20[/C][C]224[/C][C]232.636135532148[/C][C]-8.63613553214785[/C][/ROW]
[ROW][C]21[/C][C]283[/C][C]248.866832643411[/C][C]34.1331673565891[/C][/ROW]
[ROW][C]22[/C][C]279[/C][C]317.147465978809[/C][C]-38.1474659788091[/C][/ROW]
[ROW][C]23[/C][C]296[/C][C]310.94657209394[/C][C]-14.9465720939405[/C][/ROW]
[ROW][C]24[/C][C]269[/C][C]287.712837497956[/C][C]-18.7128374979557[/C][/ROW]
[ROW][C]25[/C][C]252[/C][C]257.428938461663[/C][C]-5.42893846166294[/C][/ROW]
[ROW][C]26[/C][C]226[/C][C]220.91824375434[/C][C]5.08175624565985[/C][/ROW]
[ROW][C]27[/C][C]259[/C][C]249.443963618829[/C][C]9.55603638117108[/C][/ROW]
[ROW][C]28[/C][C]301[/C][C]272.32905429495[/C][C]28.6709457050496[/C][/ROW]
[ROW][C]29[/C][C]260[/C][C]258.703512625505[/C][C]1.29648737449526[/C][/ROW]
[ROW][C]30[/C][C]282[/C][C]272.691316625599[/C][C]9.30868337440108[/C][/ROW]
[ROW][C]31[/C][C]311[/C][C]278.321591284989[/C][C]32.6784087150105[/C][/ROW]
[ROW][C]32[/C][C]263[/C][C]238.488116658427[/C][C]24.5118833415734[/C][/ROW]
[ROW][C]33[/C][C]276[/C][C]282.48170834651[/C][C]-6.48170834650961[/C][/ROW]
[ROW][C]34[/C][C]296[/C][C]307.418165225599[/C][C]-11.4181652255993[/C][/ROW]
[ROW][C]35[/C][C]310[/C][C]318.307685748115[/C][C]-8.30768574811515[/C][/ROW]
[ROW][C]36[/C][C]290[/C][C]294.847335451478[/C][C]-4.84733545147765[/C][/ROW]
[ROW][C]37[/C][C]273[/C][C]274.015031466245[/C][C]-1.01503146624549[/C][/ROW]
[ROW][C]38[/C][C]267[/C][C]243.461267884713[/C][C]23.5387321152867[/C][/ROW]
[ROW][C]39[/C][C]302[/C][C]278.370012506958[/C][C]23.6299874930421[/C][/ROW]
[ROW][C]40[/C][C]322[/C][C]313.491536005525[/C][C]8.50846399447494[/C][/ROW]
[ROW][C]41[/C][C]314[/C][C]282.341396716817[/C][C]31.6586032831833[/C][/ROW]
[ROW][C]42[/C][C]300[/C][C]307.135203498255[/C][C]-7.13520349825529[/C][/ROW]
[ROW][C]43[/C][C]316[/C][C]319.916753852348[/C][C]-3.91675385234817[/C][/ROW]
[ROW][C]44[/C][C]299[/C][C]267.759099174876[/C][C]31.240900825124[/C][/ROW]
[ROW][C]45[/C][C]295[/C][C]298.769974289367[/C][C]-3.76997428936676[/C][/ROW]
[ROW][C]46[/C][C]340[/C][C]322.019420899669[/C][C]17.9805791003312[/C][/ROW]
[ROW][C]47[/C][C]333[/C][C]341.191094181847[/C][C]-8.19109418184695[/C][/ROW]
[ROW][C]48[/C][C]316[/C][C]319.38202007318[/C][C]-3.38202007318012[/C][/ROW]
[ROW][C]49[/C][C]294[/C][C]300.688523108904[/C][C]-6.68852310890395[/C][/ROW]
[ROW][C]50[/C][C]309[/C][C]280.34098801126[/C][C]28.6590119887402[/C][/ROW]
[ROW][C]51[/C][C]354[/C][C]316.481114048419[/C][C]37.5188859515809[/C][/ROW]
[ROW][C]52[/C][C]335[/C][C]347.729909847155[/C][C]-12.7299098471546[/C][/ROW]
[ROW][C]53[/C][C]313[/C][C]322.515402932127[/C][C]-9.51540293212736[/C][/ROW]
[ROW][C]54[/C][C]338[/C][C]319.549881648148[/C][C]18.4501183518524[/C][/ROW]
[ROW][C]55[/C][C]357[/C][C]339.77925443083[/C][C]17.2207455691704[/C][/ROW]
[ROW][C]56[/C][C]324[/C][C]309.02558361148[/C][C]14.9744163885201[/C][/ROW]
[ROW][C]57[/C][C]296[/C][C]319.832373567469[/C][C]-23.8323735674689[/C][/ROW]
[ROW][C]58[/C][C]378[/C][C]348.633448657154[/C][C]29.3665513428465[/C][/ROW]
[ROW][C]59[/C][C]343[/C][C]358.165894921601[/C][C]-15.1658949216011[/C][/ROW]
[ROW][C]60[/C][C]301[/C][C]336.995313864969[/C][C]-35.9953138649695[/C][/ROW]
[ROW][C]61[/C][C]309[/C][C]309.182237967431[/C][C]-0.182237967431377[/C][/ROW]
[ROW][C]62[/C][C]271[/C][C]306.932351054564[/C][C]-35.9323510545637[/C][/ROW]
[ROW][C]63[/C][C]308[/C][C]332.241396693133[/C][C]-24.2413966931329[/C][/ROW]
[ROW][C]64[/C][C]326[/C][C]325.577724931036[/C][C]0.422275068963586[/C][/ROW]
[ROW][C]65[/C][C]336[/C][C]304.923507138005[/C][C]31.0764928619953[/C][/ROW]
[ROW][C]66[/C][C]310[/C][C]324.50092771512[/C][C]-14.5009277151204[/C][/ROW]
[ROW][C]67[/C][C]335[/C][C]336.506747270667[/C][C]-1.50674727066701[/C][/ROW]
[ROW][C]68[/C][C]298[/C][C]300.35287098966[/C][C]-2.35287098966046[/C][/ROW]
[ROW][C]69[/C][C]288[/C][C]288.927459655939[/C][C]-0.927459655938549[/C][/ROW]
[ROW][C]70[/C][C]319[/C][C]348.008341922754[/C][C]-29.0083419227537[/C][/ROW]
[ROW][C]71[/C][C]328[/C][C]323.096274418226[/C][C]4.9037255817737[/C][/ROW]
[ROW][C]72[/C][C]315[/C][C]296.807875127112[/C][C]18.192124872888[/C][/ROW]
[/TABLE]
Source: https://freestatistics.org/blog/index.php?pk=271405&T=2

Globally Unique Identifier (entire table): ba.freestatistics.org/blog/index.php?pk=271405&T=2

As an alternative you can also use a QR Code:  

The GUIDs for individual cells are displayed in the table below:

Interpolation Forecasts of Exponential Smoothing
tObservedFittedResiduals
13259262.660523504273-3.6605235042735
14224225.587438609295-1.58743860929471
15252251.662084096610.3379159033897
16273272.1835183694790.816481630521082
17252252.899342218146-0.899342218145961
18265266.800331271005-1.80033127100489
19285254.86723537477530.1327646252248
20224232.636135532148-8.63613553214785
21283248.86683264341134.1331673565891
22279317.147465978809-38.1474659788091
23296310.94657209394-14.9465720939405
24269287.712837497956-18.7128374979557
25252257.428938461663-5.42893846166294
26226220.918243754345.08175624565985
27259249.4439636188299.55603638117108
28301272.3290542949528.6709457050496
29260258.7035126255051.29648737449526
30282272.6913166255999.30868337440108
31311278.32159128498932.6784087150105
32263238.48811665842724.5118833415734
33276282.48170834651-6.48170834650961
34296307.418165225599-11.4181652255993
35310318.307685748115-8.30768574811515
36290294.847335451478-4.84733545147765
37273274.015031466245-1.01503146624549
38267243.46126788471323.5387321152867
39302278.37001250695823.6299874930421
40322313.4915360055258.50846399447494
41314282.34139671681731.6586032831833
42300307.135203498255-7.13520349825529
43316319.916753852348-3.91675385234817
44299267.75909917487631.240900825124
45295298.769974289367-3.76997428936676
46340322.01942089966917.9805791003312
47333341.191094181847-8.19109418184695
48316319.38202007318-3.38202007318012
49294300.688523108904-6.68852310890395
50309280.3409880112628.6590119887402
51354316.48111404841937.5188859515809
52335347.729909847155-12.7299098471546
53313322.515402932127-9.51540293212736
54338319.54988164814818.4501183518524
55357339.7792544308317.2207455691704
56324309.0255836114814.9744163885201
57296319.832373567469-23.8323735674689
58378348.63344865715429.3665513428465
59343358.165894921601-15.1658949216011
60301336.995313864969-35.9953138649695
61309309.182237967431-0.182237967431377
62271306.932351054564-35.9323510545637
63308332.241396693133-24.2413966931329
64326325.5777249310360.422275068963586
65336304.92350713800531.0764928619953
66310324.50092771512-14.5009277151204
67335336.506747270667-1.50674727066701
68298300.35287098966-2.35287098966046
69288288.927459655939-0.927459655938549
70319348.008341922754-29.0083419227537
71328323.0962744182264.9037255817737
72315296.80787512711218.192124872888


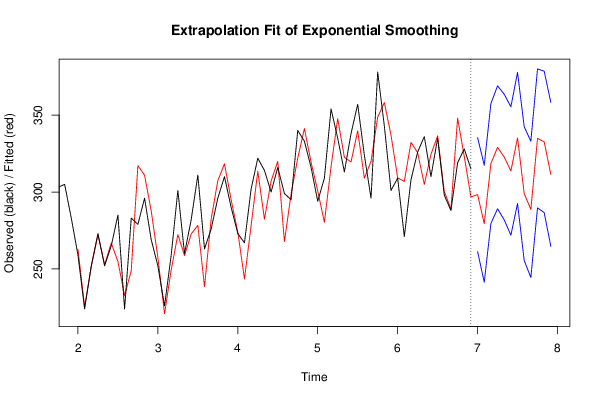
Extrapolation Forecasts of Exponential Smoothing
tForecast95% Lower Bound95% Upper Bound
73298.375198075868261.338446347811335.411949803925
74279.390829661214241.369920776053317.411738546374
75318.524342633303279.544088271278357.504596995328
76329.060034451511289.143457298385368.976611604637
77322.693062408999281.861601291794363.524523526204
78313.670667014671271.944350544204355.396983485138
79335.139285194174292.5368798708377.741690517547
80298.937961653325255.477099070671342.398824235979
81288.727429678058244.424716471078333.030142885038
82334.845895085965289.717008521105379.974781650824
83332.579469362203286.639240893977378.519697830429
84311.389095318361264.651583992675358.126606644048

\begin{tabular}{lllllllll}
\hline
Extrapolation Forecasts of Exponential Smoothing \tabularnewline
t & Forecast & 95% Lower Bound & 95% Upper Bound \tabularnewline
73 & 298.375198075868 & 261.338446347811 & 335.411949803925 \tabularnewline
74 & 279.390829661214 & 241.369920776053 & 317.411738546374 \tabularnewline
75 & 318.524342633303 & 279.544088271278 & 357.504596995328 \tabularnewline
76 & 329.060034451511 & 289.143457298385 & 368.976611604637 \tabularnewline
77 & 322.693062408999 & 281.861601291794 & 363.524523526204 \tabularnewline
78 & 313.670667014671 & 271.944350544204 & 355.396983485138 \tabularnewline
79 & 335.139285194174 & 292.5368798708 & 377.741690517547 \tabularnewline
80 & 298.937961653325 & 255.477099070671 & 342.398824235979 \tabularnewline
81 & 288.727429678058 & 244.424716471078 & 333.030142885038 \tabularnewline
82 & 334.845895085965 & 289.717008521105 & 379.974781650824 \tabularnewline
83 & 332.579469362203 & 286.639240893977 & 378.519697830429 \tabularnewline
84 & 311.389095318361 & 264.651583992675 & 358.126606644048 \tabularnewline
\hline
\end{tabular}
%Source: https://freestatistics.org/blog/index.php?pk=271405&T=3

[TABLE]
[ROW][C]Extrapolation Forecasts of Exponential Smoothing[/C][/ROW]
[ROW][C]t[/C][C]Forecast[/C][C]95% Lower Bound[/C][C]95% Upper Bound[/C][/ROW]
[ROW][C]73[/C][C]298.375198075868[/C][C]261.338446347811[/C][C]335.411949803925[/C][/ROW]
[ROW][C]74[/C][C]279.390829661214[/C][C]241.369920776053[/C][C]317.411738546374[/C][/ROW]
[ROW][C]75[/C][C]318.524342633303[/C][C]279.544088271278[/C][C]357.504596995328[/C][/ROW]
[ROW][C]76[/C][C]329.060034451511[/C][C]289.143457298385[/C][C]368.976611604637[/C][/ROW]
[ROW][C]77[/C][C]322.693062408999[/C][C]281.861601291794[/C][C]363.524523526204[/C][/ROW]
[ROW][C]78[/C][C]313.670667014671[/C][C]271.944350544204[/C][C]355.396983485138[/C][/ROW]
[ROW][C]79[/C][C]335.139285194174[/C][C]292.5368798708[/C][C]377.741690517547[/C][/ROW]
[ROW][C]80[/C][C]298.937961653325[/C][C]255.477099070671[/C][C]342.398824235979[/C][/ROW]
[ROW][C]81[/C][C]288.727429678058[/C][C]244.424716471078[/C][C]333.030142885038[/C][/ROW]
[ROW][C]82[/C][C]334.845895085965[/C][C]289.717008521105[/C][C]379.974781650824[/C][/ROW]
[ROW][C]83[/C][C]332.579469362203[/C][C]286.639240893977[/C][C]378.519697830429[/C][/ROW]
[ROW][C]84[/C][C]311.389095318361[/C][C]264.651583992675[/C][C]358.126606644048[/C][/ROW]
[/TABLE]
Source: https://freestatistics.org/blog/index.php?pk=271405&T=3

Globally Unique Identifier (entire table): ba.freestatistics.org/blog/index.php?pk=271405&T=3

As an alternative you can also use a QR Code:  

The GUIDs for individual cells are displayed in the table below:

Extrapolation Forecasts of Exponential Smoothing
tForecast95% Lower Bound95% Upper Bound
73298.375198075868261.338446347811335.411949803925
74279.390829661214241.369920776053317.411738546374
75318.524342633303279.544088271278357.504596995328
76329.060034451511289.143457298385368.976611604637
77322.693062408999281.861601291794363.524523526204
78313.670667014671271.944350544204355.396983485138
79335.139285194174292.5368798708377.741690517547
80298.937961653325255.477099070671342.398824235979
81288.727429678058244.424716471078333.030142885038
82334.845895085965289.717008521105379.974781650824
83332.579469362203286.639240893977378.519697830429
84311.389095318361264.651583992675358.126606644048


Parameters (Session):
par1 = 12 ; par2 = Triple ; par3 = additive ;
Parameters (R input):
par1 = 12 ; par2 = Triple ; par3 = additive ;
R code (references can be found in the software module):
par1 <- as.numeric(par1)
if (par2 == 'Single') K <- 1
if (par2 == 'Double') K <- 2
if (par2 == 'Triple') K <- par1
nx <- length(x)
nxmK <- nx - K
x <- ts(x, frequency = par1)
if (par2 == 'Single') fit <- HoltWinters(x, gamma=F, beta=F)
if (par2 == 'Double') fit <- HoltWinters(x, gamma=F)
if (par2 == 'Triple') fit <- HoltWinters(x, seasonal=par3)
fit
myresid <- x - fit$fitted[,'xhat']
bitmap(file='test1.png')
op <- par(mfrow=c(2,1))
plot(fit,ylab='Observed (black) / Fitted (red)',main='Interpolation Fit of Exponential Smoothing')
plot(myresid,ylab='Residuals',main='Interpolation Prediction Errors')
par(op)
dev.off()
bitmap(file='test2.png')
p <- predict(fit, par1, prediction.interval=TRUE)
np <- length(p[,1])
plot(fit,p,ylab='Observed (black) / Fitted (red)',main='Extrapolation Fit of Exponential Smoothing')
dev.off()
bitmap(file='test3.png')
op <- par(mfrow = c(2,2))
acf(as.numeric(myresid),lag.max = nx/2,main='Residual ACF')
spectrum(myresid,main='Residals Periodogram')
cpgram(myresid,main='Residal Cumulative Periodogram')
qqnorm(myresid,main='Residual Normal QQ Plot')
qqline(myresid)
par(op)
dev.off()
load(file='createtable')
a<-table.start()
a<-table.row.start(a)
a<-table.element(a,'Estimated Parameters of Exponential Smoothing',2,TRUE)
a<-table.row.end(a)
a<-table.row.start(a)
a<-table.element(a,'Parameter',header=TRUE)
a<-table.element(a,'Value',header=TRUE)
a<-table.row.end(a)
a<-table.row.start(a)
a<-table.element(a,'alpha',header=TRUE)
a<-table.element(a,fit$alpha)
a<-table.row.end(a)
a<-table.row.start(a)
a<-table.element(a,'beta',header=TRUE)
a<-table.element(a,fit$beta)
a<-table.row.end(a)
a<-table.row.start(a)
a<-table.element(a,'gamma',header=TRUE)
a<-table.element(a,fit$gamma)
a<-table.row.end(a)
a<-table.end(a)
table.save(a,file='mytable.tab')
a<-table.start()
a<-table.row.start(a)
a<-table.element(a,'Interpolation Forecasts of Exponential Smoothing',4,TRUE)
a<-table.row.end(a)
a<-table.row.start(a)
a<-table.element(a,'t',header=TRUE)
a<-table.element(a,'Observed',header=TRUE)
a<-table.element(a,'Fitted',header=TRUE)
a<-table.element(a,'Residuals',header=TRUE)
a<-table.row.end(a)
for (i in 1:nxmK) {
a<-table.row.start(a)
a<-table.element(a,i+K,header=TRUE)
a<-table.element(a,x[i+K])
a<-table.element(a,fit$fitted[i,'xhat'])
a<-table.element(a,myresid[i])
a<-table.row.end(a)
}
a<-table.end(a)
table.save(a,file='mytable1.tab')
a<-table.start()
a<-table.row.start(a)
a<-table.element(a,'Extrapolation Forecasts of Exponential Smoothing',4,TRUE)
a<-table.row.end(a)
a<-table.row.start(a)
a<-table.element(a,'t',header=TRUE)
a<-table.element(a,'Forecast',header=TRUE)
a<-table.element(a,'95% Lower Bound',header=TRUE)
a<-table.element(a,'95% Upper Bound',header=TRUE)
a<-table.row.end(a)
for (i in 1:np) {
a<-table.row.start(a)
a<-table.element(a,nx+i,header=TRUE)
a<-table.element(a,p[i,'fit'])
a<-table.element(a,p[i,'lwr'])
a<-table.element(a,p[i,'upr'])
a<-table.row.end(a)
}
a<-table.end(a)
table.save(a,file='mytable2.tab')