Free Statistics
of Irreproducible Research!
Description of Statistical Computation | |||||||||||||||||||||||||||||||||||||||||||||||||||||||||||||||||||||||||||||||||||||||||||||||||||||||||||||||||||||||||||||||||||
|---|---|---|---|---|---|---|---|---|---|---|---|---|---|---|---|---|---|---|---|---|---|---|---|---|---|---|---|---|---|---|---|---|---|---|---|---|---|---|---|---|---|---|---|---|---|---|---|---|---|---|---|---|---|---|---|---|---|---|---|---|---|---|---|---|---|---|---|---|---|---|---|---|---|---|---|---|---|---|---|---|---|---|---|---|---|---|---|---|---|---|---|---|---|---|---|---|---|---|---|---|---|---|---|---|---|---|---|---|---|---|---|---|---|---|---|---|---|---|---|---|---|---|---|---|---|---|---|---|---|---|---|
| Author's title | |||||||||||||||||||||||||||||||||||||||||||||||||||||||||||||||||||||||||||||||||||||||||||||||||||||||||||||||||||||||||||||||||||
| Author | *The author of this computation has been verified* | ||||||||||||||||||||||||||||||||||||||||||||||||||||||||||||||||||||||||||||||||||||||||||||||||||||||||||||||||||||||||||||||||||
| R Software Module | rwasp_BoxplotAndScatterplotMatrix.wasp | ||||||||||||||||||||||||||||||||||||||||||||||||||||||||||||||||||||||||||||||||||||||||||||||||||||||||||||||||||||||||||||||||||
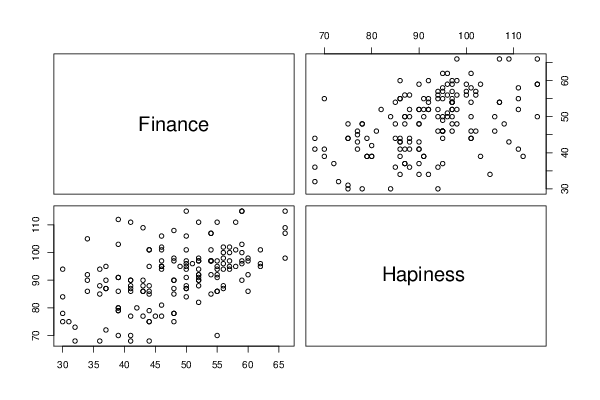
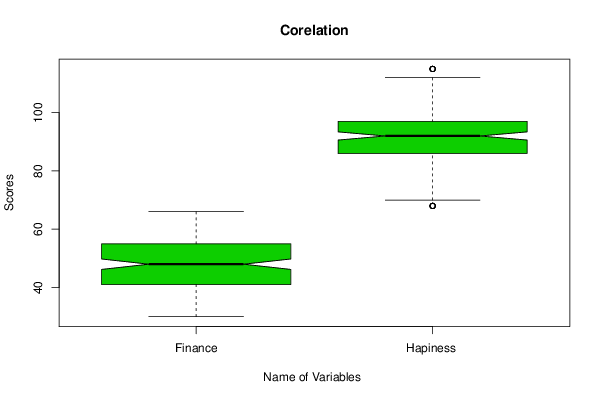
| Title produced by software | Boxplot and Trimmed Means | ||||||||||||||||||||||||||||||||||||||||||||||||||||||||||||||||||||||||||||||||||||||||||||||||||||||||||||||||||||||||||||||||||
| Date of computation | Tue, 23 Dec 2014 07:23:01 +0000 | ||||||||||||||||||||||||||||||||||||||||||||||||||||||||||||||||||||||||||||||||||||||||||||||||||||||||||||||||||||||||||||||||||
| Cite this page as follows | Statistical Computations at FreeStatistics.org, Office for Research Development and Education, URL https://freestatistics.org/blog/index.php?v=date/2014/Dec/23/t1419319394id7zm9r8sctj3l2.htm/, Retrieved Thu, 16 May 2024 12:22:33 +0000 | ||||||||||||||||||||||||||||||||||||||||||||||||||||||||||||||||||||||||||||||||||||||||||||||||||||||||||||||||||||||||||||||||||
| Statistical Computations at FreeStatistics.org, Office for Research Development and Education, URL https://freestatistics.org/blog/index.php?pk=271410, Retrieved Thu, 16 May 2024 12:22:33 +0000 | |||||||||||||||||||||||||||||||||||||||||||||||||||||||||||||||||||||||||||||||||||||||||||||||||||||||||||||||||||||||||||||||||||
| QR Codes: | |||||||||||||||||||||||||||||||||||||||||||||||||||||||||||||||||||||||||||||||||||||||||||||||||||||||||||||||||||||||||||||||||||
|
| |||||||||||||||||||||||||||||||||||||||||||||||||||||||||||||||||||||||||||||||||||||||||||||||||||||||||||||||||||||||||||||||||||
| Original text written by user: | |||||||||||||||||||||||||||||||||||||||||||||||||||||||||||||||||||||||||||||||||||||||||||||||||||||||||||||||||||||||||||||||||||
| IsPrivate? | No (this computation is public) | ||||||||||||||||||||||||||||||||||||||||||||||||||||||||||||||||||||||||||||||||||||||||||||||||||||||||||||||||||||||||||||||||||
| User-defined keywords | |||||||||||||||||||||||||||||||||||||||||||||||||||||||||||||||||||||||||||||||||||||||||||||||||||||||||||||||||||||||||||||||||||
| Estimated Impact | 156 | ||||||||||||||||||||||||||||||||||||||||||||||||||||||||||||||||||||||||||||||||||||||||||||||||||||||||||||||||||||||||||||||||||
Tree of Dependent Computations | |||||||||||||||||||||||||||||||||||||||||||||||||||||||||||||||||||||||||||||||||||||||||||||||||||||||||||||||||||||||||||||||||||
| Family? (F = Feedback message, R = changed R code, M = changed R Module, P = changed Parameters, D = changed Data) | |||||||||||||||||||||||||||||||||||||||||||||||||||||||||||||||||||||||||||||||||||||||||||||||||||||||||||||||||||||||||||||||||||
| - [Histogram, QQplot and Density] [] [2014-10-11 09:05:01] [32b17a345b130fdf5cc88718ed94a974] - R D [Histogram, QQplot and Density] [compmemomean NO] [2014-12-01 17:59:29] [db73a12161c07082da7682d758029ebc] - D [Histogram, QQplot and Density] [compattenmean NO] [2014-12-01 18:04:36] [db73a12161c07082da7682d758029ebc] - D [Histogram, QQplot and Density] [NO ] [2014-12-01 18:07:44] [db73a12161c07082da7682d758029ebc] - D [Histogram, QQplot and Density] [Almost.. NO] [2014-12-01 18:15:27] [db73a12161c07082da7682d758029ebc] - D [Histogram, QQplot and Density] [specattenmean NP....] [2014-12-01 18:19:37] [db73a12161c07082da7682d758029ebc] - RMPD [Correlation] [kendalls Tau] [2014-12-01 19:33:34] [db73a12161c07082da7682d758029ebc] - RMPD [Boxplot and Trimmed Means] [Scatter plot ] [2014-12-01 20:00:37] [db73a12161c07082da7682d758029ebc] - R D [Boxplot and Trimmed Means] [hapiness] [2014-12-23 07:23:01] [b1266da26a0b890274b48408df050392] [Current] | |||||||||||||||||||||||||||||||||||||||||||||||||||||||||||||||||||||||||||||||||||||||||||||||||||||||||||||||||||||||||||||||||||
| Feedback Forum | |||||||||||||||||||||||||||||||||||||||||||||||||||||||||||||||||||||||||||||||||||||||||||||||||||||||||||||||||||||||||||||||||||
Post a new message | |||||||||||||||||||||||||||||||||||||||||||||||||||||||||||||||||||||||||||||||||||||||||||||||||||||||||||||||||||||||||||||||||||
Dataset | |||||||||||||||||||||||||||||||||||||||||||||||||||||||||||||||||||||||||||||||||||||||||||||||||||||||||||||||||||||||||||||||||||
| Dataseries X: | |||||||||||||||||||||||||||||||||||||||||||||||||||||||||||||||||||||||||||||||||||||||||||||||||||||||||||||||||||||||||||||||||||
36 88 56 94 48 90 32 73 44 68 39 80 34 86 41 86 50 91 39 79 62 96 52 92 37 72 50 96 41 70 55 86 41 87 56 88 39 79 52 90 46 95 44 85 41 90 50 115 50 84 44 79 52 94 54 97 44 86 52 111 37 87 52 98 50 87 36 68 50 88 52 82 55 111 31 75 36 94 49 95 42 80 37 95 41 68 30 94 52 88 30 84 44 101 66 98 48 78 43 109 57 102 46 81 54 97 48 75 48 97 62 101 58 101 58 95 62 95 46 95 34 90 66 107 52 92 55 86 55 70 57 95 56 96 55 91 56 87 54 92 55 97 46 102 52 91 32 68 44 88 46 97 59 90 46 101 46 94 54 101 66 109 56 100 59 103 57 94 52 97 48 85 44 75 41 77 50 87 48 78 48 108 59 97 34 105 46 106 54 107 55 95 54 107 59 115 44 101 54 85 52 90 66 115 44 95 57 97 39 112 60 97 45 77 41 90 50 94 39 103 43 77 48 98 37 90 58 111 46 77 43 88 44 75 34 92 30 78 50 106 39 80 37 87 55 92 41 111 39 86 36 85 43 90 50 101 55 94 43 86 60 86 48 90 30 75 43 86 39 91 52 97 39 91 39 70 56 98 59 96 46 95 57 100 50 95 54 97 50 97 60 92 59 115 41 88 48 87 59 100 60 98 56 102 51 96 | |||||||||||||||||||||||||||||||||||||||||||||||||||||||||||||||||||||||||||||||||||||||||||||||||||||||||||||||||||||||||||||||||||
Tables (Output of Computation) | |||||||||||||||||||||||||||||||||||||||||||||||||||||||||||||||||||||||||||||||||||||||||||||||||||||||||||||||||||||||||||||||||||
| |||||||||||||||||||||||||||||||||||||||||||||||||||||||||||||||||||||||||||||||||||||||||||||||||||||||||||||||||||||||||||||||||||
Figures (Output of Computation) | |||||||||||||||||||||||||||||||||||||||||||||||||||||||||||||||||||||||||||||||||||||||||||||||||||||||||||||||||||||||||||||||||||
Input Parameters & R Code | |||||||||||||||||||||||||||||||||||||||||||||||||||||||||||||||||||||||||||||||||||||||||||||||||||||||||||||||||||||||||||||||||||
| Parameters (Session): | |||||||||||||||||||||||||||||||||||||||||||||||||||||||||||||||||||||||||||||||||||||||||||||||||||||||||||||||||||||||||||||||||||
| Parameters (R input): | |||||||||||||||||||||||||||||||||||||||||||||||||||||||||||||||||||||||||||||||||||||||||||||||||||||||||||||||||||||||||||||||||||
| par1 = ; par2 = TRUE ; par3 = ; | |||||||||||||||||||||||||||||||||||||||||||||||||||||||||||||||||||||||||||||||||||||||||||||||||||||||||||||||||||||||||||||||||||
| R code (references can be found in the software module): | |||||||||||||||||||||||||||||||||||||||||||||||||||||||||||||||||||||||||||||||||||||||||||||||||||||||||||||||||||||||||||||||||||
par3 <- '0' | |||||||||||||||||||||||||||||||||||||||||||||||||||||||||||||||||||||||||||||||||||||||||||||||||||||||||||||||||||||||||||||||||||