Free Statistics

of Irreproducible Research!

Author's title

Author*Unverified author*
R Software Modulerwasp_autocorrelation.wasp
Title produced by software(Partial) Autocorrelation Function
Date of computationMon, 29 Dec 2014 09:28:02 +0000
Cite this page as followsStatistical Computations at FreeStatistics.org, Office for Research Development and Education, URL https://freestatistics.org/blog/index.php?v=date/2014/Dec/29/t1419845319psb44kqy5qq25pj.htm/, Retrieved Thu, 16 May 2024 21:07:23 +0000
Statistical Computations at FreeStatistics.org, Office for Research Development and Education, URL https://freestatistics.org/blog/index.php?pk=271642, Retrieved Thu, 16 May 2024 21:07:23 +0000
QR Codes:

Original text written by user:
IsPrivate?No (this computation is public)
User-defined keywords
Estimated Impact110
Family? (F = Feedback message, R = changed R code, M = changed R Module, P = changed Parameters, D = changed Data)
-     [Mean Plot] [] [2014-10-10 11:30:26] [646b2e45c853a5eeaa778aa28018f97d]
-    D  [Mean Plot] [] [2014-10-16 12:57:54] [646b2e45c853a5eeaa778aa28018f97d]
- R       [Mean Plot] [] [2014-12-29 09:22:07] [e39bbdb9244073fc72a45a9289b4fb1d]
- RMPD        [(Partial) Autocorrelation Function] [] [2014-12-29 09:28:02] [6bc6bd52ef4ec9e5c067ef01cf67dcff] [Current]
Feedback Forum

Post a new message
Dataseries X:
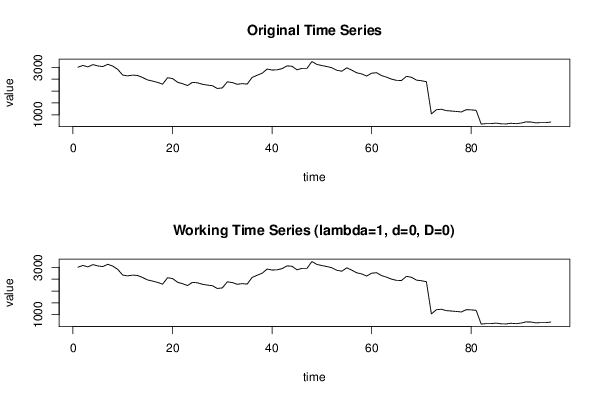
3004
3080
3017
3114
3057
3032
3127
3050
2910
2671
2638
2672
2654
2568
2467
2419
2363
2291
2560
2527
2370
2310
2231
2367
2346
2286
2249
2226
2108
2131
2387
2358
2284
2312
2293
2576
2665
2749
2926
2886
2893
2944
3060
3045
2894
2955
2954
3243
3120
3074
3034
2981
2876
2835
2978
2881
2768
2722
2630
2753
2771
2652
2584
2501
2449
2445
2620
2579
2460
2434
2392
1037
1212
1232
1174
1158
1140
1118
1212
1207
1186
608
627
626
649
619
612
643
623
649
699
693
659
669
668
693


Summary of computational transaction
Raw Inputview raw input (R code)
Raw Outputview raw output of R engine
Computing time2 seconds
R Server'George Udny Yule' @ yule.wessa.net

\begin{tabular}{lllllllll}
\hline
Summary of computational transaction \tabularnewline
Raw Input & view raw input (R code)  \tabularnewline
Raw Output & view raw output of R engine  \tabularnewline
Computing time & 2 seconds \tabularnewline
R Server & 'George Udny Yule' @ yule.wessa.net \tabularnewline
\hline
\end{tabular}
%Source: https://freestatistics.org/blog/index.php?pk=271642&T=0

[TABLE]
[ROW][C]Summary of computational transaction[/C][/ROW]
[ROW][C]Raw Input[/C][C]view raw input (R code) [/C][/ROW]
[ROW][C]Raw Output[/C][C]view raw output of R engine [/C][/ROW]
[ROW][C]Computing time[/C][C]2 seconds[/C][/ROW]
[ROW][C]R Server[/C][C]'George Udny Yule' @ yule.wessa.net[/C][/ROW]
[/TABLE]
Source: https://freestatistics.org/blog/index.php?pk=271642&T=0

Globally Unique Identifier (entire table): ba.freestatistics.org/blog/index.php?pk=271642&T=0

As an alternative you can also use a QR Code:  

The GUIDs for individual cells are displayed in the table below:

Summary of computational transaction
Raw Inputview raw input (R code)
Raw Outputview raw output of R engine
Computing time2 seconds
R Server'George Udny Yule' @ yule.wessa.net


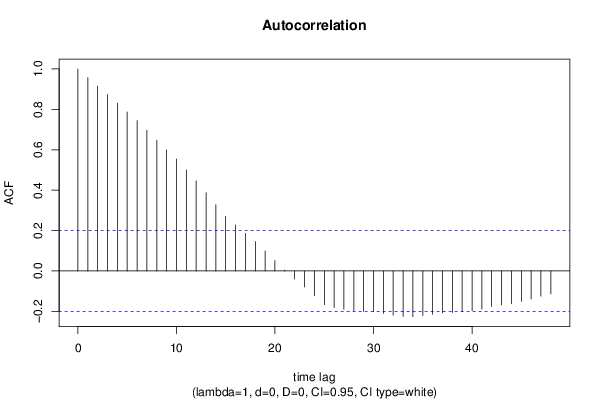
Autocorrelation Function
Time lag kACF(k)T-STATP-value
10.9569129.37580
20.9142268.95750
30.873668.56010
40.8300578.13290
50.7870017.7110
60.7442967.29260
70.6968826.8280
80.6472326.34160
90.5988615.86760
100.5546975.43490
110.5001024.92e-06
120.4462154.3721.6e-05
130.3875933.79760.000128
140.3279923.21370.000893
150.2709392.65460.004647
160.227722.23120.013998
170.1863311.82570.035505
180.1462771.43320.077523
190.0997850.97770.165344
200.0513630.50330.30797
210.0041450.04060.483846
22-0.039854-0.39050.348521
23-0.078759-0.77170.221101
24-0.121954-1.19490.117536
25-0.166428-1.63070.053119
26-0.18055-1.7690.040033
27-0.189226-1.8540.033403
28-0.197138-1.93160.028182
29-0.199865-1.95830.02655
30-0.201646-1.97570.025529
31-0.209762-2.05520.021286
32-0.218328-2.13920.017479
33-0.225253-2.2070.014848
34-0.226018-2.21450.01458
35-0.219969-2.15520.016822
36-0.21411-2.09780.019273
37-0.206957-2.02780.022678
38-0.205873-2.01710.023237
39-0.201722-1.97650.025486
40-0.196101-1.92140.028824
41-0.188007-1.84210.034275
42-0.174706-1.71180.045085
43-0.167593-1.64210.051924
44-0.161442-1.58180.058492
45-0.151283-1.48230.070772
46-0.139093-1.36280.088063
47-0.124657-1.22140.112466
48-0.113512-1.11220.134418

\begin{tabular}{lllllllll}
\hline
Autocorrelation Function \tabularnewline
Time lag k & ACF(k) & T-STAT & P-value \tabularnewline
1 & 0.956912 & 9.3758 & 0 \tabularnewline
2 & 0.914226 & 8.9575 & 0 \tabularnewline
3 & 0.87366 & 8.5601 & 0 \tabularnewline
4 & 0.830057 & 8.1329 & 0 \tabularnewline
5 & 0.787001 & 7.711 & 0 \tabularnewline
6 & 0.744296 & 7.2926 & 0 \tabularnewline
7 & 0.696882 & 6.828 & 0 \tabularnewline
8 & 0.647232 & 6.3416 & 0 \tabularnewline
9 & 0.598861 & 5.8676 & 0 \tabularnewline
10 & 0.554697 & 5.4349 & 0 \tabularnewline
11 & 0.500102 & 4.9 & 2e-06 \tabularnewline
12 & 0.446215 & 4.372 & 1.6e-05 \tabularnewline
13 & 0.387593 & 3.7976 & 0.000128 \tabularnewline
14 & 0.327992 & 3.2137 & 0.000893 \tabularnewline
15 & 0.270939 & 2.6546 & 0.004647 \tabularnewline
16 & 0.22772 & 2.2312 & 0.013998 \tabularnewline
17 & 0.186331 & 1.8257 & 0.035505 \tabularnewline
18 & 0.146277 & 1.4332 & 0.077523 \tabularnewline
19 & 0.099785 & 0.9777 & 0.165344 \tabularnewline
20 & 0.051363 & 0.5033 & 0.30797 \tabularnewline
21 & 0.004145 & 0.0406 & 0.483846 \tabularnewline
22 & -0.039854 & -0.3905 & 0.348521 \tabularnewline
23 & -0.078759 & -0.7717 & 0.221101 \tabularnewline
24 & -0.121954 & -1.1949 & 0.117536 \tabularnewline
25 & -0.166428 & -1.6307 & 0.053119 \tabularnewline
26 & -0.18055 & -1.769 & 0.040033 \tabularnewline
27 & -0.189226 & -1.854 & 0.033403 \tabularnewline
28 & -0.197138 & -1.9316 & 0.028182 \tabularnewline
29 & -0.199865 & -1.9583 & 0.02655 \tabularnewline
30 & -0.201646 & -1.9757 & 0.025529 \tabularnewline
31 & -0.209762 & -2.0552 & 0.021286 \tabularnewline
32 & -0.218328 & -2.1392 & 0.017479 \tabularnewline
33 & -0.225253 & -2.207 & 0.014848 \tabularnewline
34 & -0.226018 & -2.2145 & 0.01458 \tabularnewline
35 & -0.219969 & -2.1552 & 0.016822 \tabularnewline
36 & -0.21411 & -2.0978 & 0.019273 \tabularnewline
37 & -0.206957 & -2.0278 & 0.022678 \tabularnewline
38 & -0.205873 & -2.0171 & 0.023237 \tabularnewline
39 & -0.201722 & -1.9765 & 0.025486 \tabularnewline
40 & -0.196101 & -1.9214 & 0.028824 \tabularnewline
41 & -0.188007 & -1.8421 & 0.034275 \tabularnewline
42 & -0.174706 & -1.7118 & 0.045085 \tabularnewline
43 & -0.167593 & -1.6421 & 0.051924 \tabularnewline
44 & -0.161442 & -1.5818 & 0.058492 \tabularnewline
45 & -0.151283 & -1.4823 & 0.070772 \tabularnewline
46 & -0.139093 & -1.3628 & 0.088063 \tabularnewline
47 & -0.124657 & -1.2214 & 0.112466 \tabularnewline
48 & -0.113512 & -1.1122 & 0.134418 \tabularnewline
\hline
\end{tabular}
%Source: https://freestatistics.org/blog/index.php?pk=271642&T=1

[TABLE]
[ROW][C]Autocorrelation Function[/C][/ROW]
[ROW][C]Time lag k[/C][C]ACF(k)[/C][C]T-STAT[/C][C]P-value[/C][/ROW]
[ROW][C]1[/C][C]0.956912[/C][C]9.3758[/C][C]0[/C][/ROW]
[ROW][C]2[/C][C]0.914226[/C][C]8.9575[/C][C]0[/C][/ROW]
[ROW][C]3[/C][C]0.87366[/C][C]8.5601[/C][C]0[/C][/ROW]
[ROW][C]4[/C][C]0.830057[/C][C]8.1329[/C][C]0[/C][/ROW]
[ROW][C]5[/C][C]0.787001[/C][C]7.711[/C][C]0[/C][/ROW]
[ROW][C]6[/C][C]0.744296[/C][C]7.2926[/C][C]0[/C][/ROW]
[ROW][C]7[/C][C]0.696882[/C][C]6.828[/C][C]0[/C][/ROW]
[ROW][C]8[/C][C]0.647232[/C][C]6.3416[/C][C]0[/C][/ROW]
[ROW][C]9[/C][C]0.598861[/C][C]5.8676[/C][C]0[/C][/ROW]
[ROW][C]10[/C][C]0.554697[/C][C]5.4349[/C][C]0[/C][/ROW]
[ROW][C]11[/C][C]0.500102[/C][C]4.9[/C][C]2e-06[/C][/ROW]
[ROW][C]12[/C][C]0.446215[/C][C]4.372[/C][C]1.6e-05[/C][/ROW]
[ROW][C]13[/C][C]0.387593[/C][C]3.7976[/C][C]0.000128[/C][/ROW]
[ROW][C]14[/C][C]0.327992[/C][C]3.2137[/C][C]0.000893[/C][/ROW]
[ROW][C]15[/C][C]0.270939[/C][C]2.6546[/C][C]0.004647[/C][/ROW]
[ROW][C]16[/C][C]0.22772[/C][C]2.2312[/C][C]0.013998[/C][/ROW]
[ROW][C]17[/C][C]0.186331[/C][C]1.8257[/C][C]0.035505[/C][/ROW]
[ROW][C]18[/C][C]0.146277[/C][C]1.4332[/C][C]0.077523[/C][/ROW]
[ROW][C]19[/C][C]0.099785[/C][C]0.9777[/C][C]0.165344[/C][/ROW]
[ROW][C]20[/C][C]0.051363[/C][C]0.5033[/C][C]0.30797[/C][/ROW]
[ROW][C]21[/C][C]0.004145[/C][C]0.0406[/C][C]0.483846[/C][/ROW]
[ROW][C]22[/C][C]-0.039854[/C][C]-0.3905[/C][C]0.348521[/C][/ROW]
[ROW][C]23[/C][C]-0.078759[/C][C]-0.7717[/C][C]0.221101[/C][/ROW]
[ROW][C]24[/C][C]-0.121954[/C][C]-1.1949[/C][C]0.117536[/C][/ROW]
[ROW][C]25[/C][C]-0.166428[/C][C]-1.6307[/C][C]0.053119[/C][/ROW]
[ROW][C]26[/C][C]-0.18055[/C][C]-1.769[/C][C]0.040033[/C][/ROW]
[ROW][C]27[/C][C]-0.189226[/C][C]-1.854[/C][C]0.033403[/C][/ROW]
[ROW][C]28[/C][C]-0.197138[/C][C]-1.9316[/C][C]0.028182[/C][/ROW]
[ROW][C]29[/C][C]-0.199865[/C][C]-1.9583[/C][C]0.02655[/C][/ROW]
[ROW][C]30[/C][C]-0.201646[/C][C]-1.9757[/C][C]0.025529[/C][/ROW]
[ROW][C]31[/C][C]-0.209762[/C][C]-2.0552[/C][C]0.021286[/C][/ROW]
[ROW][C]32[/C][C]-0.218328[/C][C]-2.1392[/C][C]0.017479[/C][/ROW]
[ROW][C]33[/C][C]-0.225253[/C][C]-2.207[/C][C]0.014848[/C][/ROW]
[ROW][C]34[/C][C]-0.226018[/C][C]-2.2145[/C][C]0.01458[/C][/ROW]
[ROW][C]35[/C][C]-0.219969[/C][C]-2.1552[/C][C]0.016822[/C][/ROW]
[ROW][C]36[/C][C]-0.21411[/C][C]-2.0978[/C][C]0.019273[/C][/ROW]
[ROW][C]37[/C][C]-0.206957[/C][C]-2.0278[/C][C]0.022678[/C][/ROW]
[ROW][C]38[/C][C]-0.205873[/C][C]-2.0171[/C][C]0.023237[/C][/ROW]
[ROW][C]39[/C][C]-0.201722[/C][C]-1.9765[/C][C]0.025486[/C][/ROW]
[ROW][C]40[/C][C]-0.196101[/C][C]-1.9214[/C][C]0.028824[/C][/ROW]
[ROW][C]41[/C][C]-0.188007[/C][C]-1.8421[/C][C]0.034275[/C][/ROW]
[ROW][C]42[/C][C]-0.174706[/C][C]-1.7118[/C][C]0.045085[/C][/ROW]
[ROW][C]43[/C][C]-0.167593[/C][C]-1.6421[/C][C]0.051924[/C][/ROW]
[ROW][C]44[/C][C]-0.161442[/C][C]-1.5818[/C][C]0.058492[/C][/ROW]
[ROW][C]45[/C][C]-0.151283[/C][C]-1.4823[/C][C]0.070772[/C][/ROW]
[ROW][C]46[/C][C]-0.139093[/C][C]-1.3628[/C][C]0.088063[/C][/ROW]
[ROW][C]47[/C][C]-0.124657[/C][C]-1.2214[/C][C]0.112466[/C][/ROW]
[ROW][C]48[/C][C]-0.113512[/C][C]-1.1122[/C][C]0.134418[/C][/ROW]
[/TABLE]
Source: https://freestatistics.org/blog/index.php?pk=271642&T=1

Globally Unique Identifier (entire table): ba.freestatistics.org/blog/index.php?pk=271642&T=1

As an alternative you can also use a QR Code:  

The GUIDs for individual cells are displayed in the table below:

Autocorrelation Function
Time lag kACF(k)T-STATP-value
10.9569129.37580
20.9142268.95750
30.873668.56010
40.8300578.13290
50.7870017.7110
60.7442967.29260
70.6968826.8280
80.6472326.34160
90.5988615.86760
100.5546975.43490
110.5001024.92e-06
120.4462154.3721.6e-05
130.3875933.79760.000128
140.3279923.21370.000893
150.2709392.65460.004647
160.227722.23120.013998
170.1863311.82570.035505
180.1462771.43320.077523
190.0997850.97770.165344
200.0513630.50330.30797
210.0041450.04060.483846
22-0.039854-0.39050.348521
23-0.078759-0.77170.221101
24-0.121954-1.19490.117536
25-0.166428-1.63070.053119
26-0.18055-1.7690.040033
27-0.189226-1.8540.033403
28-0.197138-1.93160.028182
29-0.199865-1.95830.02655
30-0.201646-1.97570.025529
31-0.209762-2.05520.021286
32-0.218328-2.13920.017479
33-0.225253-2.2070.014848
34-0.226018-2.21450.01458
35-0.219969-2.15520.016822
36-0.21411-2.09780.019273
37-0.206957-2.02780.022678
38-0.205873-2.01710.023237
39-0.201722-1.97650.025486
40-0.196101-1.92140.028824
41-0.188007-1.84210.034275
42-0.174706-1.71180.045085
43-0.167593-1.64210.051924
44-0.161442-1.58180.058492
45-0.151283-1.48230.070772
46-0.139093-1.36280.088063
47-0.124657-1.22140.112466
48-0.113512-1.11220.134418


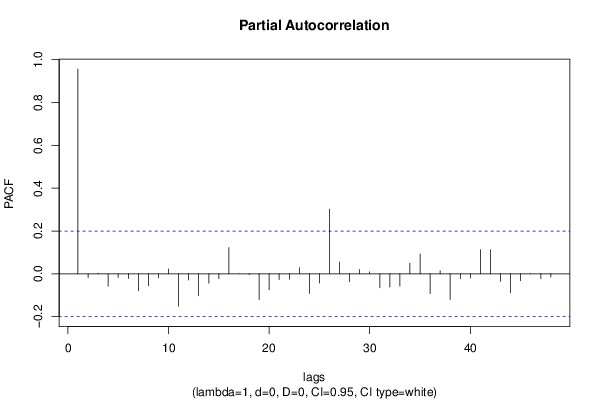
Partial Autocorrelation Function
Time lag kPACF(k)T-STATP-value
10.9569129.37580
2-0.017261-0.16910.433027
30.0028810.02820.48877
4-0.05748-0.56320.287311
5-0.017003-0.16660.43402
6-0.021609-0.21170.416386
7-0.079017-0.77420.220356
8-0.055571-0.54450.293686
9-0.01827-0.1790.429155
100.0225540.2210.412788
11-0.151652-1.48590.070294
12-0.028628-0.28050.389852
13-0.102808-1.00730.15816
14-0.044268-0.43370.332727
15-0.022424-0.21970.413284
160.122351.19880.116782
170.0001180.00120.499541
18-0.003537-0.03470.486212
19-0.120283-1.17850.12075
20-0.074573-0.73070.233382
21-0.026791-0.26250.396752
22-0.025097-0.24590.403143
230.028130.27560.391716
24-0.091886-0.90030.185109
25-0.04324-0.42370.33638
260.3015772.95480.001968
270.0548830.53770.295999
28-0.036432-0.3570.360955
290.0205970.20180.420247
300.0089910.08810.464995
31-0.065208-0.63890.262202
32-0.061572-0.60330.273872
33-0.0573-0.56140.287907
340.0498270.48820.313258
350.0925920.90720.183283
36-0.092012-0.90150.184781
370.014450.14160.443853
38-0.120323-1.17890.120672
39-0.022655-0.2220.412404
40-0.019911-0.19510.422868
410.113021.10740.135451
420.1120961.09830.137407
43-0.03588-0.35150.362975
44-0.088198-0.86420.194826
45-0.032169-0.31520.376652
46-8.6e-05-8e-040.499667
47-0.022509-0.22050.412957
48-0.014572-0.14280.443385

\begin{tabular}{lllllllll}
\hline
Partial Autocorrelation Function \tabularnewline
Time lag k & PACF(k) & T-STAT & P-value \tabularnewline
1 & 0.956912 & 9.3758 & 0 \tabularnewline
2 & -0.017261 & -0.1691 & 0.433027 \tabularnewline
3 & 0.002881 & 0.0282 & 0.48877 \tabularnewline
4 & -0.05748 & -0.5632 & 0.287311 \tabularnewline
5 & -0.017003 & -0.1666 & 0.43402 \tabularnewline
6 & -0.021609 & -0.2117 & 0.416386 \tabularnewline
7 & -0.079017 & -0.7742 & 0.220356 \tabularnewline
8 & -0.055571 & -0.5445 & 0.293686 \tabularnewline
9 & -0.01827 & -0.179 & 0.429155 \tabularnewline
10 & 0.022554 & 0.221 & 0.412788 \tabularnewline
11 & -0.151652 & -1.4859 & 0.070294 \tabularnewline
12 & -0.028628 & -0.2805 & 0.389852 \tabularnewline
13 & -0.102808 & -1.0073 & 0.15816 \tabularnewline
14 & -0.044268 & -0.4337 & 0.332727 \tabularnewline
15 & -0.022424 & -0.2197 & 0.413284 \tabularnewline
16 & 0.12235 & 1.1988 & 0.116782 \tabularnewline
17 & 0.000118 & 0.0012 & 0.499541 \tabularnewline
18 & -0.003537 & -0.0347 & 0.486212 \tabularnewline
19 & -0.120283 & -1.1785 & 0.12075 \tabularnewline
20 & -0.074573 & -0.7307 & 0.233382 \tabularnewline
21 & -0.026791 & -0.2625 & 0.396752 \tabularnewline
22 & -0.025097 & -0.2459 & 0.403143 \tabularnewline
23 & 0.02813 & 0.2756 & 0.391716 \tabularnewline
24 & -0.091886 & -0.9003 & 0.185109 \tabularnewline
25 & -0.04324 & -0.4237 & 0.33638 \tabularnewline
26 & 0.301577 & 2.9548 & 0.001968 \tabularnewline
27 & 0.054883 & 0.5377 & 0.295999 \tabularnewline
28 & -0.036432 & -0.357 & 0.360955 \tabularnewline
29 & 0.020597 & 0.2018 & 0.420247 \tabularnewline
30 & 0.008991 & 0.0881 & 0.464995 \tabularnewline
31 & -0.065208 & -0.6389 & 0.262202 \tabularnewline
32 & -0.061572 & -0.6033 & 0.273872 \tabularnewline
33 & -0.0573 & -0.5614 & 0.287907 \tabularnewline
34 & 0.049827 & 0.4882 & 0.313258 \tabularnewline
35 & 0.092592 & 0.9072 & 0.183283 \tabularnewline
36 & -0.092012 & -0.9015 & 0.184781 \tabularnewline
37 & 0.01445 & 0.1416 & 0.443853 \tabularnewline
38 & -0.120323 & -1.1789 & 0.120672 \tabularnewline
39 & -0.022655 & -0.222 & 0.412404 \tabularnewline
40 & -0.019911 & -0.1951 & 0.422868 \tabularnewline
41 & 0.11302 & 1.1074 & 0.135451 \tabularnewline
42 & 0.112096 & 1.0983 & 0.137407 \tabularnewline
43 & -0.03588 & -0.3515 & 0.362975 \tabularnewline
44 & -0.088198 & -0.8642 & 0.194826 \tabularnewline
45 & -0.032169 & -0.3152 & 0.376652 \tabularnewline
46 & -8.6e-05 & -8e-04 & 0.499667 \tabularnewline
47 & -0.022509 & -0.2205 & 0.412957 \tabularnewline
48 & -0.014572 & -0.1428 & 0.443385 \tabularnewline
\hline
\end{tabular}
%Source: https://freestatistics.org/blog/index.php?pk=271642&T=2

[TABLE]
[ROW][C]Partial Autocorrelation Function[/C][/ROW]
[ROW][C]Time lag k[/C][C]PACF(k)[/C][C]T-STAT[/C][C]P-value[/C][/ROW]
[ROW][C]1[/C][C]0.956912[/C][C]9.3758[/C][C]0[/C][/ROW]
[ROW][C]2[/C][C]-0.017261[/C][C]-0.1691[/C][C]0.433027[/C][/ROW]
[ROW][C]3[/C][C]0.002881[/C][C]0.0282[/C][C]0.48877[/C][/ROW]
[ROW][C]4[/C][C]-0.05748[/C][C]-0.5632[/C][C]0.287311[/C][/ROW]
[ROW][C]5[/C][C]-0.017003[/C][C]-0.1666[/C][C]0.43402[/C][/ROW]
[ROW][C]6[/C][C]-0.021609[/C][C]-0.2117[/C][C]0.416386[/C][/ROW]
[ROW][C]7[/C][C]-0.079017[/C][C]-0.7742[/C][C]0.220356[/C][/ROW]
[ROW][C]8[/C][C]-0.055571[/C][C]-0.5445[/C][C]0.293686[/C][/ROW]
[ROW][C]9[/C][C]-0.01827[/C][C]-0.179[/C][C]0.429155[/C][/ROW]
[ROW][C]10[/C][C]0.022554[/C][C]0.221[/C][C]0.412788[/C][/ROW]
[ROW][C]11[/C][C]-0.151652[/C][C]-1.4859[/C][C]0.070294[/C][/ROW]
[ROW][C]12[/C][C]-0.028628[/C][C]-0.2805[/C][C]0.389852[/C][/ROW]
[ROW][C]13[/C][C]-0.102808[/C][C]-1.0073[/C][C]0.15816[/C][/ROW]
[ROW][C]14[/C][C]-0.044268[/C][C]-0.4337[/C][C]0.332727[/C][/ROW]
[ROW][C]15[/C][C]-0.022424[/C][C]-0.2197[/C][C]0.413284[/C][/ROW]
[ROW][C]16[/C][C]0.12235[/C][C]1.1988[/C][C]0.116782[/C][/ROW]
[ROW][C]17[/C][C]0.000118[/C][C]0.0012[/C][C]0.499541[/C][/ROW]
[ROW][C]18[/C][C]-0.003537[/C][C]-0.0347[/C][C]0.486212[/C][/ROW]
[ROW][C]19[/C][C]-0.120283[/C][C]-1.1785[/C][C]0.12075[/C][/ROW]
[ROW][C]20[/C][C]-0.074573[/C][C]-0.7307[/C][C]0.233382[/C][/ROW]
[ROW][C]21[/C][C]-0.026791[/C][C]-0.2625[/C][C]0.396752[/C][/ROW]
[ROW][C]22[/C][C]-0.025097[/C][C]-0.2459[/C][C]0.403143[/C][/ROW]
[ROW][C]23[/C][C]0.02813[/C][C]0.2756[/C][C]0.391716[/C][/ROW]
[ROW][C]24[/C][C]-0.091886[/C][C]-0.9003[/C][C]0.185109[/C][/ROW]
[ROW][C]25[/C][C]-0.04324[/C][C]-0.4237[/C][C]0.33638[/C][/ROW]
[ROW][C]26[/C][C]0.301577[/C][C]2.9548[/C][C]0.001968[/C][/ROW]
[ROW][C]27[/C][C]0.054883[/C][C]0.5377[/C][C]0.295999[/C][/ROW]
[ROW][C]28[/C][C]-0.036432[/C][C]-0.357[/C][C]0.360955[/C][/ROW]
[ROW][C]29[/C][C]0.020597[/C][C]0.2018[/C][C]0.420247[/C][/ROW]
[ROW][C]30[/C][C]0.008991[/C][C]0.0881[/C][C]0.464995[/C][/ROW]
[ROW][C]31[/C][C]-0.065208[/C][C]-0.6389[/C][C]0.262202[/C][/ROW]
[ROW][C]32[/C][C]-0.061572[/C][C]-0.6033[/C][C]0.273872[/C][/ROW]
[ROW][C]33[/C][C]-0.0573[/C][C]-0.5614[/C][C]0.287907[/C][/ROW]
[ROW][C]34[/C][C]0.049827[/C][C]0.4882[/C][C]0.313258[/C][/ROW]
[ROW][C]35[/C][C]0.092592[/C][C]0.9072[/C][C]0.183283[/C][/ROW]
[ROW][C]36[/C][C]-0.092012[/C][C]-0.9015[/C][C]0.184781[/C][/ROW]
[ROW][C]37[/C][C]0.01445[/C][C]0.1416[/C][C]0.443853[/C][/ROW]
[ROW][C]38[/C][C]-0.120323[/C][C]-1.1789[/C][C]0.120672[/C][/ROW]
[ROW][C]39[/C][C]-0.022655[/C][C]-0.222[/C][C]0.412404[/C][/ROW]
[ROW][C]40[/C][C]-0.019911[/C][C]-0.1951[/C][C]0.422868[/C][/ROW]
[ROW][C]41[/C][C]0.11302[/C][C]1.1074[/C][C]0.135451[/C][/ROW]
[ROW][C]42[/C][C]0.112096[/C][C]1.0983[/C][C]0.137407[/C][/ROW]
[ROW][C]43[/C][C]-0.03588[/C][C]-0.3515[/C][C]0.362975[/C][/ROW]
[ROW][C]44[/C][C]-0.088198[/C][C]-0.8642[/C][C]0.194826[/C][/ROW]
[ROW][C]45[/C][C]-0.032169[/C][C]-0.3152[/C][C]0.376652[/C][/ROW]
[ROW][C]46[/C][C]-8.6e-05[/C][C]-8e-04[/C][C]0.499667[/C][/ROW]
[ROW][C]47[/C][C]-0.022509[/C][C]-0.2205[/C][C]0.412957[/C][/ROW]
[ROW][C]48[/C][C]-0.014572[/C][C]-0.1428[/C][C]0.443385[/C][/ROW]
[/TABLE]
Source: https://freestatistics.org/blog/index.php?pk=271642&T=2

Globally Unique Identifier (entire table): ba.freestatistics.org/blog/index.php?pk=271642&T=2

As an alternative you can also use a QR Code:  

The GUIDs for individual cells are displayed in the table below:

Partial Autocorrelation Function
Time lag kPACF(k)T-STATP-value
10.9569129.37580
2-0.017261-0.16910.433027
30.0028810.02820.48877
4-0.05748-0.56320.287311
5-0.017003-0.16660.43402
6-0.021609-0.21170.416386
7-0.079017-0.77420.220356
8-0.055571-0.54450.293686
9-0.01827-0.1790.429155
100.0225540.2210.412788
11-0.151652-1.48590.070294
12-0.028628-0.28050.389852
13-0.102808-1.00730.15816
14-0.044268-0.43370.332727
15-0.022424-0.21970.413284
160.122351.19880.116782
170.0001180.00120.499541
18-0.003537-0.03470.486212
19-0.120283-1.17850.12075
20-0.074573-0.73070.233382
21-0.026791-0.26250.396752
22-0.025097-0.24590.403143
230.028130.27560.391716
24-0.091886-0.90030.185109
25-0.04324-0.42370.33638
260.3015772.95480.001968
270.0548830.53770.295999
28-0.036432-0.3570.360955
290.0205970.20180.420247
300.0089910.08810.464995
31-0.065208-0.63890.262202
32-0.061572-0.60330.273872
33-0.0573-0.56140.287907
340.0498270.48820.313258
350.0925920.90720.183283
36-0.092012-0.90150.184781
370.014450.14160.443853
38-0.120323-1.17890.120672
39-0.022655-0.2220.412404
40-0.019911-0.19510.422868
410.113021.10740.135451
420.1120961.09830.137407
43-0.03588-0.35150.362975
44-0.088198-0.86420.194826
45-0.032169-0.31520.376652
46-8.6e-05-8e-040.499667
47-0.022509-0.22050.412957
48-0.014572-0.14280.443385


Parameters (Session):
par1 = 48 ; par2 = 1 ; par3 = 0 ; par4 = 0 ; par5 = 12 ; par6 = White Noise ; par7 = 0.95 ;
Parameters (R input):
par1 = 48 ; par2 = 1 ; par3 = 0 ; par4 = 0 ; par5 = 12 ; par6 = White Noise ; par7 = 0.95 ; par8 = ;
R code (references can be found in the software module):
if (par1 == 'Default') {
par1 = 10*log10(length(x))
} else {
par1 <- as.numeric(par1)
}
par2 <- as.numeric(par2)
par3 <- as.numeric(par3)
par4 <- as.numeric(par4)
par5 <- as.numeric(par5)
if (par6 == 'White Noise') par6 <- 'white' else par6 <- 'ma'
par7 <- as.numeric(par7)
if (par8 != '') par8 <- as.numeric(par8)
ox <- x
if (par8 == '') {
if (par2 == 0) {
x <- log(x)
} else {
x <- (x ^ par2 - 1) / par2
}
} else {
x <- log(x,base=par8)
}
if (par3 > 0) x <- diff(x,lag=1,difference=par3)
if (par4 > 0) x <- diff(x,lag=par5,difference=par4)
bitmap(file='picts.png')
op <- par(mfrow=c(2,1))
plot(ox,type='l',main='Original Time Series',xlab='time',ylab='value')
if (par8=='') {
mytitle <- paste('Working Time Series (lambda=',par2,', d=',par3,', D=',par4,')',sep='')
mysub <- paste('(lambda=',par2,', d=',par3,', D=',par4,', CI=', par7, ', CI type=',par6,')',sep='')
} else {
mytitle <- paste('Working Time Series (base=',par8,', d=',par3,', D=',par4,')',sep='')
mysub <- paste('(base=',par8,', d=',par3,', D=',par4,', CI=', par7, ', CI type=',par6,')',sep='')
}
plot(x,type='l', main=mytitle,xlab='time',ylab='value')
par(op)
dev.off()
bitmap(file='pic1.png')
racf <- acf(x, par1, main='Autocorrelation', xlab='time lag', ylab='ACF', ci.type=par6, ci=par7, sub=mysub)
dev.off()
bitmap(file='pic2.png')
rpacf <- pacf(x,par1,main='Partial Autocorrelation',xlab='lags',ylab='PACF',sub=mysub)
dev.off()
(myacf <- c(racf$acf))
(mypacf <- c(rpacf$acf))
lengthx <- length(x)
sqrtn <- sqrt(lengthx)
load(file='createtable')
a<-table.start()
a<-table.row.start(a)
a<-table.element(a,'Autocorrelation Function',4,TRUE)
a<-table.row.end(a)
a<-table.row.start(a)
a<-table.element(a,'Time lag k',header=TRUE)
a<-table.element(a,hyperlink('basics.htm','ACF(k)','click here for more information about the Autocorrelation Function'),header=TRUE)
a<-table.element(a,'T-STAT',header=TRUE)
a<-table.element(a,'P-value',header=TRUE)
a<-table.row.end(a)
for (i in 2:(par1+1)) {
a<-table.row.start(a)
a<-table.element(a,i-1,header=TRUE)
a<-table.element(a,round(myacf[i],6))
mytstat <- myacf[i]*sqrtn
a<-table.element(a,round(mytstat,4))
a<-table.element(a,round(1-pt(abs(mytstat),lengthx),6))
a<-table.row.end(a)
}
a<-table.end(a)
table.save(a,file='mytable.tab')
a<-table.start()
a<-table.row.start(a)
a<-table.element(a,'Partial Autocorrelation Function',4,TRUE)
a<-table.row.end(a)
a<-table.row.start(a)
a<-table.element(a,'Time lag k',header=TRUE)
a<-table.element(a,hyperlink('basics.htm','PACF(k)','click here for more information about the Partial Autocorrelation Function'),header=TRUE)
a<-table.element(a,'T-STAT',header=TRUE)
a<-table.element(a,'P-value',header=TRUE)
a<-table.row.end(a)
for (i in 1:par1) {
a<-table.row.start(a)
a<-table.element(a,i,header=TRUE)
a<-table.element(a,round(mypacf[i],6))
mytstat <- mypacf[i]*sqrtn
a<-table.element(a,round(mytstat,4))
a<-table.element(a,round(1-pt(abs(mytstat),lengthx),6))
a<-table.row.end(a)
}
a<-table.end(a)
table.save(a,file='mytable1.tab')