Free Statistics

of Irreproducible Research!

Author's title

Author*Unverified author*
R Software Modulerwasp_exponentialsmoothing.wasp
Title produced by softwareExponential Smoothing
Date of computationMon, 29 Dec 2014 09:58:12 +0000
Cite this page as followsStatistical Computations at FreeStatistics.org, Office for Research Development and Education, URL https://freestatistics.org/blog/index.php?v=date/2014/Dec/29/t1419847136x4k4y4c6g4r22ff.htm/, Retrieved Thu, 16 May 2024 20:28:05 +0000
Statistical Computations at FreeStatistics.org, Office for Research Development and Education, URL https://freestatistics.org/blog/index.php?pk=271644, Retrieved Thu, 16 May 2024 20:28:05 +0000
QR Codes:

Original text written by user:
IsPrivate?No (this computation is public)
User-defined keywords
Estimated Impact113
Family? (F = Feedback message, R = changed R code, M = changed R Module, P = changed Parameters, D = changed Data)
-       [Exponential Smoothing] [] [2014-12-29 09:58:12] [7a6c09eb8232161d54860d64a56e9131] [Current]
Feedback Forum

Post a new message
Dataseries X:
324
336
327
302
299
311
315
264
278
278
287
279
324
354
354
360
363
385
412
370
389
395
417
404
456
478
468
437
432
441
449
386
396
394
403
373
409
430
415
392
401
400
447
392
427
444
448
427
480
490
482
490
485
498
544
483
508
529
547
543
608
638
661
650
654
678
725
644
670
662
641
642


Summary of computational transaction
Raw Inputview raw input (R code)
Raw Outputview raw output of R engine
Computing time2 seconds
R Server'Herman Ole Andreas Wold' @ wold.wessa.net

\begin{tabular}{lllllllll}
\hline
Summary of computational transaction \tabularnewline
Raw Input & view raw input (R code)  \tabularnewline
Raw Output & view raw output of R engine  \tabularnewline
Computing time & 2 seconds \tabularnewline
R Server & 'Herman Ole Andreas Wold' @ wold.wessa.net \tabularnewline
\hline
\end{tabular}
%Source: https://freestatistics.org/blog/index.php?pk=271644&T=0

[TABLE]
[ROW][C]Summary of computational transaction[/C][/ROW]
[ROW][C]Raw Input[/C][C]view raw input (R code) [/C][/ROW]
[ROW][C]Raw Output[/C][C]view raw output of R engine [/C][/ROW]
[ROW][C]Computing time[/C][C]2 seconds[/C][/ROW]
[ROW][C]R Server[/C][C]'Herman Ole Andreas Wold' @ wold.wessa.net[/C][/ROW]
[/TABLE]
Source: https://freestatistics.org/blog/index.php?pk=271644&T=0

Globally Unique Identifier (entire table): ba.freestatistics.org/blog/index.php?pk=271644&T=0

As an alternative you can also use a QR Code:  

The GUIDs for individual cells are displayed in the table below:

Summary of computational transaction
Raw Inputview raw input (R code)
Raw Outputview raw output of R engine
Computing time2 seconds
R Server'Herman Ole Andreas Wold' @ wold.wessa.net


Estimated Parameters of Exponential Smoothing
ParameterValue
alpha0.684194216388738
beta0.444679825978663
gamma1

\begin{tabular}{lllllllll}
\hline
Estimated Parameters of Exponential Smoothing \tabularnewline
Parameter & Value \tabularnewline
alpha & 0.684194216388738 \tabularnewline
beta & 0.444679825978663 \tabularnewline
gamma & 1 \tabularnewline
\hline
\end{tabular}
%Source: https://freestatistics.org/blog/index.php?pk=271644&T=1

[TABLE]
[ROW][C]Estimated Parameters of Exponential Smoothing[/C][/ROW]
[ROW][C]Parameter[/C][C]Value[/C][/ROW]
[ROW][C]alpha[/C][C]0.684194216388738[/C][/ROW]
[ROW][C]beta[/C][C]0.444679825978663[/C][/ROW]
[ROW][C]gamma[/C][C]1[/C][/ROW]
[/TABLE]
Source: https://freestatistics.org/blog/index.php?pk=271644&T=1

Globally Unique Identifier (entire table): ba.freestatistics.org/blog/index.php?pk=271644&T=1

As an alternative you can also use a QR Code:  

The GUIDs for individual cells are displayed in the table below:

Estimated Parameters of Exponential Smoothing
ParameterValue
alpha0.684194216388738
beta0.444679825978663
gamma1


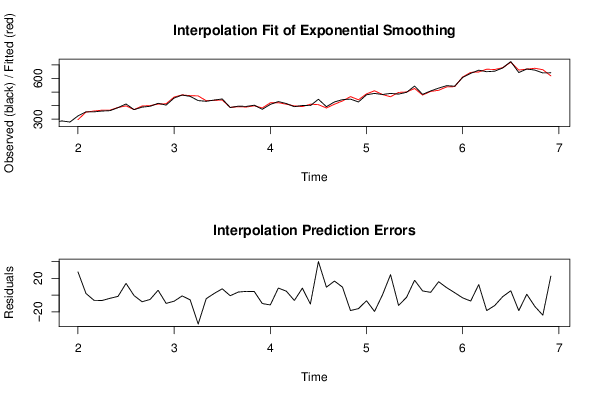
Interpolation Forecasts of Exponential Smoothing
tObservedFittedResiduals
13324296.19738247863227.8026175213676
14354351.9558893001492.0441106998511
15354360.129156692601-6.12915669260093
16360366.387208698923-6.38720869892302
17363366.733744931466-3.73374493146611
18385386.42645033649-1.42645033648989
19412397.93046626927414.0695337307255
20370370.525696776902-0.525696776901611
21389396.850013125147-7.85001312514663
22395400.10806211309-5.10806211309023
23417411.1463570198685.85364298013212
24404413.798875939341-9.79887593934109
25456463.165977169691-7.16597716969108
26478478.906016660937-0.906016660937212
27468473.623618729841-5.62361872984059
28437471.443831031347-34.4438310313472
29432436.19378278031-4.1937827803099
30441438.9220396673772.07796033262269
31449441.4053319551827.59466804481821
32386386.679135229176-0.679135229176438
33396392.256621795233.74337820477001
34394389.5111982150824.48880178491805
35403398.6956744646834.30432553531654
36373382.991920297609-9.99192029760877
37409420.646610067697-11.6466100676971
38430421.5229211391568.47707886084407
39415410.2502819274864.74971807251427
40392398.30208698303-6.30208698302954
41401392.6574543555138.34254564448725
42400410.55564919935-10.5556491993502
43447406.90556650911140.0944334908888
44392382.4588338054149.54116619458563
45427410.19137399089616.8086260091035
46444434.3613208655899.63867913441061
47448466.318685753906-18.3186857539063
48427443.04620042022-16.0462004202199
49480486.618666804525-6.61866680452511
50490509.402624075774-19.4026240757738
51482481.5077842555820.492215744418161
52490465.49112601086224.5088739891381
53485497.260907180624-12.2609071806243
54498500.53450611492-2.53450611491979
55544526.24877041673717.7512295832628
56483477.9489256180255.0510743819745
57508504.6212555074713.37874449252899
58529512.96901707739816.0309829226023
59547538.0464759519528.95352404804805
60543540.0242550478062.97574495219351
61608611.249185042999-3.24918504299922
62638644.986919513233-6.98691951323258
63661648.33282873433712.6671712656633
64650668.398092664015-18.3980926640154
65654666.31202274888-12.3120227488796
66678679.719707537829-1.71970753782864
67725719.7431104126095.25688958739124
68644662.42786340435-18.4278634043499
69670668.9084388644471.09156113555275
70662675.391633833941-13.3916338339415
71641664.856113377258-23.8561133772583
72642619.26857268789422.7314273121056

\begin{tabular}{lllllllll}
\hline
Interpolation Forecasts of Exponential Smoothing \tabularnewline
t & Observed & Fitted & Residuals \tabularnewline
13 & 324 & 296.197382478632 & 27.8026175213676 \tabularnewline
14 & 354 & 351.955889300149 & 2.0441106998511 \tabularnewline
15 & 354 & 360.129156692601 & -6.12915669260093 \tabularnewline
16 & 360 & 366.387208698923 & -6.38720869892302 \tabularnewline
17 & 363 & 366.733744931466 & -3.73374493146611 \tabularnewline
18 & 385 & 386.42645033649 & -1.42645033648989 \tabularnewline
19 & 412 & 397.930466269274 & 14.0695337307255 \tabularnewline
20 & 370 & 370.525696776902 & -0.525696776901611 \tabularnewline
21 & 389 & 396.850013125147 & -7.85001312514663 \tabularnewline
22 & 395 & 400.10806211309 & -5.10806211309023 \tabularnewline
23 & 417 & 411.146357019868 & 5.85364298013212 \tabularnewline
24 & 404 & 413.798875939341 & -9.79887593934109 \tabularnewline
25 & 456 & 463.165977169691 & -7.16597716969108 \tabularnewline
26 & 478 & 478.906016660937 & -0.906016660937212 \tabularnewline
27 & 468 & 473.623618729841 & -5.62361872984059 \tabularnewline
28 & 437 & 471.443831031347 & -34.4438310313472 \tabularnewline
29 & 432 & 436.19378278031 & -4.1937827803099 \tabularnewline
30 & 441 & 438.922039667377 & 2.07796033262269 \tabularnewline
31 & 449 & 441.405331955182 & 7.59466804481821 \tabularnewline
32 & 386 & 386.679135229176 & -0.679135229176438 \tabularnewline
33 & 396 & 392.25662179523 & 3.74337820477001 \tabularnewline
34 & 394 & 389.511198215082 & 4.48880178491805 \tabularnewline
35 & 403 & 398.695674464683 & 4.30432553531654 \tabularnewline
36 & 373 & 382.991920297609 & -9.99192029760877 \tabularnewline
37 & 409 & 420.646610067697 & -11.6466100676971 \tabularnewline
38 & 430 & 421.522921139156 & 8.47707886084407 \tabularnewline
39 & 415 & 410.250281927486 & 4.74971807251427 \tabularnewline
40 & 392 & 398.30208698303 & -6.30208698302954 \tabularnewline
41 & 401 & 392.657454355513 & 8.34254564448725 \tabularnewline
42 & 400 & 410.55564919935 & -10.5556491993502 \tabularnewline
43 & 447 & 406.905566509111 & 40.0944334908888 \tabularnewline
44 & 392 & 382.458833805414 & 9.54116619458563 \tabularnewline
45 & 427 & 410.191373990896 & 16.8086260091035 \tabularnewline
46 & 444 & 434.361320865589 & 9.63867913441061 \tabularnewline
47 & 448 & 466.318685753906 & -18.3186857539063 \tabularnewline
48 & 427 & 443.04620042022 & -16.0462004202199 \tabularnewline
49 & 480 & 486.618666804525 & -6.61866680452511 \tabularnewline
50 & 490 & 509.402624075774 & -19.4026240757738 \tabularnewline
51 & 482 & 481.507784255582 & 0.492215744418161 \tabularnewline
52 & 490 & 465.491126010862 & 24.5088739891381 \tabularnewline
53 & 485 & 497.260907180624 & -12.2609071806243 \tabularnewline
54 & 498 & 500.53450611492 & -2.53450611491979 \tabularnewline
55 & 544 & 526.248770416737 & 17.7512295832628 \tabularnewline
56 & 483 & 477.948925618025 & 5.0510743819745 \tabularnewline
57 & 508 & 504.621255507471 & 3.37874449252899 \tabularnewline
58 & 529 & 512.969017077398 & 16.0309829226023 \tabularnewline
59 & 547 & 538.046475951952 & 8.95352404804805 \tabularnewline
60 & 543 & 540.024255047806 & 2.97574495219351 \tabularnewline
61 & 608 & 611.249185042999 & -3.24918504299922 \tabularnewline
62 & 638 & 644.986919513233 & -6.98691951323258 \tabularnewline
63 & 661 & 648.332828734337 & 12.6671712656633 \tabularnewline
64 & 650 & 668.398092664015 & -18.3980926640154 \tabularnewline
65 & 654 & 666.31202274888 & -12.3120227488796 \tabularnewline
66 & 678 & 679.719707537829 & -1.71970753782864 \tabularnewline
67 & 725 & 719.743110412609 & 5.25688958739124 \tabularnewline
68 & 644 & 662.42786340435 & -18.4278634043499 \tabularnewline
69 & 670 & 668.908438864447 & 1.09156113555275 \tabularnewline
70 & 662 & 675.391633833941 & -13.3916338339415 \tabularnewline
71 & 641 & 664.856113377258 & -23.8561133772583 \tabularnewline
72 & 642 & 619.268572687894 & 22.7314273121056 \tabularnewline
\hline
\end{tabular}
%Source: https://freestatistics.org/blog/index.php?pk=271644&T=2

[TABLE]
[ROW][C]Interpolation Forecasts of Exponential Smoothing[/C][/ROW]
[ROW][C]t[/C][C]Observed[/C][C]Fitted[/C][C]Residuals[/C][/ROW]
[ROW][C]13[/C][C]324[/C][C]296.197382478632[/C][C]27.8026175213676[/C][/ROW]
[ROW][C]14[/C][C]354[/C][C]351.955889300149[/C][C]2.0441106998511[/C][/ROW]
[ROW][C]15[/C][C]354[/C][C]360.129156692601[/C][C]-6.12915669260093[/C][/ROW]
[ROW][C]16[/C][C]360[/C][C]366.387208698923[/C][C]-6.38720869892302[/C][/ROW]
[ROW][C]17[/C][C]363[/C][C]366.733744931466[/C][C]-3.73374493146611[/C][/ROW]
[ROW][C]18[/C][C]385[/C][C]386.42645033649[/C][C]-1.42645033648989[/C][/ROW]
[ROW][C]19[/C][C]412[/C][C]397.930466269274[/C][C]14.0695337307255[/C][/ROW]
[ROW][C]20[/C][C]370[/C][C]370.525696776902[/C][C]-0.525696776901611[/C][/ROW]
[ROW][C]21[/C][C]389[/C][C]396.850013125147[/C][C]-7.85001312514663[/C][/ROW]
[ROW][C]22[/C][C]395[/C][C]400.10806211309[/C][C]-5.10806211309023[/C][/ROW]
[ROW][C]23[/C][C]417[/C][C]411.146357019868[/C][C]5.85364298013212[/C][/ROW]
[ROW][C]24[/C][C]404[/C][C]413.798875939341[/C][C]-9.79887593934109[/C][/ROW]
[ROW][C]25[/C][C]456[/C][C]463.165977169691[/C][C]-7.16597716969108[/C][/ROW]
[ROW][C]26[/C][C]478[/C][C]478.906016660937[/C][C]-0.906016660937212[/C][/ROW]
[ROW][C]27[/C][C]468[/C][C]473.623618729841[/C][C]-5.62361872984059[/C][/ROW]
[ROW][C]28[/C][C]437[/C][C]471.443831031347[/C][C]-34.4438310313472[/C][/ROW]
[ROW][C]29[/C][C]432[/C][C]436.19378278031[/C][C]-4.1937827803099[/C][/ROW]
[ROW][C]30[/C][C]441[/C][C]438.922039667377[/C][C]2.07796033262269[/C][/ROW]
[ROW][C]31[/C][C]449[/C][C]441.405331955182[/C][C]7.59466804481821[/C][/ROW]
[ROW][C]32[/C][C]386[/C][C]386.679135229176[/C][C]-0.679135229176438[/C][/ROW]
[ROW][C]33[/C][C]396[/C][C]392.25662179523[/C][C]3.74337820477001[/C][/ROW]
[ROW][C]34[/C][C]394[/C][C]389.511198215082[/C][C]4.48880178491805[/C][/ROW]
[ROW][C]35[/C][C]403[/C][C]398.695674464683[/C][C]4.30432553531654[/C][/ROW]
[ROW][C]36[/C][C]373[/C][C]382.991920297609[/C][C]-9.99192029760877[/C][/ROW]
[ROW][C]37[/C][C]409[/C][C]420.646610067697[/C][C]-11.6466100676971[/C][/ROW]
[ROW][C]38[/C][C]430[/C][C]421.522921139156[/C][C]8.47707886084407[/C][/ROW]
[ROW][C]39[/C][C]415[/C][C]410.250281927486[/C][C]4.74971807251427[/C][/ROW]
[ROW][C]40[/C][C]392[/C][C]398.30208698303[/C][C]-6.30208698302954[/C][/ROW]
[ROW][C]41[/C][C]401[/C][C]392.657454355513[/C][C]8.34254564448725[/C][/ROW]
[ROW][C]42[/C][C]400[/C][C]410.55564919935[/C][C]-10.5556491993502[/C][/ROW]
[ROW][C]43[/C][C]447[/C][C]406.905566509111[/C][C]40.0944334908888[/C][/ROW]
[ROW][C]44[/C][C]392[/C][C]382.458833805414[/C][C]9.54116619458563[/C][/ROW]
[ROW][C]45[/C][C]427[/C][C]410.191373990896[/C][C]16.8086260091035[/C][/ROW]
[ROW][C]46[/C][C]444[/C][C]434.361320865589[/C][C]9.63867913441061[/C][/ROW]
[ROW][C]47[/C][C]448[/C][C]466.318685753906[/C][C]-18.3186857539063[/C][/ROW]
[ROW][C]48[/C][C]427[/C][C]443.04620042022[/C][C]-16.0462004202199[/C][/ROW]
[ROW][C]49[/C][C]480[/C][C]486.618666804525[/C][C]-6.61866680452511[/C][/ROW]
[ROW][C]50[/C][C]490[/C][C]509.402624075774[/C][C]-19.4026240757738[/C][/ROW]
[ROW][C]51[/C][C]482[/C][C]481.507784255582[/C][C]0.492215744418161[/C][/ROW]
[ROW][C]52[/C][C]490[/C][C]465.491126010862[/C][C]24.5088739891381[/C][/ROW]
[ROW][C]53[/C][C]485[/C][C]497.260907180624[/C][C]-12.2609071806243[/C][/ROW]
[ROW][C]54[/C][C]498[/C][C]500.53450611492[/C][C]-2.53450611491979[/C][/ROW]
[ROW][C]55[/C][C]544[/C][C]526.248770416737[/C][C]17.7512295832628[/C][/ROW]
[ROW][C]56[/C][C]483[/C][C]477.948925618025[/C][C]5.0510743819745[/C][/ROW]
[ROW][C]57[/C][C]508[/C][C]504.621255507471[/C][C]3.37874449252899[/C][/ROW]
[ROW][C]58[/C][C]529[/C][C]512.969017077398[/C][C]16.0309829226023[/C][/ROW]
[ROW][C]59[/C][C]547[/C][C]538.046475951952[/C][C]8.95352404804805[/C][/ROW]
[ROW][C]60[/C][C]543[/C][C]540.024255047806[/C][C]2.97574495219351[/C][/ROW]
[ROW][C]61[/C][C]608[/C][C]611.249185042999[/C][C]-3.24918504299922[/C][/ROW]
[ROW][C]62[/C][C]638[/C][C]644.986919513233[/C][C]-6.98691951323258[/C][/ROW]
[ROW][C]63[/C][C]661[/C][C]648.332828734337[/C][C]12.6671712656633[/C][/ROW]
[ROW][C]64[/C][C]650[/C][C]668.398092664015[/C][C]-18.3980926640154[/C][/ROW]
[ROW][C]65[/C][C]654[/C][C]666.31202274888[/C][C]-12.3120227488796[/C][/ROW]
[ROW][C]66[/C][C]678[/C][C]679.719707537829[/C][C]-1.71970753782864[/C][/ROW]
[ROW][C]67[/C][C]725[/C][C]719.743110412609[/C][C]5.25688958739124[/C][/ROW]
[ROW][C]68[/C][C]644[/C][C]662.42786340435[/C][C]-18.4278634043499[/C][/ROW]
[ROW][C]69[/C][C]670[/C][C]668.908438864447[/C][C]1.09156113555275[/C][/ROW]
[ROW][C]70[/C][C]662[/C][C]675.391633833941[/C][C]-13.3916338339415[/C][/ROW]
[ROW][C]71[/C][C]641[/C][C]664.856113377258[/C][C]-23.8561133772583[/C][/ROW]
[ROW][C]72[/C][C]642[/C][C]619.268572687894[/C][C]22.7314273121056[/C][/ROW]
[/TABLE]
Source: https://freestatistics.org/blog/index.php?pk=271644&T=2

Globally Unique Identifier (entire table): ba.freestatistics.org/blog/index.php?pk=271644&T=2

As an alternative you can also use a QR Code:  

The GUIDs for individual cells are displayed in the table below:

Interpolation Forecasts of Exponential Smoothing
tObservedFittedResiduals
13324296.19738247863227.8026175213676
14354351.9558893001492.0441106998511
15354360.129156692601-6.12915669260093
16360366.387208698923-6.38720869892302
17363366.733744931466-3.73374493146611
18385386.42645033649-1.42645033648989
19412397.93046626927414.0695337307255
20370370.525696776902-0.525696776901611
21389396.850013125147-7.85001312514663
22395400.10806211309-5.10806211309023
23417411.1463570198685.85364298013212
24404413.798875939341-9.79887593934109
25456463.165977169691-7.16597716969108
26478478.906016660937-0.906016660937212
27468473.623618729841-5.62361872984059
28437471.443831031347-34.4438310313472
29432436.19378278031-4.1937827803099
30441438.9220396673772.07796033262269
31449441.4053319551827.59466804481821
32386386.679135229176-0.679135229176438
33396392.256621795233.74337820477001
34394389.5111982150824.48880178491805
35403398.6956744646834.30432553531654
36373382.991920297609-9.99192029760877
37409420.646610067697-11.6466100676971
38430421.5229211391568.47707886084407
39415410.2502819274864.74971807251427
40392398.30208698303-6.30208698302954
41401392.6574543555138.34254564448725
42400410.55564919935-10.5556491993502
43447406.90556650911140.0944334908888
44392382.4588338054149.54116619458563
45427410.19137399089616.8086260091035
46444434.3613208655899.63867913441061
47448466.318685753906-18.3186857539063
48427443.04620042022-16.0462004202199
49480486.618666804525-6.61866680452511
50490509.402624075774-19.4026240757738
51482481.5077842555820.492215744418161
52490465.49112601086224.5088739891381
53485497.260907180624-12.2609071806243
54498500.53450611492-2.53450611491979
55544526.24877041673717.7512295832628
56483477.9489256180255.0510743819745
57508504.6212555074713.37874449252899
58529512.96901707739816.0309829226023
59547538.0464759519528.95352404804805
60543540.0242550478062.97574495219351
61608611.249185042999-3.24918504299922
62638644.986919513233-6.98691951323258
63661648.33282873433712.6671712656633
64650668.398092664015-18.3980926640154
65654666.31202274888-12.3120227488796
66678679.719707537829-1.71970753782864
67725719.7431104126095.25688958739124
68644662.42786340435-18.4278634043499
69670668.9084388644471.09156113555275
70662675.391633833941-13.3916338339415
71641664.856113377258-23.8561133772583
72642619.26857268789422.7314273121056


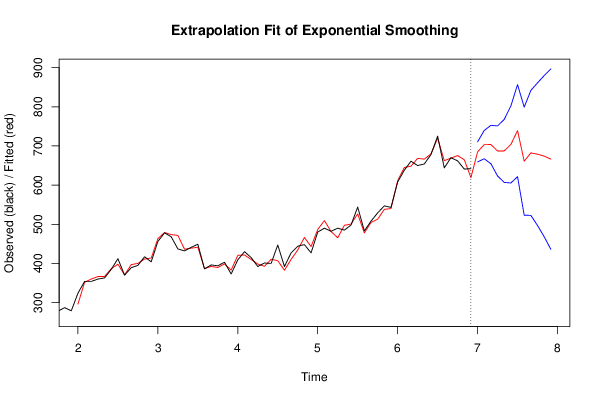
Extrapolation Forecasts of Exponential Smoothing
tForecast95% Lower Bound95% Upper Bound
73684.825633297452659.147787643018710.503478951886
74703.375875104724667.271173538258739.480576671189
75703.604653524618654.560227305221752.649079744016
76687.234152375202623.305768409503751.162536340902
77687.297168604825606.860455655543767.733881554106
78703.858884509024605.486617080133802.231151937914
79739.170469497164621.569361430242856.771577564086
80661.087630693373523.062685978518799.112575408228
81682.25634339696522.688912669171841.823774124749
82679.00226973419496.835513463436861.169026004944
83673.98230176056468.210973578001879.753629943118
84666.345567527557436.00848866369896.682646391424

\begin{tabular}{lllllllll}
\hline
Extrapolation Forecasts of Exponential Smoothing \tabularnewline
t & Forecast & 95% Lower Bound & 95% Upper Bound \tabularnewline
73 & 684.825633297452 & 659.147787643018 & 710.503478951886 \tabularnewline
74 & 703.375875104724 & 667.271173538258 & 739.480576671189 \tabularnewline
75 & 703.604653524618 & 654.560227305221 & 752.649079744016 \tabularnewline
76 & 687.234152375202 & 623.305768409503 & 751.162536340902 \tabularnewline
77 & 687.297168604825 & 606.860455655543 & 767.733881554106 \tabularnewline
78 & 703.858884509024 & 605.486617080133 & 802.231151937914 \tabularnewline
79 & 739.170469497164 & 621.569361430242 & 856.771577564086 \tabularnewline
80 & 661.087630693373 & 523.062685978518 & 799.112575408228 \tabularnewline
81 & 682.25634339696 & 522.688912669171 & 841.823774124749 \tabularnewline
82 & 679.00226973419 & 496.835513463436 & 861.169026004944 \tabularnewline
83 & 673.98230176056 & 468.210973578001 & 879.753629943118 \tabularnewline
84 & 666.345567527557 & 436.00848866369 & 896.682646391424 \tabularnewline
\hline
\end{tabular}
%Source: https://freestatistics.org/blog/index.php?pk=271644&T=3

[TABLE]
[ROW][C]Extrapolation Forecasts of Exponential Smoothing[/C][/ROW]
[ROW][C]t[/C][C]Forecast[/C][C]95% Lower Bound[/C][C]95% Upper Bound[/C][/ROW]
[ROW][C]73[/C][C]684.825633297452[/C][C]659.147787643018[/C][C]710.503478951886[/C][/ROW]
[ROW][C]74[/C][C]703.375875104724[/C][C]667.271173538258[/C][C]739.480576671189[/C][/ROW]
[ROW][C]75[/C][C]703.604653524618[/C][C]654.560227305221[/C][C]752.649079744016[/C][/ROW]
[ROW][C]76[/C][C]687.234152375202[/C][C]623.305768409503[/C][C]751.162536340902[/C][/ROW]
[ROW][C]77[/C][C]687.297168604825[/C][C]606.860455655543[/C][C]767.733881554106[/C][/ROW]
[ROW][C]78[/C][C]703.858884509024[/C][C]605.486617080133[/C][C]802.231151937914[/C][/ROW]
[ROW][C]79[/C][C]739.170469497164[/C][C]621.569361430242[/C][C]856.771577564086[/C][/ROW]
[ROW][C]80[/C][C]661.087630693373[/C][C]523.062685978518[/C][C]799.112575408228[/C][/ROW]
[ROW][C]81[/C][C]682.25634339696[/C][C]522.688912669171[/C][C]841.823774124749[/C][/ROW]
[ROW][C]82[/C][C]679.00226973419[/C][C]496.835513463436[/C][C]861.169026004944[/C][/ROW]
[ROW][C]83[/C][C]673.98230176056[/C][C]468.210973578001[/C][C]879.753629943118[/C][/ROW]
[ROW][C]84[/C][C]666.345567527557[/C][C]436.00848866369[/C][C]896.682646391424[/C][/ROW]
[/TABLE]
Source: https://freestatistics.org/blog/index.php?pk=271644&T=3

Globally Unique Identifier (entire table): ba.freestatistics.org/blog/index.php?pk=271644&T=3

As an alternative you can also use a QR Code:  

The GUIDs for individual cells are displayed in the table below:

Extrapolation Forecasts of Exponential Smoothing
tForecast95% Lower Bound95% Upper Bound
73684.825633297452659.147787643018710.503478951886
74703.375875104724667.271173538258739.480576671189
75703.604653524618654.560227305221752.649079744016
76687.234152375202623.305768409503751.162536340902
77687.297168604825606.860455655543767.733881554106
78703.858884509024605.486617080133802.231151937914
79739.170469497164621.569361430242856.771577564086
80661.087630693373523.062685978518799.112575408228
81682.25634339696522.688912669171841.823774124749
82679.00226973419496.835513463436861.169026004944
83673.98230176056468.210973578001879.753629943118
84666.345567527557436.00848866369896.682646391424


Parameters (Session):
par1 = 12 ; par2 = Triple ; par3 = additive ;
Parameters (R input):
par1 = 12 ; par2 = Triple ; par3 = additive ;
R code (references can be found in the software module):
par1 <- as.numeric(par1)
if (par2 == 'Single') K <- 1
if (par2 == 'Double') K <- 2
if (par2 == 'Triple') K <- par1
nx <- length(x)
nxmK <- nx - K
x <- ts(x, frequency = par1)
if (par2 == 'Single') fit <- HoltWinters(x, gamma=F, beta=F)
if (par2 == 'Double') fit <- HoltWinters(x, gamma=F)
if (par2 == 'Triple') fit <- HoltWinters(x, seasonal=par3)
fit
myresid <- x - fit$fitted[,'xhat']
bitmap(file='test1.png')
op <- par(mfrow=c(2,1))
plot(fit,ylab='Observed (black) / Fitted (red)',main='Interpolation Fit of Exponential Smoothing')
plot(myresid,ylab='Residuals',main='Interpolation Prediction Errors')
par(op)
dev.off()
bitmap(file='test2.png')
p <- predict(fit, par1, prediction.interval=TRUE)
np <- length(p[,1])
plot(fit,p,ylab='Observed (black) / Fitted (red)',main='Extrapolation Fit of Exponential Smoothing')
dev.off()
bitmap(file='test3.png')
op <- par(mfrow = c(2,2))
acf(as.numeric(myresid),lag.max = nx/2,main='Residual ACF')
spectrum(myresid,main='Residals Periodogram')
cpgram(myresid,main='Residal Cumulative Periodogram')
qqnorm(myresid,main='Residual Normal QQ Plot')
qqline(myresid)
par(op)
dev.off()
load(file='createtable')
a<-table.start()
a<-table.row.start(a)
a<-table.element(a,'Estimated Parameters of Exponential Smoothing',2,TRUE)
a<-table.row.end(a)
a<-table.row.start(a)
a<-table.element(a,'Parameter',header=TRUE)
a<-table.element(a,'Value',header=TRUE)
a<-table.row.end(a)
a<-table.row.start(a)
a<-table.element(a,'alpha',header=TRUE)
a<-table.element(a,fit$alpha)
a<-table.row.end(a)
a<-table.row.start(a)
a<-table.element(a,'beta',header=TRUE)
a<-table.element(a,fit$beta)
a<-table.row.end(a)
a<-table.row.start(a)
a<-table.element(a,'gamma',header=TRUE)
a<-table.element(a,fit$gamma)
a<-table.row.end(a)
a<-table.end(a)
table.save(a,file='mytable.tab')
a<-table.start()
a<-table.row.start(a)
a<-table.element(a,'Interpolation Forecasts of Exponential Smoothing',4,TRUE)
a<-table.row.end(a)
a<-table.row.start(a)
a<-table.element(a,'t',header=TRUE)
a<-table.element(a,'Observed',header=TRUE)
a<-table.element(a,'Fitted',header=TRUE)
a<-table.element(a,'Residuals',header=TRUE)
a<-table.row.end(a)
for (i in 1:nxmK) {
a<-table.row.start(a)
a<-table.element(a,i+K,header=TRUE)
a<-table.element(a,x[i+K])
a<-table.element(a,fit$fitted[i,'xhat'])
a<-table.element(a,myresid[i])
a<-table.row.end(a)
}
a<-table.end(a)
table.save(a,file='mytable1.tab')
a<-table.start()
a<-table.row.start(a)
a<-table.element(a,'Extrapolation Forecasts of Exponential Smoothing',4,TRUE)
a<-table.row.end(a)
a<-table.row.start(a)
a<-table.element(a,'t',header=TRUE)
a<-table.element(a,'Forecast',header=TRUE)
a<-table.element(a,'95% Lower Bound',header=TRUE)
a<-table.element(a,'95% Upper Bound',header=TRUE)
a<-table.row.end(a)
for (i in 1:np) {
a<-table.row.start(a)
a<-table.element(a,nx+i,header=TRUE)
a<-table.element(a,p[i,'fit'])
a<-table.element(a,p[i,'lwr'])
a<-table.element(a,p[i,'upr'])
a<-table.row.end(a)
}
a<-table.end(a)
table.save(a,file='mytable2.tab')