Free Statistics

of Irreproducible Research!

Author's title

Author*Unverified author*
R Software Modulerwasp_exponentialsmoothing.wasp
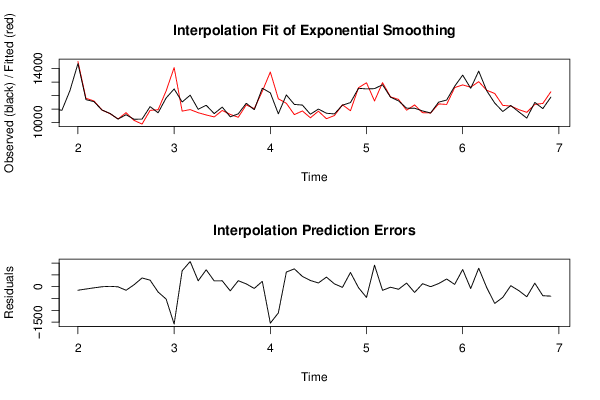
Title produced by softwareExponential Smoothing
Date of computationMon, 29 Dec 2014 13:24:56 +0000
Cite this page as followsStatistical Computations at FreeStatistics.org, Office for Research Development and Education, URL https://freestatistics.org/blog/index.php?v=date/2014/Dec/29/t1419859546h0qznnaz4uxybek.htm/, Retrieved Thu, 16 May 2024 17:27:03 +0000
Statistical Computations at FreeStatistics.org, Office for Research Development and Education, URL https://freestatistics.org/blog/index.php?pk=271665, Retrieved Thu, 16 May 2024 17:27:03 +0000
QR Codes:

Original text written by user:
IsPrivate?No (this computation is public)
User-defined keywords
Estimated Impact106
Family? (F = Feedback message, R = changed R code, M = changed R Module, P = changed Parameters, D = changed Data)
-     [Exponential Smoothing] [] [2014-11-28 14:41:08] [5b8e3de349b425adf498340f25b552b3]
- R       [Exponential Smoothing] [] [2014-12-29 13:24:56] [a0c7ba102f88b9f955287def3adf2996] [Current]
Feedback Forum

Post a new message
Dataseries X:
12849
11380
12079
11366
11328
10444
10854
10434
10137
10992
10906
12367
14371
11695
11546
10922
10670
10254
10573
10239
10253
11176
10719
11817
12487
11519
12025
10976
11276
10657
11141
10423
10640
11426
10948
12540
12200
10644
12044
11338
11292
10612
10995
10686
10635
11285
11475
12535
12490
12511
12799
11876
11602
11062
11055
10855
10704
11510
11663
12686
13516
12539
13811
12354
11441
10814
11261
10788
10326
11490
11029
11876


Summary of computational transaction
Raw Inputview raw input (R code)
Raw Outputview raw output of R engine
Computing time2 seconds
R Server'Gwilym Jenkins' @ jenkins.wessa.net

\begin{tabular}{lllllllll}
\hline
Summary of computational transaction \tabularnewline
Raw Input & view raw input (R code)  \tabularnewline
Raw Output & view raw output of R engine  \tabularnewline
Computing time & 2 seconds \tabularnewline
R Server & 'Gwilym Jenkins' @ jenkins.wessa.net \tabularnewline
\hline
\end{tabular}
%Source: https://freestatistics.org/blog/index.php?pk=271665&T=0

[TABLE]
[ROW][C]Summary of computational transaction[/C][/ROW]
[ROW][C]Raw Input[/C][C]view raw input (R code) [/C][/ROW]
[ROW][C]Raw Output[/C][C]view raw output of R engine [/C][/ROW]
[ROW][C]Computing time[/C][C]2 seconds[/C][/ROW]
[ROW][C]R Server[/C][C]'Gwilym Jenkins' @ jenkins.wessa.net[/C][/ROW]
[/TABLE]
Source: https://freestatistics.org/blog/index.php?pk=271665&T=0

Globally Unique Identifier (entire table): ba.freestatistics.org/blog/index.php?pk=271665&T=0

As an alternative you can also use a QR Code:  

The GUIDs for individual cells are displayed in the table below:

Summary of computational transaction
Raw Inputview raw input (R code)
Raw Outputview raw output of R engine
Computing time2 seconds
R Server'Gwilym Jenkins' @ jenkins.wessa.net


Estimated Parameters of Exponential Smoothing
ParameterValue
alpha0.369951445756163
beta0
gamma0.861233859034318

\begin{tabular}{lllllllll}
\hline
Estimated Parameters of Exponential Smoothing \tabularnewline
Parameter & Value \tabularnewline
alpha & 0.369951445756163 \tabularnewline
beta & 0 \tabularnewline
gamma & 0.861233859034318 \tabularnewline
\hline
\end{tabular}
%Source: https://freestatistics.org/blog/index.php?pk=271665&T=1

[TABLE]
[ROW][C]Estimated Parameters of Exponential Smoothing[/C][/ROW]
[ROW][C]Parameter[/C][C]Value[/C][/ROW]
[ROW][C]alpha[/C][C]0.369951445756163[/C][/ROW]
[ROW][C]beta[/C][C]0[/C][/ROW]
[ROW][C]gamma[/C][C]0.861233859034318[/C][/ROW]
[/TABLE]
Source: https://freestatistics.org/blog/index.php?pk=271665&T=1

Globally Unique Identifier (entire table): ba.freestatistics.org/blog/index.php?pk=271665&T=1

As an alternative you can also use a QR Code:  

The GUIDs for individual cells are displayed in the table below:

Estimated Parameters of Exponential Smoothing
ParameterValue
alpha0.369951445756163
beta0
gamma0.861233859034318


Interpolation Forecasts of Exponential Smoothing
tObservedFittedResiduals
131437114521.4580662393-150.458066239316
141169511793.3578043578-98.3578043578218
151154611594.990443017-48.9904430169936
161092210924.0949417107-2.09494171070401
171067010655.173498912114.8265010878622
181025410259.0955016745-5.09550167451562
191057310725.3556640459-152.355664045928
201023910156.178383112482.8216168875861
21102539882.63027726926370.369722730742
221117610899.0860089072276.913991092779
231071910945.1759908449-226.175990844853
241181712341.5637732859-524.563773285887
251248714073.2128032086-1586.21280320859
261151910842.2236003338676.776399666232
271202510957.40593396411067.59406603586
281097610725.038883043250.961116956965
291127610558.917793876717.082206124007
301065710411.8302498466245.169750153398
311114110890.7702201507250.229779849282
321042310598.141701977-175.141701977027
331064010385.1888014977254.811198502292
341142611308.1826205741117.817379425875
351094811022.4283237699-74.428323769911
361254012313.0444508282226.955549171846
371220013746.6480487811-1546.64804878108
381064411758.23715664-1114.23715664002
391204411422.8965847973621.103415202699
401133810582.2289972298755.771002770238
411129210855.7892833037436.210716696343
421061210348.7241910172263.27580898276
431099510837.1081929634157.891807036603
441068610279.5043973035406.495602696463
451063510515.0297350248119.970264975202
461128511313.8034864414-28.8034864414385
471147510869.4903887048605.509611295187
481253512575.1871981462-40.1871981462227
491249012947.5696777373-457.569677737274
501251111596.6993332772914.300666722784
511279912953.4482841086-154.448284108636
521187611898.9374357177-22.9374357177239
531160211711.0138790662-109.013879066179
541106210908.4043670758153.595632924244
551105511299.0286519957-244.028651995723
561085510727.6309811663127.369018833655
571070410704.4189010754-0.418901075374379
581151011377.9270202569132.072979743103
591166311337.3208362742325.679163725843
601268612589.126514626496.8734853735641
611351612785.7350668803730.264933119692
621253912618.708971161-79.7089711609769
631381113027.7989745024783.20102549755
641235412391.5331482864-37.533148286424
651144112151.5031603371-710.503160337123
661081411268.8687687211-454.868768721075
671126111218.632217953142.367782046942
681078810954.7148095791-166.714809579098
691032610753.3658197995-427.365819799486
701149011340.8169405915149.183059408544
711102911411.5950778699-382.595077869873
721187612277.219334364-401.219334363999

\begin{tabular}{lllllllll}
\hline
Interpolation Forecasts of Exponential Smoothing \tabularnewline
t & Observed & Fitted & Residuals \tabularnewline
13 & 14371 & 14521.4580662393 & -150.458066239316 \tabularnewline
14 & 11695 & 11793.3578043578 & -98.3578043578218 \tabularnewline
15 & 11546 & 11594.990443017 & -48.9904430169936 \tabularnewline
16 & 10922 & 10924.0949417107 & -2.09494171070401 \tabularnewline
17 & 10670 & 10655.1734989121 & 14.8265010878622 \tabularnewline
18 & 10254 & 10259.0955016745 & -5.09550167451562 \tabularnewline
19 & 10573 & 10725.3556640459 & -152.355664045928 \tabularnewline
20 & 10239 & 10156.1783831124 & 82.8216168875861 \tabularnewline
21 & 10253 & 9882.63027726926 & 370.369722730742 \tabularnewline
22 & 11176 & 10899.0860089072 & 276.913991092779 \tabularnewline
23 & 10719 & 10945.1759908449 & -226.175990844853 \tabularnewline
24 & 11817 & 12341.5637732859 & -524.563773285887 \tabularnewline
25 & 12487 & 14073.2128032086 & -1586.21280320859 \tabularnewline
26 & 11519 & 10842.2236003338 & 676.776399666232 \tabularnewline
27 & 12025 & 10957.4059339641 & 1067.59406603586 \tabularnewline
28 & 10976 & 10725.038883043 & 250.961116956965 \tabularnewline
29 & 11276 & 10558.917793876 & 717.082206124007 \tabularnewline
30 & 10657 & 10411.8302498466 & 245.169750153398 \tabularnewline
31 & 11141 & 10890.7702201507 & 250.229779849282 \tabularnewline
32 & 10423 & 10598.141701977 & -175.141701977027 \tabularnewline
33 & 10640 & 10385.1888014977 & 254.811198502292 \tabularnewline
34 & 11426 & 11308.1826205741 & 117.817379425875 \tabularnewline
35 & 10948 & 11022.4283237699 & -74.428323769911 \tabularnewline
36 & 12540 & 12313.0444508282 & 226.955549171846 \tabularnewline
37 & 12200 & 13746.6480487811 & -1546.64804878108 \tabularnewline
38 & 10644 & 11758.23715664 & -1114.23715664002 \tabularnewline
39 & 12044 & 11422.8965847973 & 621.103415202699 \tabularnewline
40 & 11338 & 10582.2289972298 & 755.771002770238 \tabularnewline
41 & 11292 & 10855.7892833037 & 436.210716696343 \tabularnewline
42 & 10612 & 10348.7241910172 & 263.27580898276 \tabularnewline
43 & 10995 & 10837.1081929634 & 157.891807036603 \tabularnewline
44 & 10686 & 10279.5043973035 & 406.495602696463 \tabularnewline
45 & 10635 & 10515.0297350248 & 119.970264975202 \tabularnewline
46 & 11285 & 11313.8034864414 & -28.8034864414385 \tabularnewline
47 & 11475 & 10869.4903887048 & 605.509611295187 \tabularnewline
48 & 12535 & 12575.1871981462 & -40.1871981462227 \tabularnewline
49 & 12490 & 12947.5696777373 & -457.569677737274 \tabularnewline
50 & 12511 & 11596.6993332772 & 914.300666722784 \tabularnewline
51 & 12799 & 12953.4482841086 & -154.448284108636 \tabularnewline
52 & 11876 & 11898.9374357177 & -22.9374357177239 \tabularnewline
53 & 11602 & 11711.0138790662 & -109.013879066179 \tabularnewline
54 & 11062 & 10908.4043670758 & 153.595632924244 \tabularnewline
55 & 11055 & 11299.0286519957 & -244.028651995723 \tabularnewline
56 & 10855 & 10727.6309811663 & 127.369018833655 \tabularnewline
57 & 10704 & 10704.4189010754 & -0.418901075374379 \tabularnewline
58 & 11510 & 11377.9270202569 & 132.072979743103 \tabularnewline
59 & 11663 & 11337.3208362742 & 325.679163725843 \tabularnewline
60 & 12686 & 12589.1265146264 & 96.8734853735641 \tabularnewline
61 & 13516 & 12785.7350668803 & 730.264933119692 \tabularnewline
62 & 12539 & 12618.708971161 & -79.7089711609769 \tabularnewline
63 & 13811 & 13027.7989745024 & 783.20102549755 \tabularnewline
64 & 12354 & 12391.5331482864 & -37.533148286424 \tabularnewline
65 & 11441 & 12151.5031603371 & -710.503160337123 \tabularnewline
66 & 10814 & 11268.8687687211 & -454.868768721075 \tabularnewline
67 & 11261 & 11218.6322179531 & 42.367782046942 \tabularnewline
68 & 10788 & 10954.7148095791 & -166.714809579098 \tabularnewline
69 & 10326 & 10753.3658197995 & -427.365819799486 \tabularnewline
70 & 11490 & 11340.8169405915 & 149.183059408544 \tabularnewline
71 & 11029 & 11411.5950778699 & -382.595077869873 \tabularnewline
72 & 11876 & 12277.219334364 & -401.219334363999 \tabularnewline
\hline
\end{tabular}
%Source: https://freestatistics.org/blog/index.php?pk=271665&T=2

[TABLE]
[ROW][C]Interpolation Forecasts of Exponential Smoothing[/C][/ROW]
[ROW][C]t[/C][C]Observed[/C][C]Fitted[/C][C]Residuals[/C][/ROW]
[ROW][C]13[/C][C]14371[/C][C]14521.4580662393[/C][C]-150.458066239316[/C][/ROW]
[ROW][C]14[/C][C]11695[/C][C]11793.3578043578[/C][C]-98.3578043578218[/C][/ROW]
[ROW][C]15[/C][C]11546[/C][C]11594.990443017[/C][C]-48.9904430169936[/C][/ROW]
[ROW][C]16[/C][C]10922[/C][C]10924.0949417107[/C][C]-2.09494171070401[/C][/ROW]
[ROW][C]17[/C][C]10670[/C][C]10655.1734989121[/C][C]14.8265010878622[/C][/ROW]
[ROW][C]18[/C][C]10254[/C][C]10259.0955016745[/C][C]-5.09550167451562[/C][/ROW]
[ROW][C]19[/C][C]10573[/C][C]10725.3556640459[/C][C]-152.355664045928[/C][/ROW]
[ROW][C]20[/C][C]10239[/C][C]10156.1783831124[/C][C]82.8216168875861[/C][/ROW]
[ROW][C]21[/C][C]10253[/C][C]9882.63027726926[/C][C]370.369722730742[/C][/ROW]
[ROW][C]22[/C][C]11176[/C][C]10899.0860089072[/C][C]276.913991092779[/C][/ROW]
[ROW][C]23[/C][C]10719[/C][C]10945.1759908449[/C][C]-226.175990844853[/C][/ROW]
[ROW][C]24[/C][C]11817[/C][C]12341.5637732859[/C][C]-524.563773285887[/C][/ROW]
[ROW][C]25[/C][C]12487[/C][C]14073.2128032086[/C][C]-1586.21280320859[/C][/ROW]
[ROW][C]26[/C][C]11519[/C][C]10842.2236003338[/C][C]676.776399666232[/C][/ROW]
[ROW][C]27[/C][C]12025[/C][C]10957.4059339641[/C][C]1067.59406603586[/C][/ROW]
[ROW][C]28[/C][C]10976[/C][C]10725.038883043[/C][C]250.961116956965[/C][/ROW]
[ROW][C]29[/C][C]11276[/C][C]10558.917793876[/C][C]717.082206124007[/C][/ROW]
[ROW][C]30[/C][C]10657[/C][C]10411.8302498466[/C][C]245.169750153398[/C][/ROW]
[ROW][C]31[/C][C]11141[/C][C]10890.7702201507[/C][C]250.229779849282[/C][/ROW]
[ROW][C]32[/C][C]10423[/C][C]10598.141701977[/C][C]-175.141701977027[/C][/ROW]
[ROW][C]33[/C][C]10640[/C][C]10385.1888014977[/C][C]254.811198502292[/C][/ROW]
[ROW][C]34[/C][C]11426[/C][C]11308.1826205741[/C][C]117.817379425875[/C][/ROW]
[ROW][C]35[/C][C]10948[/C][C]11022.4283237699[/C][C]-74.428323769911[/C][/ROW]
[ROW][C]36[/C][C]12540[/C][C]12313.0444508282[/C][C]226.955549171846[/C][/ROW]
[ROW][C]37[/C][C]12200[/C][C]13746.6480487811[/C][C]-1546.64804878108[/C][/ROW]
[ROW][C]38[/C][C]10644[/C][C]11758.23715664[/C][C]-1114.23715664002[/C][/ROW]
[ROW][C]39[/C][C]12044[/C][C]11422.8965847973[/C][C]621.103415202699[/C][/ROW]
[ROW][C]40[/C][C]11338[/C][C]10582.2289972298[/C][C]755.771002770238[/C][/ROW]
[ROW][C]41[/C][C]11292[/C][C]10855.7892833037[/C][C]436.210716696343[/C][/ROW]
[ROW][C]42[/C][C]10612[/C][C]10348.7241910172[/C][C]263.27580898276[/C][/ROW]
[ROW][C]43[/C][C]10995[/C][C]10837.1081929634[/C][C]157.891807036603[/C][/ROW]
[ROW][C]44[/C][C]10686[/C][C]10279.5043973035[/C][C]406.495602696463[/C][/ROW]
[ROW][C]45[/C][C]10635[/C][C]10515.0297350248[/C][C]119.970264975202[/C][/ROW]
[ROW][C]46[/C][C]11285[/C][C]11313.8034864414[/C][C]-28.8034864414385[/C][/ROW]
[ROW][C]47[/C][C]11475[/C][C]10869.4903887048[/C][C]605.509611295187[/C][/ROW]
[ROW][C]48[/C][C]12535[/C][C]12575.1871981462[/C][C]-40.1871981462227[/C][/ROW]
[ROW][C]49[/C][C]12490[/C][C]12947.5696777373[/C][C]-457.569677737274[/C][/ROW]
[ROW][C]50[/C][C]12511[/C][C]11596.6993332772[/C][C]914.300666722784[/C][/ROW]
[ROW][C]51[/C][C]12799[/C][C]12953.4482841086[/C][C]-154.448284108636[/C][/ROW]
[ROW][C]52[/C][C]11876[/C][C]11898.9374357177[/C][C]-22.9374357177239[/C][/ROW]
[ROW][C]53[/C][C]11602[/C][C]11711.0138790662[/C][C]-109.013879066179[/C][/ROW]
[ROW][C]54[/C][C]11062[/C][C]10908.4043670758[/C][C]153.595632924244[/C][/ROW]
[ROW][C]55[/C][C]11055[/C][C]11299.0286519957[/C][C]-244.028651995723[/C][/ROW]
[ROW][C]56[/C][C]10855[/C][C]10727.6309811663[/C][C]127.369018833655[/C][/ROW]
[ROW][C]57[/C][C]10704[/C][C]10704.4189010754[/C][C]-0.418901075374379[/C][/ROW]
[ROW][C]58[/C][C]11510[/C][C]11377.9270202569[/C][C]132.072979743103[/C][/ROW]
[ROW][C]59[/C][C]11663[/C][C]11337.3208362742[/C][C]325.679163725843[/C][/ROW]
[ROW][C]60[/C][C]12686[/C][C]12589.1265146264[/C][C]96.8734853735641[/C][/ROW]
[ROW][C]61[/C][C]13516[/C][C]12785.7350668803[/C][C]730.264933119692[/C][/ROW]
[ROW][C]62[/C][C]12539[/C][C]12618.708971161[/C][C]-79.7089711609769[/C][/ROW]
[ROW][C]63[/C][C]13811[/C][C]13027.7989745024[/C][C]783.20102549755[/C][/ROW]
[ROW][C]64[/C][C]12354[/C][C]12391.5331482864[/C][C]-37.533148286424[/C][/ROW]
[ROW][C]65[/C][C]11441[/C][C]12151.5031603371[/C][C]-710.503160337123[/C][/ROW]
[ROW][C]66[/C][C]10814[/C][C]11268.8687687211[/C][C]-454.868768721075[/C][/ROW]
[ROW][C]67[/C][C]11261[/C][C]11218.6322179531[/C][C]42.367782046942[/C][/ROW]
[ROW][C]68[/C][C]10788[/C][C]10954.7148095791[/C][C]-166.714809579098[/C][/ROW]
[ROW][C]69[/C][C]10326[/C][C]10753.3658197995[/C][C]-427.365819799486[/C][/ROW]
[ROW][C]70[/C][C]11490[/C][C]11340.8169405915[/C][C]149.183059408544[/C][/ROW]
[ROW][C]71[/C][C]11029[/C][C]11411.5950778699[/C][C]-382.595077869873[/C][/ROW]
[ROW][C]72[/C][C]11876[/C][C]12277.219334364[/C][C]-401.219334363999[/C][/ROW]
[/TABLE]
Source: https://freestatistics.org/blog/index.php?pk=271665&T=2

Globally Unique Identifier (entire table): ba.freestatistics.org/blog/index.php?pk=271665&T=2

As an alternative you can also use a QR Code:  

The GUIDs for individual cells are displayed in the table below:

Interpolation Forecasts of Exponential Smoothing
tObservedFittedResiduals
131437114521.4580662393-150.458066239316
141169511793.3578043578-98.3578043578218
151154611594.990443017-48.9904430169936
161092210924.0949417107-2.09494171070401
171067010655.173498912114.8265010878622
181025410259.0955016745-5.09550167451562
191057310725.3556640459-152.355664045928
201023910156.178383112482.8216168875861
21102539882.63027726926370.369722730742
221117610899.0860089072276.913991092779
231071910945.1759908449-226.175990844853
241181712341.5637732859-524.563773285887
251248714073.2128032086-1586.21280320859
261151910842.2236003338676.776399666232
271202510957.40593396411067.59406603586
281097610725.038883043250.961116956965
291127610558.917793876717.082206124007
301065710411.8302498466245.169750153398
311114110890.7702201507250.229779849282
321042310598.141701977-175.141701977027
331064010385.1888014977254.811198502292
341142611308.1826205741117.817379425875
351094811022.4283237699-74.428323769911
361254012313.0444508282226.955549171846
371220013746.6480487811-1546.64804878108
381064411758.23715664-1114.23715664002
391204411422.8965847973621.103415202699
401133810582.2289972298755.771002770238
411129210855.7892833037436.210716696343
421061210348.7241910172263.27580898276
431099510837.1081929634157.891807036603
441068610279.5043973035406.495602696463
451063510515.0297350248119.970264975202
461128511313.8034864414-28.8034864414385
471147510869.4903887048605.509611295187
481253512575.1871981462-40.1871981462227
491249012947.5696777373-457.569677737274
501251111596.6993332772914.300666722784
511279912953.4482841086-154.448284108636
521187611898.9374357177-22.9374357177239
531160211711.0138790662-109.013879066179
541106210908.4043670758153.595632924244
551105511299.0286519957-244.028651995723
561085510727.6309811663127.369018833655
571070410704.4189010754-0.418901075374379
581151011377.9270202569132.072979743103
591166311337.3208362742325.679163725843
601268612589.126514626496.8734853735641
611351612785.7350668803730.264933119692
621253912618.708971161-79.7089711609769
631381113027.7989745024783.20102549755
641235412391.5331482864-37.533148286424
651144112151.5031603371-710.503160337123
661081411268.8687687211-454.868768721075
671126111218.632217953142.367782046942
681078810954.7148095791-166.714809579098
691032610753.3658197995-427.365819799486
701149011340.8169405915149.183059408544
711102911411.5950778699-382.595077869873
721187612277.219334364-401.219334363999


Extrapolation Forecasts of Exponential Smoothing
tForecast95% Lower Bound95% Upper Bound
7312633.248055403611656.00105794713610.4950528602
7411756.552042250810714.573883411112798.5302010905
7512663.361981685111560.445269979313766.2786933909
7611292.003725860310131.343541990412452.6639097302
7710700.69276598289485.0288108200611916.3567211455
7810219.62216146228951.3376344955911487.9066884288
7910607.47504271999288.6678427078211926.2822427321
8010214.43139444678846.9668719581311581.8959169352
819933.324560473738518.8755477038311347.7735732436
8210991.72674563969531.8045562107612451.6489350685
8310718.76139476529214.7402550707712222.7825344596
8411715.821375270110168.957975318913262.6847752214

\begin{tabular}{lllllllll}
\hline
Extrapolation Forecasts of Exponential Smoothing \tabularnewline
t & Forecast & 95% Lower Bound & 95% Upper Bound \tabularnewline
73 & 12633.2480554036 & 11656.001057947 & 13610.4950528602 \tabularnewline
74 & 11756.5520422508 & 10714.5738834111 & 12798.5302010905 \tabularnewline
75 & 12663.3619816851 & 11560.4452699793 & 13766.2786933909 \tabularnewline
76 & 11292.0037258603 & 10131.3435419904 & 12452.6639097302 \tabularnewline
77 & 10700.6927659828 & 9485.02881082006 & 11916.3567211455 \tabularnewline
78 & 10219.6221614622 & 8951.33763449559 & 11487.9066884288 \tabularnewline
79 & 10607.4750427199 & 9288.66784270782 & 11926.2822427321 \tabularnewline
80 & 10214.4313944467 & 8846.96687195813 & 11581.8959169352 \tabularnewline
81 & 9933.32456047373 & 8518.87554770383 & 11347.7735732436 \tabularnewline
82 & 10991.7267456396 & 9531.80455621076 & 12451.6489350685 \tabularnewline
83 & 10718.7613947652 & 9214.74025507077 & 12222.7825344596 \tabularnewline
84 & 11715.8213752701 & 10168.9579753189 & 13262.6847752214 \tabularnewline
\hline
\end{tabular}
%Source: https://freestatistics.org/blog/index.php?pk=271665&T=3

[TABLE]
[ROW][C]Extrapolation Forecasts of Exponential Smoothing[/C][/ROW]
[ROW][C]t[/C][C]Forecast[/C][C]95% Lower Bound[/C][C]95% Upper Bound[/C][/ROW]
[ROW][C]73[/C][C]12633.2480554036[/C][C]11656.001057947[/C][C]13610.4950528602[/C][/ROW]
[ROW][C]74[/C][C]11756.5520422508[/C][C]10714.5738834111[/C][C]12798.5302010905[/C][/ROW]
[ROW][C]75[/C][C]12663.3619816851[/C][C]11560.4452699793[/C][C]13766.2786933909[/C][/ROW]
[ROW][C]76[/C][C]11292.0037258603[/C][C]10131.3435419904[/C][C]12452.6639097302[/C][/ROW]
[ROW][C]77[/C][C]10700.6927659828[/C][C]9485.02881082006[/C][C]11916.3567211455[/C][/ROW]
[ROW][C]78[/C][C]10219.6221614622[/C][C]8951.33763449559[/C][C]11487.9066884288[/C][/ROW]
[ROW][C]79[/C][C]10607.4750427199[/C][C]9288.66784270782[/C][C]11926.2822427321[/C][/ROW]
[ROW][C]80[/C][C]10214.4313944467[/C][C]8846.96687195813[/C][C]11581.8959169352[/C][/ROW]
[ROW][C]81[/C][C]9933.32456047373[/C][C]8518.87554770383[/C][C]11347.7735732436[/C][/ROW]
[ROW][C]82[/C][C]10991.7267456396[/C][C]9531.80455621076[/C][C]12451.6489350685[/C][/ROW]
[ROW][C]83[/C][C]10718.7613947652[/C][C]9214.74025507077[/C][C]12222.7825344596[/C][/ROW]
[ROW][C]84[/C][C]11715.8213752701[/C][C]10168.9579753189[/C][C]13262.6847752214[/C][/ROW]
[/TABLE]
Source: https://freestatistics.org/blog/index.php?pk=271665&T=3

Globally Unique Identifier (entire table): ba.freestatistics.org/blog/index.php?pk=271665&T=3

As an alternative you can also use a QR Code:  

The GUIDs for individual cells are displayed in the table below:

Extrapolation Forecasts of Exponential Smoothing
tForecast95% Lower Bound95% Upper Bound
7312633.248055403611656.00105794713610.4950528602
7411756.552042250810714.573883411112798.5302010905
7512663.361981685111560.445269979313766.2786933909
7611292.003725860310131.343541990412452.6639097302
7710700.69276598289485.0288108200611916.3567211455
7810219.62216146228951.3376344955911487.9066884288
7910607.47504271999288.6678427078211926.2822427321
8010214.43139444678846.9668719581311581.8959169352
819933.324560473738518.8755477038311347.7735732436
8210991.72674563969531.8045562107612451.6489350685
8310718.76139476529214.7402550707712222.7825344596
8411715.821375270110168.957975318913262.6847752214


Parameters (Session):
par1 = 12 ; par2 = Triple ; par3 = additive ;
Parameters (R input):
par1 = 12 ; par2 = Triple ; par3 = additive ;
R code (references can be found in the software module):
par1 <- as.numeric(par1)
if (par2 == 'Single') K <- 1
if (par2 == 'Double') K <- 2
if (par2 == 'Triple') K <- par1
nx <- length(x)
nxmK <- nx - K
x <- ts(x, frequency = par1)
if (par2 == 'Single') fit <- HoltWinters(x, gamma=F, beta=F)
if (par2 == 'Double') fit <- HoltWinters(x, gamma=F)
if (par2 == 'Triple') fit <- HoltWinters(x, seasonal=par3)
fit
myresid <- x - fit$fitted[,'xhat']
bitmap(file='test1.png')
op <- par(mfrow=c(2,1))
plot(fit,ylab='Observed (black) / Fitted (red)',main='Interpolation Fit of Exponential Smoothing')
plot(myresid,ylab='Residuals',main='Interpolation Prediction Errors')
par(op)
dev.off()
bitmap(file='test2.png')
p <- predict(fit, par1, prediction.interval=TRUE)
np <- length(p[,1])
plot(fit,p,ylab='Observed (black) / Fitted (red)',main='Extrapolation Fit of Exponential Smoothing')
dev.off()
bitmap(file='test3.png')
op <- par(mfrow = c(2,2))
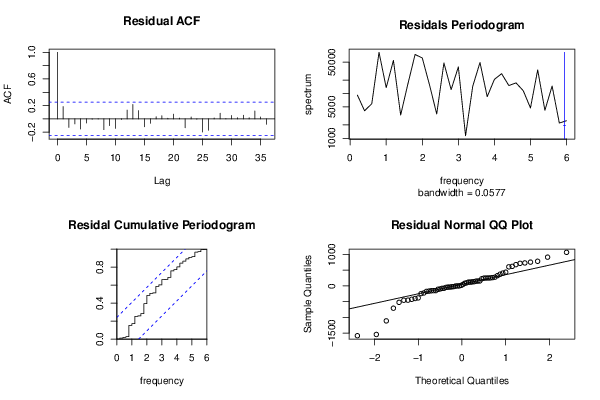
acf(as.numeric(myresid),lag.max = nx/2,main='Residual ACF')
spectrum(myresid,main='Residals Periodogram')
cpgram(myresid,main='Residal Cumulative Periodogram')
qqnorm(myresid,main='Residual Normal QQ Plot')
qqline(myresid)
par(op)
dev.off()
load(file='createtable')
a<-table.start()
a<-table.row.start(a)
a<-table.element(a,'Estimated Parameters of Exponential Smoothing',2,TRUE)
a<-table.row.end(a)
a<-table.row.start(a)
a<-table.element(a,'Parameter',header=TRUE)
a<-table.element(a,'Value',header=TRUE)
a<-table.row.end(a)
a<-table.row.start(a)
a<-table.element(a,'alpha',header=TRUE)
a<-table.element(a,fit$alpha)
a<-table.row.end(a)
a<-table.row.start(a)
a<-table.element(a,'beta',header=TRUE)
a<-table.element(a,fit$beta)
a<-table.row.end(a)
a<-table.row.start(a)
a<-table.element(a,'gamma',header=TRUE)
a<-table.element(a,fit$gamma)
a<-table.row.end(a)
a<-table.end(a)
table.save(a,file='mytable.tab')
a<-table.start()
a<-table.row.start(a)
a<-table.element(a,'Interpolation Forecasts of Exponential Smoothing',4,TRUE)
a<-table.row.end(a)
a<-table.row.start(a)
a<-table.element(a,'t',header=TRUE)
a<-table.element(a,'Observed',header=TRUE)
a<-table.element(a,'Fitted',header=TRUE)
a<-table.element(a,'Residuals',header=TRUE)
a<-table.row.end(a)
for (i in 1:nxmK) {
a<-table.row.start(a)
a<-table.element(a,i+K,header=TRUE)
a<-table.element(a,x[i+K])
a<-table.element(a,fit$fitted[i,'xhat'])
a<-table.element(a,myresid[i])
a<-table.row.end(a)
}
a<-table.end(a)
table.save(a,file='mytable1.tab')
a<-table.start()
a<-table.row.start(a)
a<-table.element(a,'Extrapolation Forecasts of Exponential Smoothing',4,TRUE)
a<-table.row.end(a)
a<-table.row.start(a)
a<-table.element(a,'t',header=TRUE)
a<-table.element(a,'Forecast',header=TRUE)
a<-table.element(a,'95% Lower Bound',header=TRUE)
a<-table.element(a,'95% Upper Bound',header=TRUE)
a<-table.row.end(a)
for (i in 1:np) {
a<-table.row.start(a)
a<-table.element(a,nx+i,header=TRUE)
a<-table.element(a,p[i,'fit'])
a<-table.element(a,p[i,'lwr'])
a<-table.element(a,p[i,'upr'])
a<-table.row.end(a)
}
a<-table.end(a)
table.save(a,file='mytable2.tab')