Free Statistics

of Irreproducible Research!

Author's title

Author*Unverified author*
R Software Modulerwasp_autocorrelation.wasp
Title produced by software(Partial) Autocorrelation Function
Date of computationTue, 30 Dec 2014 10:15:35 +0000
Cite this page as followsStatistical Computations at FreeStatistics.org, Office for Research Development and Education, URL https://freestatistics.org/blog/index.php?v=date/2014/Dec/30/t1419934584d9m1hdc5hmqhv4u.htm/, Retrieved Fri, 17 May 2024 14:18:59 +0000
Statistical Computations at FreeStatistics.org, Office for Research Development and Education, URL https://freestatistics.org/blog/index.php?pk=271718, Retrieved Fri, 17 May 2024 14:18:59 +0000
QR Codes:

Original text written by user:
IsPrivate?No (this computation is public)
User-defined keywords
Estimated Impact113
Family? (F = Feedback message, R = changed R code, M = changed R Module, P = changed Parameters, D = changed Data)
-       [(Partial) Autocorrelation Function] [] [2014-12-30 10:15:35] [bdca4dcc63d0690a1e5c4820657ce42d] [Current]
Feedback Forum

Post a new message
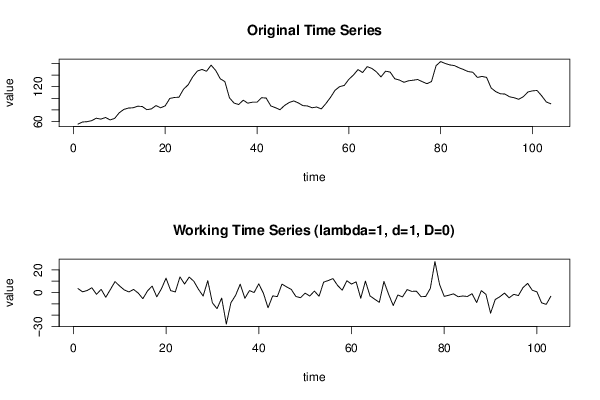
Dataseries X:
55.7
59.2
59.8
61.6
65.8
64.2
67
62.8
65.5
75.2
80.9
83.2
83.7
86.4
85.9
80.4
81.8
87.5
83.7
87
99.7
101.4
101.9
115.7
123.2
136.9
146.8
149.6
146.5
157
147.9
133.6
128.7
100.8
91.8
89.3
96.7
91.6
93.3
93.3
101
100.4
86.9
83.9
80.3
87.7
92.7
95.5
92
87.4
86.8
83.7
85
81.7
90.9
101.5
113.8
120.1
122.1
132.5
140
149.4
144.3
154.4
151.4
145.5
136.8
146.6
145.1
133.6
131.4
127.5
130.1
131.1
132.3
128.6
125.1
128.7
156.1
163.2
159.8
157.4
156.2
152.5
149.4
145.9
144.8
135.9
137.6
136
117.7
111.5
107.8
107.3
102.6
101
98.3
102.7
110.8
112.8
113.4
104.3
93.8
90.5


Summary of computational transaction
Raw Inputview raw input (R code)
Raw Outputview raw output of R engine
Computing time1 seconds
R Server'Sir Maurice George Kendall' @ kendall.wessa.net

\begin{tabular}{lllllllll}
\hline
Summary of computational transaction \tabularnewline
Raw Input & view raw input (R code)  \tabularnewline
Raw Output & view raw output of R engine  \tabularnewline
Computing time & 1 seconds \tabularnewline
R Server & 'Sir Maurice George Kendall' @ kendall.wessa.net \tabularnewline
\hline
\end{tabular}
%Source: https://freestatistics.org/blog/index.php?pk=271718&T=0

[TABLE]
[ROW][C]Summary of computational transaction[/C][/ROW]
[ROW][C]Raw Input[/C][C]view raw input (R code) [/C][/ROW]
[ROW][C]Raw Output[/C][C]view raw output of R engine [/C][/ROW]
[ROW][C]Computing time[/C][C]1 seconds[/C][/ROW]
[ROW][C]R Server[/C][C]'Sir Maurice George Kendall' @ kendall.wessa.net[/C][/ROW]
[/TABLE]
Source: https://freestatistics.org/blog/index.php?pk=271718&T=0

Globally Unique Identifier (entire table): ba.freestatistics.org/blog/index.php?pk=271718&T=0

As an alternative you can also use a QR Code:  

The GUIDs for individual cells are displayed in the table below:

Summary of computational transaction
Raw Inputview raw input (R code)
Raw Outputview raw output of R engine
Computing time1 seconds
R Server'Sir Maurice George Kendall' @ kendall.wessa.net


Autocorrelation Function
Time lag kACF(k)T-STATP-value
10.3463323.51490.000328
20.1490221.51240.066746
30.1000381.01530.156177
40.0874050.88710.188557
5-0.010218-0.10370.458805
6-0.021846-0.22170.412487
7-0.073845-0.74940.227649
8-0.208462-2.11570.018392
9-0.053814-0.54610.293072
10-0.090889-0.92240.179232
110.0773010.78450.217267
12-0.160719-1.63110.05296
13-0.194117-1.97010.025757
14-0.086811-0.8810.190175
150.0865170.87810.19098
160.0703830.71430.238324
170.0096640.09810.461031
180.0910610.92420.178778
190.0854490.86720.193919
200.1128791.14560.127307
210.0337010.3420.366514
22-0.051045-0.5180.302767
23-0.121689-1.2350.109818
24-0.193042-1.95920.026398
25-0.11014-1.11780.133127
26-0.104651-1.06210.145338
27-0.055423-0.56250.287506
28-0.108433-1.10050.136846
29-0.13649-1.38520.084489
30-0.121942-1.23760.109343
310.0329960.33490.369201
320.1020381.03560.151414
330.0312660.31730.375823
340.0294230.29860.382921
350.026890.27290.392737
360.0374640.38020.352284
370.0817080.82920.204442
380.1483371.50550.067634
390.0196290.19920.421243
40-0.038523-0.3910.348315
41-0.025149-0.25520.399524
420.0248370.25210.400743
430.0211390.21450.415277
44-0.071682-0.72750.234287
45-0.216099-2.19320.015272
46-0.117554-1.1930.117797
47-0.070837-0.71890.236909
48-0.005512-0.05590.47775

\begin{tabular}{lllllllll}
\hline
Autocorrelation Function \tabularnewline
Time lag k & ACF(k) & T-STAT & P-value \tabularnewline
1 & 0.346332 & 3.5149 & 0.000328 \tabularnewline
2 & 0.149022 & 1.5124 & 0.066746 \tabularnewline
3 & 0.100038 & 1.0153 & 0.156177 \tabularnewline
4 & 0.087405 & 0.8871 & 0.188557 \tabularnewline
5 & -0.010218 & -0.1037 & 0.458805 \tabularnewline
6 & -0.021846 & -0.2217 & 0.412487 \tabularnewline
7 & -0.073845 & -0.7494 & 0.227649 \tabularnewline
8 & -0.208462 & -2.1157 & 0.018392 \tabularnewline
9 & -0.053814 & -0.5461 & 0.293072 \tabularnewline
10 & -0.090889 & -0.9224 & 0.179232 \tabularnewline
11 & 0.077301 & 0.7845 & 0.217267 \tabularnewline
12 & -0.160719 & -1.6311 & 0.05296 \tabularnewline
13 & -0.194117 & -1.9701 & 0.025757 \tabularnewline
14 & -0.086811 & -0.881 & 0.190175 \tabularnewline
15 & 0.086517 & 0.8781 & 0.19098 \tabularnewline
16 & 0.070383 & 0.7143 & 0.238324 \tabularnewline
17 & 0.009664 & 0.0981 & 0.461031 \tabularnewline
18 & 0.091061 & 0.9242 & 0.178778 \tabularnewline
19 & 0.085449 & 0.8672 & 0.193919 \tabularnewline
20 & 0.112879 & 1.1456 & 0.127307 \tabularnewline
21 & 0.033701 & 0.342 & 0.366514 \tabularnewline
22 & -0.051045 & -0.518 & 0.302767 \tabularnewline
23 & -0.121689 & -1.235 & 0.109818 \tabularnewline
24 & -0.193042 & -1.9592 & 0.026398 \tabularnewline
25 & -0.11014 & -1.1178 & 0.133127 \tabularnewline
26 & -0.104651 & -1.0621 & 0.145338 \tabularnewline
27 & -0.055423 & -0.5625 & 0.287506 \tabularnewline
28 & -0.108433 & -1.1005 & 0.136846 \tabularnewline
29 & -0.13649 & -1.3852 & 0.084489 \tabularnewline
30 & -0.121942 & -1.2376 & 0.109343 \tabularnewline
31 & 0.032996 & 0.3349 & 0.369201 \tabularnewline
32 & 0.102038 & 1.0356 & 0.151414 \tabularnewline
33 & 0.031266 & 0.3173 & 0.375823 \tabularnewline
34 & 0.029423 & 0.2986 & 0.382921 \tabularnewline
35 & 0.02689 & 0.2729 & 0.392737 \tabularnewline
36 & 0.037464 & 0.3802 & 0.352284 \tabularnewline
37 & 0.081708 & 0.8292 & 0.204442 \tabularnewline
38 & 0.148337 & 1.5055 & 0.067634 \tabularnewline
39 & 0.019629 & 0.1992 & 0.421243 \tabularnewline
40 & -0.038523 & -0.391 & 0.348315 \tabularnewline
41 & -0.025149 & -0.2552 & 0.399524 \tabularnewline
42 & 0.024837 & 0.2521 & 0.400743 \tabularnewline
43 & 0.021139 & 0.2145 & 0.415277 \tabularnewline
44 & -0.071682 & -0.7275 & 0.234287 \tabularnewline
45 & -0.216099 & -2.1932 & 0.015272 \tabularnewline
46 & -0.117554 & -1.193 & 0.117797 \tabularnewline
47 & -0.070837 & -0.7189 & 0.236909 \tabularnewline
48 & -0.005512 & -0.0559 & 0.47775 \tabularnewline
\hline
\end{tabular}
%Source: https://freestatistics.org/blog/index.php?pk=271718&T=1

[TABLE]
[ROW][C]Autocorrelation Function[/C][/ROW]
[ROW][C]Time lag k[/C][C]ACF(k)[/C][C]T-STAT[/C][C]P-value[/C][/ROW]
[ROW][C]1[/C][C]0.346332[/C][C]3.5149[/C][C]0.000328[/C][/ROW]
[ROW][C]2[/C][C]0.149022[/C][C]1.5124[/C][C]0.066746[/C][/ROW]
[ROW][C]3[/C][C]0.100038[/C][C]1.0153[/C][C]0.156177[/C][/ROW]
[ROW][C]4[/C][C]0.087405[/C][C]0.8871[/C][C]0.188557[/C][/ROW]
[ROW][C]5[/C][C]-0.010218[/C][C]-0.1037[/C][C]0.458805[/C][/ROW]
[ROW][C]6[/C][C]-0.021846[/C][C]-0.2217[/C][C]0.412487[/C][/ROW]
[ROW][C]7[/C][C]-0.073845[/C][C]-0.7494[/C][C]0.227649[/C][/ROW]
[ROW][C]8[/C][C]-0.208462[/C][C]-2.1157[/C][C]0.018392[/C][/ROW]
[ROW][C]9[/C][C]-0.053814[/C][C]-0.5461[/C][C]0.293072[/C][/ROW]
[ROW][C]10[/C][C]-0.090889[/C][C]-0.9224[/C][C]0.179232[/C][/ROW]
[ROW][C]11[/C][C]0.077301[/C][C]0.7845[/C][C]0.217267[/C][/ROW]
[ROW][C]12[/C][C]-0.160719[/C][C]-1.6311[/C][C]0.05296[/C][/ROW]
[ROW][C]13[/C][C]-0.194117[/C][C]-1.9701[/C][C]0.025757[/C][/ROW]
[ROW][C]14[/C][C]-0.086811[/C][C]-0.881[/C][C]0.190175[/C][/ROW]
[ROW][C]15[/C][C]0.086517[/C][C]0.8781[/C][C]0.19098[/C][/ROW]
[ROW][C]16[/C][C]0.070383[/C][C]0.7143[/C][C]0.238324[/C][/ROW]
[ROW][C]17[/C][C]0.009664[/C][C]0.0981[/C][C]0.461031[/C][/ROW]
[ROW][C]18[/C][C]0.091061[/C][C]0.9242[/C][C]0.178778[/C][/ROW]
[ROW][C]19[/C][C]0.085449[/C][C]0.8672[/C][C]0.193919[/C][/ROW]
[ROW][C]20[/C][C]0.112879[/C][C]1.1456[/C][C]0.127307[/C][/ROW]
[ROW][C]21[/C][C]0.033701[/C][C]0.342[/C][C]0.366514[/C][/ROW]
[ROW][C]22[/C][C]-0.051045[/C][C]-0.518[/C][C]0.302767[/C][/ROW]
[ROW][C]23[/C][C]-0.121689[/C][C]-1.235[/C][C]0.109818[/C][/ROW]
[ROW][C]24[/C][C]-0.193042[/C][C]-1.9592[/C][C]0.026398[/C][/ROW]
[ROW][C]25[/C][C]-0.11014[/C][C]-1.1178[/C][C]0.133127[/C][/ROW]
[ROW][C]26[/C][C]-0.104651[/C][C]-1.0621[/C][C]0.145338[/C][/ROW]
[ROW][C]27[/C][C]-0.055423[/C][C]-0.5625[/C][C]0.287506[/C][/ROW]
[ROW][C]28[/C][C]-0.108433[/C][C]-1.1005[/C][C]0.136846[/C][/ROW]
[ROW][C]29[/C][C]-0.13649[/C][C]-1.3852[/C][C]0.084489[/C][/ROW]
[ROW][C]30[/C][C]-0.121942[/C][C]-1.2376[/C][C]0.109343[/C][/ROW]
[ROW][C]31[/C][C]0.032996[/C][C]0.3349[/C][C]0.369201[/C][/ROW]
[ROW][C]32[/C][C]0.102038[/C][C]1.0356[/C][C]0.151414[/C][/ROW]
[ROW][C]33[/C][C]0.031266[/C][C]0.3173[/C][C]0.375823[/C][/ROW]
[ROW][C]34[/C][C]0.029423[/C][C]0.2986[/C][C]0.382921[/C][/ROW]
[ROW][C]35[/C][C]0.02689[/C][C]0.2729[/C][C]0.392737[/C][/ROW]
[ROW][C]36[/C][C]0.037464[/C][C]0.3802[/C][C]0.352284[/C][/ROW]
[ROW][C]37[/C][C]0.081708[/C][C]0.8292[/C][C]0.204442[/C][/ROW]
[ROW][C]38[/C][C]0.148337[/C][C]1.5055[/C][C]0.067634[/C][/ROW]
[ROW][C]39[/C][C]0.019629[/C][C]0.1992[/C][C]0.421243[/C][/ROW]
[ROW][C]40[/C][C]-0.038523[/C][C]-0.391[/C][C]0.348315[/C][/ROW]
[ROW][C]41[/C][C]-0.025149[/C][C]-0.2552[/C][C]0.399524[/C][/ROW]
[ROW][C]42[/C][C]0.024837[/C][C]0.2521[/C][C]0.400743[/C][/ROW]
[ROW][C]43[/C][C]0.021139[/C][C]0.2145[/C][C]0.415277[/C][/ROW]
[ROW][C]44[/C][C]-0.071682[/C][C]-0.7275[/C][C]0.234287[/C][/ROW]
[ROW][C]45[/C][C]-0.216099[/C][C]-2.1932[/C][C]0.015272[/C][/ROW]
[ROW][C]46[/C][C]-0.117554[/C][C]-1.193[/C][C]0.117797[/C][/ROW]
[ROW][C]47[/C][C]-0.070837[/C][C]-0.7189[/C][C]0.236909[/C][/ROW]
[ROW][C]48[/C][C]-0.005512[/C][C]-0.0559[/C][C]0.47775[/C][/ROW]
[/TABLE]
Source: https://freestatistics.org/blog/index.php?pk=271718&T=1

Globally Unique Identifier (entire table): ba.freestatistics.org/blog/index.php?pk=271718&T=1

As an alternative you can also use a QR Code:  

The GUIDs for individual cells are displayed in the table below:

Autocorrelation Function
Time lag kACF(k)T-STATP-value
10.3463323.51490.000328
20.1490221.51240.066746
30.1000381.01530.156177
40.0874050.88710.188557
5-0.010218-0.10370.458805
6-0.021846-0.22170.412487
7-0.073845-0.74940.227649
8-0.208462-2.11570.018392
9-0.053814-0.54610.293072
10-0.090889-0.92240.179232
110.0773010.78450.217267
12-0.160719-1.63110.05296
13-0.194117-1.97010.025757
14-0.086811-0.8810.190175
150.0865170.87810.19098
160.0703830.71430.238324
170.0096640.09810.461031
180.0910610.92420.178778
190.0854490.86720.193919
200.1128791.14560.127307
210.0337010.3420.366514
22-0.051045-0.5180.302767
23-0.121689-1.2350.109818
24-0.193042-1.95920.026398
25-0.11014-1.11780.133127
26-0.104651-1.06210.145338
27-0.055423-0.56250.287506
28-0.108433-1.10050.136846
29-0.13649-1.38520.084489
30-0.121942-1.23760.109343
310.0329960.33490.369201
320.1020381.03560.151414
330.0312660.31730.375823
340.0294230.29860.382921
350.026890.27290.392737
360.0374640.38020.352284
370.0817080.82920.204442
380.1483371.50550.067634
390.0196290.19920.421243
40-0.038523-0.3910.348315
41-0.025149-0.25520.399524
420.0248370.25210.400743
430.0211390.21450.415277
44-0.071682-0.72750.234287
45-0.216099-2.19320.015272
46-0.117554-1.1930.117797
47-0.070837-0.71890.236909
48-0.005512-0.05590.47775


Partial Autocorrelation Function
Time lag kPACF(k)T-STATP-value
10.3463323.51490.000328
20.0330380.33530.369039
30.0440110.44670.328028
40.0411210.41730.338654
5-0.068175-0.69190.245277
6-0.01053-0.10690.457553
7-0.071402-0.72460.235155
8-0.184341-1.87090.032102
90.1004841.01980.155107
10-0.082429-0.83660.202389
110.1824071.85120.033501
12-0.262894-2.66810.004431
13-0.104861-1.06420.144858
140.0423140.42940.334251
150.1310851.33040.093167
160.0318250.3230.373678
17-0.036372-0.36910.356392
180.0540710.54880.292178
190.0966730.98110.164416
20-0.05604-0.56870.285384
21-0.040001-0.4060.342805
22-0.17124-1.73790.042609
230.036280.36820.35674
24-0.150627-1.52870.064702
25-0.003001-0.03050.487882
26-0.105037-1.0660.144455
270.0956960.97120.16686
28-0.012491-0.12680.449686
29-0.141883-1.440.076456
30-0.130472-1.32410.094192
310.1858581.88630.031039
320.1069431.08530.140151
330.0190270.19310.42363
34-0.20186-2.04870.02152
350.0541630.54970.29186
36-0.078389-0.79560.214058
370.1172631.19010.118374
38-0.04657-0.47260.318737
390.0013190.01340.494672
400.0049590.05030.47998
410.0447310.4540.325402
42-0.102939-1.04470.1493
430.0394620.40050.34481
44-0.053684-0.54480.293523
45-0.056339-0.57180.284358
46-0.10818-1.09790.137402
47-0.040015-0.40610.342752
480.0667020.67690.249979

\begin{tabular}{lllllllll}
\hline
Partial Autocorrelation Function \tabularnewline
Time lag k & PACF(k) & T-STAT & P-value \tabularnewline
1 & 0.346332 & 3.5149 & 0.000328 \tabularnewline
2 & 0.033038 & 0.3353 & 0.369039 \tabularnewline
3 & 0.044011 & 0.4467 & 0.328028 \tabularnewline
4 & 0.041121 & 0.4173 & 0.338654 \tabularnewline
5 & -0.068175 & -0.6919 & 0.245277 \tabularnewline
6 & -0.01053 & -0.1069 & 0.457553 \tabularnewline
7 & -0.071402 & -0.7246 & 0.235155 \tabularnewline
8 & -0.184341 & -1.8709 & 0.032102 \tabularnewline
9 & 0.100484 & 1.0198 & 0.155107 \tabularnewline
10 & -0.082429 & -0.8366 & 0.202389 \tabularnewline
11 & 0.182407 & 1.8512 & 0.033501 \tabularnewline
12 & -0.262894 & -2.6681 & 0.004431 \tabularnewline
13 & -0.104861 & -1.0642 & 0.144858 \tabularnewline
14 & 0.042314 & 0.4294 & 0.334251 \tabularnewline
15 & 0.131085 & 1.3304 & 0.093167 \tabularnewline
16 & 0.031825 & 0.323 & 0.373678 \tabularnewline
17 & -0.036372 & -0.3691 & 0.356392 \tabularnewline
18 & 0.054071 & 0.5488 & 0.292178 \tabularnewline
19 & 0.096673 & 0.9811 & 0.164416 \tabularnewline
20 & -0.05604 & -0.5687 & 0.285384 \tabularnewline
21 & -0.040001 & -0.406 & 0.342805 \tabularnewline
22 & -0.17124 & -1.7379 & 0.042609 \tabularnewline
23 & 0.03628 & 0.3682 & 0.35674 \tabularnewline
24 & -0.150627 & -1.5287 & 0.064702 \tabularnewline
25 & -0.003001 & -0.0305 & 0.487882 \tabularnewline
26 & -0.105037 & -1.066 & 0.144455 \tabularnewline
27 & 0.095696 & 0.9712 & 0.16686 \tabularnewline
28 & -0.012491 & -0.1268 & 0.449686 \tabularnewline
29 & -0.141883 & -1.44 & 0.076456 \tabularnewline
30 & -0.130472 & -1.3241 & 0.094192 \tabularnewline
31 & 0.185858 & 1.8863 & 0.031039 \tabularnewline
32 & 0.106943 & 1.0853 & 0.140151 \tabularnewline
33 & 0.019027 & 0.1931 & 0.42363 \tabularnewline
34 & -0.20186 & -2.0487 & 0.02152 \tabularnewline
35 & 0.054163 & 0.5497 & 0.29186 \tabularnewline
36 & -0.078389 & -0.7956 & 0.214058 \tabularnewline
37 & 0.117263 & 1.1901 & 0.118374 \tabularnewline
38 & -0.04657 & -0.4726 & 0.318737 \tabularnewline
39 & 0.001319 & 0.0134 & 0.494672 \tabularnewline
40 & 0.004959 & 0.0503 & 0.47998 \tabularnewline
41 & 0.044731 & 0.454 & 0.325402 \tabularnewline
42 & -0.102939 & -1.0447 & 0.1493 \tabularnewline
43 & 0.039462 & 0.4005 & 0.34481 \tabularnewline
44 & -0.053684 & -0.5448 & 0.293523 \tabularnewline
45 & -0.056339 & -0.5718 & 0.284358 \tabularnewline
46 & -0.10818 & -1.0979 & 0.137402 \tabularnewline
47 & -0.040015 & -0.4061 & 0.342752 \tabularnewline
48 & 0.066702 & 0.6769 & 0.249979 \tabularnewline
\hline
\end{tabular}
%Source: https://freestatistics.org/blog/index.php?pk=271718&T=2

[TABLE]
[ROW][C]Partial Autocorrelation Function[/C][/ROW]
[ROW][C]Time lag k[/C][C]PACF(k)[/C][C]T-STAT[/C][C]P-value[/C][/ROW]
[ROW][C]1[/C][C]0.346332[/C][C]3.5149[/C][C]0.000328[/C][/ROW]
[ROW][C]2[/C][C]0.033038[/C][C]0.3353[/C][C]0.369039[/C][/ROW]
[ROW][C]3[/C][C]0.044011[/C][C]0.4467[/C][C]0.328028[/C][/ROW]
[ROW][C]4[/C][C]0.041121[/C][C]0.4173[/C][C]0.338654[/C][/ROW]
[ROW][C]5[/C][C]-0.068175[/C][C]-0.6919[/C][C]0.245277[/C][/ROW]
[ROW][C]6[/C][C]-0.01053[/C][C]-0.1069[/C][C]0.457553[/C][/ROW]
[ROW][C]7[/C][C]-0.071402[/C][C]-0.7246[/C][C]0.235155[/C][/ROW]
[ROW][C]8[/C][C]-0.184341[/C][C]-1.8709[/C][C]0.032102[/C][/ROW]
[ROW][C]9[/C][C]0.100484[/C][C]1.0198[/C][C]0.155107[/C][/ROW]
[ROW][C]10[/C][C]-0.082429[/C][C]-0.8366[/C][C]0.202389[/C][/ROW]
[ROW][C]11[/C][C]0.182407[/C][C]1.8512[/C][C]0.033501[/C][/ROW]
[ROW][C]12[/C][C]-0.262894[/C][C]-2.6681[/C][C]0.004431[/C][/ROW]
[ROW][C]13[/C][C]-0.104861[/C][C]-1.0642[/C][C]0.144858[/C][/ROW]
[ROW][C]14[/C][C]0.042314[/C][C]0.4294[/C][C]0.334251[/C][/ROW]
[ROW][C]15[/C][C]0.131085[/C][C]1.3304[/C][C]0.093167[/C][/ROW]
[ROW][C]16[/C][C]0.031825[/C][C]0.323[/C][C]0.373678[/C][/ROW]
[ROW][C]17[/C][C]-0.036372[/C][C]-0.3691[/C][C]0.356392[/C][/ROW]
[ROW][C]18[/C][C]0.054071[/C][C]0.5488[/C][C]0.292178[/C][/ROW]
[ROW][C]19[/C][C]0.096673[/C][C]0.9811[/C][C]0.164416[/C][/ROW]
[ROW][C]20[/C][C]-0.05604[/C][C]-0.5687[/C][C]0.285384[/C][/ROW]
[ROW][C]21[/C][C]-0.040001[/C][C]-0.406[/C][C]0.342805[/C][/ROW]
[ROW][C]22[/C][C]-0.17124[/C][C]-1.7379[/C][C]0.042609[/C][/ROW]
[ROW][C]23[/C][C]0.03628[/C][C]0.3682[/C][C]0.35674[/C][/ROW]
[ROW][C]24[/C][C]-0.150627[/C][C]-1.5287[/C][C]0.064702[/C][/ROW]
[ROW][C]25[/C][C]-0.003001[/C][C]-0.0305[/C][C]0.487882[/C][/ROW]
[ROW][C]26[/C][C]-0.105037[/C][C]-1.066[/C][C]0.144455[/C][/ROW]
[ROW][C]27[/C][C]0.095696[/C][C]0.9712[/C][C]0.16686[/C][/ROW]
[ROW][C]28[/C][C]-0.012491[/C][C]-0.1268[/C][C]0.449686[/C][/ROW]
[ROW][C]29[/C][C]-0.141883[/C][C]-1.44[/C][C]0.076456[/C][/ROW]
[ROW][C]30[/C][C]-0.130472[/C][C]-1.3241[/C][C]0.094192[/C][/ROW]
[ROW][C]31[/C][C]0.185858[/C][C]1.8863[/C][C]0.031039[/C][/ROW]
[ROW][C]32[/C][C]0.106943[/C][C]1.0853[/C][C]0.140151[/C][/ROW]
[ROW][C]33[/C][C]0.019027[/C][C]0.1931[/C][C]0.42363[/C][/ROW]
[ROW][C]34[/C][C]-0.20186[/C][C]-2.0487[/C][C]0.02152[/C][/ROW]
[ROW][C]35[/C][C]0.054163[/C][C]0.5497[/C][C]0.29186[/C][/ROW]
[ROW][C]36[/C][C]-0.078389[/C][C]-0.7956[/C][C]0.214058[/C][/ROW]
[ROW][C]37[/C][C]0.117263[/C][C]1.1901[/C][C]0.118374[/C][/ROW]
[ROW][C]38[/C][C]-0.04657[/C][C]-0.4726[/C][C]0.318737[/C][/ROW]
[ROW][C]39[/C][C]0.001319[/C][C]0.0134[/C][C]0.494672[/C][/ROW]
[ROW][C]40[/C][C]0.004959[/C][C]0.0503[/C][C]0.47998[/C][/ROW]
[ROW][C]41[/C][C]0.044731[/C][C]0.454[/C][C]0.325402[/C][/ROW]
[ROW][C]42[/C][C]-0.102939[/C][C]-1.0447[/C][C]0.1493[/C][/ROW]
[ROW][C]43[/C][C]0.039462[/C][C]0.4005[/C][C]0.34481[/C][/ROW]
[ROW][C]44[/C][C]-0.053684[/C][C]-0.5448[/C][C]0.293523[/C][/ROW]
[ROW][C]45[/C][C]-0.056339[/C][C]-0.5718[/C][C]0.284358[/C][/ROW]
[ROW][C]46[/C][C]-0.10818[/C][C]-1.0979[/C][C]0.137402[/C][/ROW]
[ROW][C]47[/C][C]-0.040015[/C][C]-0.4061[/C][C]0.342752[/C][/ROW]
[ROW][C]48[/C][C]0.066702[/C][C]0.6769[/C][C]0.249979[/C][/ROW]
[/TABLE]
Source: https://freestatistics.org/blog/index.php?pk=271718&T=2

Globally Unique Identifier (entire table): ba.freestatistics.org/blog/index.php?pk=271718&T=2

As an alternative you can also use a QR Code:  

The GUIDs for individual cells are displayed in the table below:

Partial Autocorrelation Function
Time lag kPACF(k)T-STATP-value
10.3463323.51490.000328
20.0330380.33530.369039
30.0440110.44670.328028
40.0411210.41730.338654
5-0.068175-0.69190.245277
6-0.01053-0.10690.457553
7-0.071402-0.72460.235155
8-0.184341-1.87090.032102
90.1004841.01980.155107
10-0.082429-0.83660.202389
110.1824071.85120.033501
12-0.262894-2.66810.004431
13-0.104861-1.06420.144858
140.0423140.42940.334251
150.1310851.33040.093167
160.0318250.3230.373678
17-0.036372-0.36910.356392
180.0540710.54880.292178
190.0966730.98110.164416
20-0.05604-0.56870.285384
21-0.040001-0.4060.342805
22-0.17124-1.73790.042609
230.036280.36820.35674
24-0.150627-1.52870.064702
25-0.003001-0.03050.487882
26-0.105037-1.0660.144455
270.0956960.97120.16686
28-0.012491-0.12680.449686
29-0.141883-1.440.076456
30-0.130472-1.32410.094192
310.1858581.88630.031039
320.1069431.08530.140151
330.0190270.19310.42363
34-0.20186-2.04870.02152
350.0541630.54970.29186
36-0.078389-0.79560.214058
370.1172631.19010.118374
38-0.04657-0.47260.318737
390.0013190.01340.494672
400.0049590.05030.47998
410.0447310.4540.325402
42-0.102939-1.04470.1493
430.0394620.40050.34481
44-0.053684-0.54480.293523
45-0.056339-0.57180.284358
46-0.10818-1.09790.137402
47-0.040015-0.40610.342752
480.0667020.67690.249979


Parameters (Session):
par1 = 48 ; par2 = 1 ; par3 = 1 ; par4 = 0 ; par5 = 12 ; par6 = White Noise ; par7 = 0.95 ;
Parameters (R input):
par1 = 48 ; par2 = 1 ; par3 = 1 ; par4 = 0 ; par5 = 12 ; par6 = White Noise ; par7 = 0.95 ; par8 = ;
R code (references can be found in the software module):
par8 <- ''
par7 <- '0.95'
par6 <- 'White Noise'
par5 <- '12'
par4 <- '0'
par3 <- '0'
par2 <- '1'
par1 <- '48'
if (par1 == 'Default') {
par1 = 10*log10(length(x))
} else {
par1 <- as.numeric(par1)
}
par2 <- as.numeric(par2)
par3 <- as.numeric(par3)
par4 <- as.numeric(par4)
par5 <- as.numeric(par5)
if (par6 == 'White Noise') par6 <- 'white' else par6 <- 'ma'
par7 <- as.numeric(par7)
if (par8 != '') par8 <- as.numeric(par8)
ox <- x
if (par8 == '') {
if (par2 == 0) {
x <- log(x)
} else {
x <- (x ^ par2 - 1) / par2
}
} else {
x <- log(x,base=par8)
}
if (par3 > 0) x <- diff(x,lag=1,difference=par3)
if (par4 > 0) x <- diff(x,lag=par5,difference=par4)
bitmap(file='picts.png')
op <- par(mfrow=c(2,1))
plot(ox,type='l',main='Original Time Series',xlab='time',ylab='value')
if (par8=='') {
mytitle <- paste('Working Time Series (lambda=',par2,', d=',par3,', D=',par4,')',sep='')
mysub <- paste('(lambda=',par2,', d=',par3,', D=',par4,', CI=', par7, ', CI type=',par6,')',sep='')
} else {
mytitle <- paste('Working Time Series (base=',par8,', d=',par3,', D=',par4,')',sep='')
mysub <- paste('(base=',par8,', d=',par3,', D=',par4,', CI=', par7, ', CI type=',par6,')',sep='')
}
plot(x,type='l', main=mytitle,xlab='time',ylab='value')
par(op)
dev.off()
bitmap(file='pic1.png')
racf <- acf(x, par1, main='Autocorrelation', xlab='time lag', ylab='ACF', ci.type=par6, ci=par7, sub=mysub)
dev.off()
bitmap(file='pic2.png')
rpacf <- pacf(x,par1,main='Partial Autocorrelation',xlab='lags',ylab='PACF',sub=mysub)
dev.off()
(myacf <- c(racf$acf))
(mypacf <- c(rpacf$acf))
lengthx <- length(x)
sqrtn <- sqrt(lengthx)
load(file='createtable')
a<-table.start()
a<-table.row.start(a)
a<-table.element(a,'Autocorrelation Function',4,TRUE)
a<-table.row.end(a)
a<-table.row.start(a)
a<-table.element(a,'Time lag k',header=TRUE)
a<-table.element(a,hyperlink('basics.htm','ACF(k)','click here for more information about the Autocorrelation Function'),header=TRUE)
a<-table.element(a,'T-STAT',header=TRUE)
a<-table.element(a,'P-value',header=TRUE)
a<-table.row.end(a)
for (i in 2:(par1+1)) {
a<-table.row.start(a)
a<-table.element(a,i-1,header=TRUE)
a<-table.element(a,round(myacf[i],6))
mytstat <- myacf[i]*sqrtn
a<-table.element(a,round(mytstat,4))
a<-table.element(a,round(1-pt(abs(mytstat),lengthx),6))
a<-table.row.end(a)
}
a<-table.end(a)
table.save(a,file='mytable.tab')
a<-table.start()
a<-table.row.start(a)
a<-table.element(a,'Partial Autocorrelation Function',4,TRUE)
a<-table.row.end(a)
a<-table.row.start(a)
a<-table.element(a,'Time lag k',header=TRUE)
a<-table.element(a,hyperlink('basics.htm','PACF(k)','click here for more information about the Partial Autocorrelation Function'),header=TRUE)
a<-table.element(a,'T-STAT',header=TRUE)
a<-table.element(a,'P-value',header=TRUE)
a<-table.row.end(a)
for (i in 1:par1) {
a<-table.row.start(a)
a<-table.element(a,i,header=TRUE)
a<-table.element(a,round(mypacf[i],6))
mytstat <- mypacf[i]*sqrtn
a<-table.element(a,round(mytstat,4))
a<-table.element(a,round(1-pt(abs(mytstat),lengthx),6))
a<-table.row.end(a)
}
a<-table.end(a)
table.save(a,file='mytable1.tab')