Free Statistics

of Irreproducible Research!

Author's title

Author*Unverified author*
R Software Modulerwasp_autocorrelation.wasp
Title produced by software(Partial) Autocorrelation Function
Date of computationTue, 30 Dec 2014 10:22:17 +0000
Cite this page as followsStatistical Computations at FreeStatistics.org, Office for Research Development and Education, URL https://freestatistics.org/blog/index.php?v=date/2014/Dec/30/t1419935016g41fzy479nsstg4.htm/, Retrieved Fri, 17 May 2024 16:16:00 +0000
Statistical Computations at FreeStatistics.org, Office for Research Development and Education, URL https://freestatistics.org/blog/index.php?pk=271719, Retrieved Fri, 17 May 2024 16:16:00 +0000
QR Codes:

Original text written by user:
IsPrivate?No (this computation is public)
User-defined keywords
Estimated Impact111
Family? (F = Feedback message, R = changed R code, M = changed R Module, P = changed Parameters, D = changed Data)
-     [(Partial) Autocorrelation Function] [Autocorrelation g...] [2014-10-19 21:19:25] [b1f04123d82573d686ac8c7adc52feaa]
- R  D    [(Partial) Autocorrelation Function] [] [2014-12-30 10:22:17] [c260288012d574817ee98c3ddd4d9474] [Current]
Feedback Forum

Post a new message
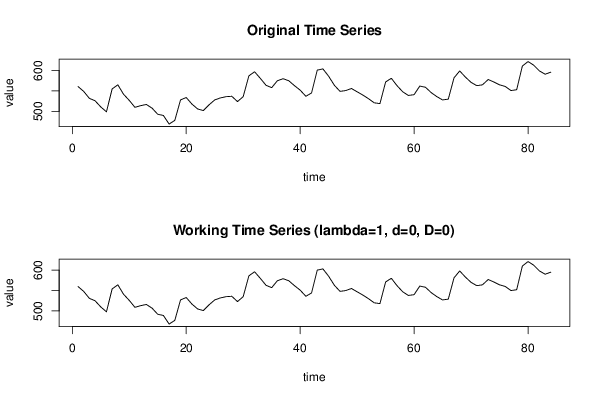
Dataseries X:
561
549
532
526
511
499
555
565
542
527
510
514
517
508
493
490
469
478
528
534
518
506
502
516
528
533
536
537
524
536
587
597
581
564
558
575
580
575
563
552
537
545
601
604
586
564
549
551
556
548
540
531
521
519
572
581
563
548
539
541
562
559
546
536
528
530
582
599
584
571
563
565
578
572
565
561
551
553
611
622
613
599
591
596


Summary of computational transaction
Raw Inputview raw input (R code)
Raw Outputview raw output of R engine
Computing time2 seconds
R Server'George Udny Yule' @ yule.wessa.net

\begin{tabular}{lllllllll}
\hline
Summary of computational transaction \tabularnewline
Raw Input & view raw input (R code)  \tabularnewline
Raw Output & view raw output of R engine  \tabularnewline
Computing time & 2 seconds \tabularnewline
R Server & 'George Udny Yule' @ yule.wessa.net \tabularnewline
\hline
\end{tabular}
%Source: https://freestatistics.org/blog/index.php?pk=271719&T=0

[TABLE]
[ROW][C]Summary of computational transaction[/C][/ROW]
[ROW][C]Raw Input[/C][C]view raw input (R code) [/C][/ROW]
[ROW][C]Raw Output[/C][C]view raw output of R engine [/C][/ROW]
[ROW][C]Computing time[/C][C]2 seconds[/C][/ROW]
[ROW][C]R Server[/C][C]'George Udny Yule' @ yule.wessa.net[/C][/ROW]
[/TABLE]
Source: https://freestatistics.org/blog/index.php?pk=271719&T=0

Globally Unique Identifier (entire table): ba.freestatistics.org/blog/index.php?pk=271719&T=0

As an alternative you can also use a QR Code:  

The GUIDs for individual cells are displayed in the table below:

Summary of computational transaction
Raw Inputview raw input (R code)
Raw Outputview raw output of R engine
Computing time2 seconds
R Server'George Udny Yule' @ yule.wessa.net


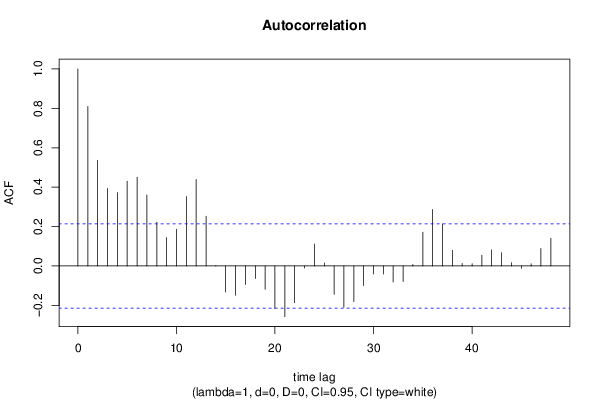
Autocorrelation Function
Time lag kACF(k)T-STATP-value
10.8095047.41920
20.5360894.91332e-06
30.3928543.60060.000268
40.3724313.41340.000495
50.4296973.93828.4e-05
60.4501244.12554.3e-05
70.3605013.3040.000701
80.221922.03390.022557
90.1439331.31920.095348
100.1865081.70940.045537
110.3523753.22960.000885
120.4387184.02096.3e-05
130.2522392.31180.011618
140.0017750.01630.493528
15-0.13256-1.21490.113897
16-0.149072-1.36630.087751
17-0.094382-0.8650.194745
18-0.064086-0.58740.279269
19-0.118764-1.08850.139746
20-0.215718-1.97710.025656
21-0.257353-2.35870.010331
22-0.186684-1.7110.045387
23-0.010408-0.09540.462114
240.1111121.01840.155717
250.0150450.13790.445327
26-0.14411-1.32080.095079
27-0.210034-1.9250.028807
28-0.180262-1.65210.051121
29-0.099056-0.90790.183273
30-0.041107-0.37670.353655
31-0.040748-0.37350.354873
32-0.081601-0.74790.22831
33-0.078892-0.72310.235827
340.0072790.06670.473486
350.1714781.57160.059899
360.2863412.62440.005155
370.2129921.95210.027128
380.0791650.72560.235063
390.0122880.11260.4553
400.0116330.10660.457674
410.0541050.49590.310637
420.0818380.75010.227657
430.066740.61170.271199
440.0166060.15220.4397
45-0.012088-0.11080.456023
460.0106080.09720.461389
470.0884880.8110.209826
480.1399311.28250.101599

\begin{tabular}{lllllllll}
\hline
Autocorrelation Function \tabularnewline
Time lag k & ACF(k) & T-STAT & P-value \tabularnewline
1 & 0.809504 & 7.4192 & 0 \tabularnewline
2 & 0.536089 & 4.9133 & 2e-06 \tabularnewline
3 & 0.392854 & 3.6006 & 0.000268 \tabularnewline
4 & 0.372431 & 3.4134 & 0.000495 \tabularnewline
5 & 0.429697 & 3.9382 & 8.4e-05 \tabularnewline
6 & 0.450124 & 4.1255 & 4.3e-05 \tabularnewline
7 & 0.360501 & 3.304 & 0.000701 \tabularnewline
8 & 0.22192 & 2.0339 & 0.022557 \tabularnewline
9 & 0.143933 & 1.3192 & 0.095348 \tabularnewline
10 & 0.186508 & 1.7094 & 0.045537 \tabularnewline
11 & 0.352375 & 3.2296 & 0.000885 \tabularnewline
12 & 0.438718 & 4.0209 & 6.3e-05 \tabularnewline
13 & 0.252239 & 2.3118 & 0.011618 \tabularnewline
14 & 0.001775 & 0.0163 & 0.493528 \tabularnewline
15 & -0.13256 & -1.2149 & 0.113897 \tabularnewline
16 & -0.149072 & -1.3663 & 0.087751 \tabularnewline
17 & -0.094382 & -0.865 & 0.194745 \tabularnewline
18 & -0.064086 & -0.5874 & 0.279269 \tabularnewline
19 & -0.118764 & -1.0885 & 0.139746 \tabularnewline
20 & -0.215718 & -1.9771 & 0.025656 \tabularnewline
21 & -0.257353 & -2.3587 & 0.010331 \tabularnewline
22 & -0.186684 & -1.711 & 0.045387 \tabularnewline
23 & -0.010408 & -0.0954 & 0.462114 \tabularnewline
24 & 0.111112 & 1.0184 & 0.155717 \tabularnewline
25 & 0.015045 & 0.1379 & 0.445327 \tabularnewline
26 & -0.14411 & -1.3208 & 0.095079 \tabularnewline
27 & -0.210034 & -1.925 & 0.028807 \tabularnewline
28 & -0.180262 & -1.6521 & 0.051121 \tabularnewline
29 & -0.099056 & -0.9079 & 0.183273 \tabularnewline
30 & -0.041107 & -0.3767 & 0.353655 \tabularnewline
31 & -0.040748 & -0.3735 & 0.354873 \tabularnewline
32 & -0.081601 & -0.7479 & 0.22831 \tabularnewline
33 & -0.078892 & -0.7231 & 0.235827 \tabularnewline
34 & 0.007279 & 0.0667 & 0.473486 \tabularnewline
35 & 0.171478 & 1.5716 & 0.059899 \tabularnewline
36 & 0.286341 & 2.6244 & 0.005155 \tabularnewline
37 & 0.212992 & 1.9521 & 0.027128 \tabularnewline
38 & 0.079165 & 0.7256 & 0.235063 \tabularnewline
39 & 0.012288 & 0.1126 & 0.4553 \tabularnewline
40 & 0.011633 & 0.1066 & 0.457674 \tabularnewline
41 & 0.054105 & 0.4959 & 0.310637 \tabularnewline
42 & 0.081838 & 0.7501 & 0.227657 \tabularnewline
43 & 0.06674 & 0.6117 & 0.271199 \tabularnewline
44 & 0.016606 & 0.1522 & 0.4397 \tabularnewline
45 & -0.012088 & -0.1108 & 0.456023 \tabularnewline
46 & 0.010608 & 0.0972 & 0.461389 \tabularnewline
47 & 0.088488 & 0.811 & 0.209826 \tabularnewline
48 & 0.139931 & 1.2825 & 0.101599 \tabularnewline
\hline
\end{tabular}
%Source: https://freestatistics.org/blog/index.php?pk=271719&T=1

[TABLE]
[ROW][C]Autocorrelation Function[/C][/ROW]
[ROW][C]Time lag k[/C][C]ACF(k)[/C][C]T-STAT[/C][C]P-value[/C][/ROW]
[ROW][C]1[/C][C]0.809504[/C][C]7.4192[/C][C]0[/C][/ROW]
[ROW][C]2[/C][C]0.536089[/C][C]4.9133[/C][C]2e-06[/C][/ROW]
[ROW][C]3[/C][C]0.392854[/C][C]3.6006[/C][C]0.000268[/C][/ROW]
[ROW][C]4[/C][C]0.372431[/C][C]3.4134[/C][C]0.000495[/C][/ROW]
[ROW][C]5[/C][C]0.429697[/C][C]3.9382[/C][C]8.4e-05[/C][/ROW]
[ROW][C]6[/C][C]0.450124[/C][C]4.1255[/C][C]4.3e-05[/C][/ROW]
[ROW][C]7[/C][C]0.360501[/C][C]3.304[/C][C]0.000701[/C][/ROW]
[ROW][C]8[/C][C]0.22192[/C][C]2.0339[/C][C]0.022557[/C][/ROW]
[ROW][C]9[/C][C]0.143933[/C][C]1.3192[/C][C]0.095348[/C][/ROW]
[ROW][C]10[/C][C]0.186508[/C][C]1.7094[/C][C]0.045537[/C][/ROW]
[ROW][C]11[/C][C]0.352375[/C][C]3.2296[/C][C]0.000885[/C][/ROW]
[ROW][C]12[/C][C]0.438718[/C][C]4.0209[/C][C]6.3e-05[/C][/ROW]
[ROW][C]13[/C][C]0.252239[/C][C]2.3118[/C][C]0.011618[/C][/ROW]
[ROW][C]14[/C][C]0.001775[/C][C]0.0163[/C][C]0.493528[/C][/ROW]
[ROW][C]15[/C][C]-0.13256[/C][C]-1.2149[/C][C]0.113897[/C][/ROW]
[ROW][C]16[/C][C]-0.149072[/C][C]-1.3663[/C][C]0.087751[/C][/ROW]
[ROW][C]17[/C][C]-0.094382[/C][C]-0.865[/C][C]0.194745[/C][/ROW]
[ROW][C]18[/C][C]-0.064086[/C][C]-0.5874[/C][C]0.279269[/C][/ROW]
[ROW][C]19[/C][C]-0.118764[/C][C]-1.0885[/C][C]0.139746[/C][/ROW]
[ROW][C]20[/C][C]-0.215718[/C][C]-1.9771[/C][C]0.025656[/C][/ROW]
[ROW][C]21[/C][C]-0.257353[/C][C]-2.3587[/C][C]0.010331[/C][/ROW]
[ROW][C]22[/C][C]-0.186684[/C][C]-1.711[/C][C]0.045387[/C][/ROW]
[ROW][C]23[/C][C]-0.010408[/C][C]-0.0954[/C][C]0.462114[/C][/ROW]
[ROW][C]24[/C][C]0.111112[/C][C]1.0184[/C][C]0.155717[/C][/ROW]
[ROW][C]25[/C][C]0.015045[/C][C]0.1379[/C][C]0.445327[/C][/ROW]
[ROW][C]26[/C][C]-0.14411[/C][C]-1.3208[/C][C]0.095079[/C][/ROW]
[ROW][C]27[/C][C]-0.210034[/C][C]-1.925[/C][C]0.028807[/C][/ROW]
[ROW][C]28[/C][C]-0.180262[/C][C]-1.6521[/C][C]0.051121[/C][/ROW]
[ROW][C]29[/C][C]-0.099056[/C][C]-0.9079[/C][C]0.183273[/C][/ROW]
[ROW][C]30[/C][C]-0.041107[/C][C]-0.3767[/C][C]0.353655[/C][/ROW]
[ROW][C]31[/C][C]-0.040748[/C][C]-0.3735[/C][C]0.354873[/C][/ROW]
[ROW][C]32[/C][C]-0.081601[/C][C]-0.7479[/C][C]0.22831[/C][/ROW]
[ROW][C]33[/C][C]-0.078892[/C][C]-0.7231[/C][C]0.235827[/C][/ROW]
[ROW][C]34[/C][C]0.007279[/C][C]0.0667[/C][C]0.473486[/C][/ROW]
[ROW][C]35[/C][C]0.171478[/C][C]1.5716[/C][C]0.059899[/C][/ROW]
[ROW][C]36[/C][C]0.286341[/C][C]2.6244[/C][C]0.005155[/C][/ROW]
[ROW][C]37[/C][C]0.212992[/C][C]1.9521[/C][C]0.027128[/C][/ROW]
[ROW][C]38[/C][C]0.079165[/C][C]0.7256[/C][C]0.235063[/C][/ROW]
[ROW][C]39[/C][C]0.012288[/C][C]0.1126[/C][C]0.4553[/C][/ROW]
[ROW][C]40[/C][C]0.011633[/C][C]0.1066[/C][C]0.457674[/C][/ROW]
[ROW][C]41[/C][C]0.054105[/C][C]0.4959[/C][C]0.310637[/C][/ROW]
[ROW][C]42[/C][C]0.081838[/C][C]0.7501[/C][C]0.227657[/C][/ROW]
[ROW][C]43[/C][C]0.06674[/C][C]0.6117[/C][C]0.271199[/C][/ROW]
[ROW][C]44[/C][C]0.016606[/C][C]0.1522[/C][C]0.4397[/C][/ROW]
[ROW][C]45[/C][C]-0.012088[/C][C]-0.1108[/C][C]0.456023[/C][/ROW]
[ROW][C]46[/C][C]0.010608[/C][C]0.0972[/C][C]0.461389[/C][/ROW]
[ROW][C]47[/C][C]0.088488[/C][C]0.811[/C][C]0.209826[/C][/ROW]
[ROW][C]48[/C][C]0.139931[/C][C]1.2825[/C][C]0.101599[/C][/ROW]
[/TABLE]
Source: https://freestatistics.org/blog/index.php?pk=271719&T=1

Globally Unique Identifier (entire table): ba.freestatistics.org/blog/index.php?pk=271719&T=1

As an alternative you can also use a QR Code:  

The GUIDs for individual cells are displayed in the table below:

Autocorrelation Function
Time lag kACF(k)T-STATP-value
10.8095047.41920
20.5360894.91332e-06
30.3928543.60060.000268
40.3724313.41340.000495
50.4296973.93828.4e-05
60.4501244.12554.3e-05
70.3605013.3040.000701
80.221922.03390.022557
90.1439331.31920.095348
100.1865081.70940.045537
110.3523753.22960.000885
120.4387184.02096.3e-05
130.2522392.31180.011618
140.0017750.01630.493528
15-0.13256-1.21490.113897
16-0.149072-1.36630.087751
17-0.094382-0.8650.194745
18-0.064086-0.58740.279269
19-0.118764-1.08850.139746
20-0.215718-1.97710.025656
21-0.257353-2.35870.010331
22-0.186684-1.7110.045387
23-0.010408-0.09540.462114
240.1111121.01840.155717
250.0150450.13790.445327
26-0.14411-1.32080.095079
27-0.210034-1.9250.028807
28-0.180262-1.65210.051121
29-0.099056-0.90790.183273
30-0.041107-0.37670.353655
31-0.040748-0.37350.354873
32-0.081601-0.74790.22831
33-0.078892-0.72310.235827
340.0072790.06670.473486
350.1714781.57160.059899
360.2863412.62440.005155
370.2129921.95210.027128
380.0791650.72560.235063
390.0122880.11260.4553
400.0116330.10660.457674
410.0541050.49590.310637
420.0818380.75010.227657
430.066740.61170.271199
440.0166060.15220.4397
45-0.012088-0.11080.456023
460.0106080.09720.461389
470.0884880.8110.209826
480.1399311.28250.101599


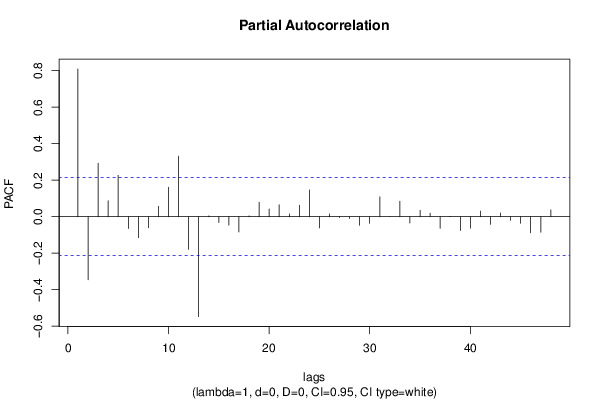
Partial Autocorrelation Function
Time lag kPACF(k)T-STATP-value
10.8095047.41920
2-0.345828-3.16960.001065
30.2924742.68060.004422
40.0870280.79760.213668
50.2265182.07610.020472
6-0.064735-0.59330.277285
7-0.114774-1.05190.147927
8-0.060564-0.55510.290158
90.0569230.52170.301625
100.1613361.47870.071485
110.3317333.04040.001575
12-0.179067-1.64120.05225
13-0.547646-5.01931e-06
140.0046480.04260.483059
15-0.031565-0.28930.386534
16-0.046144-0.42290.336719
17-0.083773-0.76780.222381
180.0043990.04030.483968
190.0793360.72710.234585
200.0422840.38750.349669
210.0658750.60380.273817
220.0147010.13470.446571
230.0628140.57570.28318
240.1461991.33990.091939
25-0.061448-0.56320.287405
260.0147730.13540.446309
27-0.004269-0.03910.484443
28-0.009633-0.08830.464928
29-0.04649-0.42610.335567
30-0.036419-0.33380.369686
310.1086750.9960.16105
321.2e-051e-040.499956
330.0848080.77730.21959
34-0.03448-0.3160.376387
350.0346530.31760.375787
360.0187470.17180.431998
37-0.063721-0.5840.280388
380.0007410.00680.4973
39-0.076036-0.69690.2439
40-0.062831-0.57590.283125
410.0307290.28160.389456
42-0.042301-0.38770.349611
430.0200120.18340.427459
44-0.02032-0.18620.426353
45-0.03597-0.32970.371236
46-0.088019-0.80670.211058
47-0.085413-0.78280.217967
480.0372380.34130.366868

\begin{tabular}{lllllllll}
\hline
Partial Autocorrelation Function \tabularnewline
Time lag k & PACF(k) & T-STAT & P-value \tabularnewline
1 & 0.809504 & 7.4192 & 0 \tabularnewline
2 & -0.345828 & -3.1696 & 0.001065 \tabularnewline
3 & 0.292474 & 2.6806 & 0.004422 \tabularnewline
4 & 0.087028 & 0.7976 & 0.213668 \tabularnewline
5 & 0.226518 & 2.0761 & 0.020472 \tabularnewline
6 & -0.064735 & -0.5933 & 0.277285 \tabularnewline
7 & -0.114774 & -1.0519 & 0.147927 \tabularnewline
8 & -0.060564 & -0.5551 & 0.290158 \tabularnewline
9 & 0.056923 & 0.5217 & 0.301625 \tabularnewline
10 & 0.161336 & 1.4787 & 0.071485 \tabularnewline
11 & 0.331733 & 3.0404 & 0.001575 \tabularnewline
12 & -0.179067 & -1.6412 & 0.05225 \tabularnewline
13 & -0.547646 & -5.0193 & 1e-06 \tabularnewline
14 & 0.004648 & 0.0426 & 0.483059 \tabularnewline
15 & -0.031565 & -0.2893 & 0.386534 \tabularnewline
16 & -0.046144 & -0.4229 & 0.336719 \tabularnewline
17 & -0.083773 & -0.7678 & 0.222381 \tabularnewline
18 & 0.004399 & 0.0403 & 0.483968 \tabularnewline
19 & 0.079336 & 0.7271 & 0.234585 \tabularnewline
20 & 0.042284 & 0.3875 & 0.349669 \tabularnewline
21 & 0.065875 & 0.6038 & 0.273817 \tabularnewline
22 & 0.014701 & 0.1347 & 0.446571 \tabularnewline
23 & 0.062814 & 0.5757 & 0.28318 \tabularnewline
24 & 0.146199 & 1.3399 & 0.091939 \tabularnewline
25 & -0.061448 & -0.5632 & 0.287405 \tabularnewline
26 & 0.014773 & 0.1354 & 0.446309 \tabularnewline
27 & -0.004269 & -0.0391 & 0.484443 \tabularnewline
28 & -0.009633 & -0.0883 & 0.464928 \tabularnewline
29 & -0.04649 & -0.4261 & 0.335567 \tabularnewline
30 & -0.036419 & -0.3338 & 0.369686 \tabularnewline
31 & 0.108675 & 0.996 & 0.16105 \tabularnewline
32 & 1.2e-05 & 1e-04 & 0.499956 \tabularnewline
33 & 0.084808 & 0.7773 & 0.21959 \tabularnewline
34 & -0.03448 & -0.316 & 0.376387 \tabularnewline
35 & 0.034653 & 0.3176 & 0.375787 \tabularnewline
36 & 0.018747 & 0.1718 & 0.431998 \tabularnewline
37 & -0.063721 & -0.584 & 0.280388 \tabularnewline
38 & 0.000741 & 0.0068 & 0.4973 \tabularnewline
39 & -0.076036 & -0.6969 & 0.2439 \tabularnewline
40 & -0.062831 & -0.5759 & 0.283125 \tabularnewline
41 & 0.030729 & 0.2816 & 0.389456 \tabularnewline
42 & -0.042301 & -0.3877 & 0.349611 \tabularnewline
43 & 0.020012 & 0.1834 & 0.427459 \tabularnewline
44 & -0.02032 & -0.1862 & 0.426353 \tabularnewline
45 & -0.03597 & -0.3297 & 0.371236 \tabularnewline
46 & -0.088019 & -0.8067 & 0.211058 \tabularnewline
47 & -0.085413 & -0.7828 & 0.217967 \tabularnewline
48 & 0.037238 & 0.3413 & 0.366868 \tabularnewline
\hline
\end{tabular}
%Source: https://freestatistics.org/blog/index.php?pk=271719&T=2

[TABLE]
[ROW][C]Partial Autocorrelation Function[/C][/ROW]
[ROW][C]Time lag k[/C][C]PACF(k)[/C][C]T-STAT[/C][C]P-value[/C][/ROW]
[ROW][C]1[/C][C]0.809504[/C][C]7.4192[/C][C]0[/C][/ROW]
[ROW][C]2[/C][C]-0.345828[/C][C]-3.1696[/C][C]0.001065[/C][/ROW]
[ROW][C]3[/C][C]0.292474[/C][C]2.6806[/C][C]0.004422[/C][/ROW]
[ROW][C]4[/C][C]0.087028[/C][C]0.7976[/C][C]0.213668[/C][/ROW]
[ROW][C]5[/C][C]0.226518[/C][C]2.0761[/C][C]0.020472[/C][/ROW]
[ROW][C]6[/C][C]-0.064735[/C][C]-0.5933[/C][C]0.277285[/C][/ROW]
[ROW][C]7[/C][C]-0.114774[/C][C]-1.0519[/C][C]0.147927[/C][/ROW]
[ROW][C]8[/C][C]-0.060564[/C][C]-0.5551[/C][C]0.290158[/C][/ROW]
[ROW][C]9[/C][C]0.056923[/C][C]0.5217[/C][C]0.301625[/C][/ROW]
[ROW][C]10[/C][C]0.161336[/C][C]1.4787[/C][C]0.071485[/C][/ROW]
[ROW][C]11[/C][C]0.331733[/C][C]3.0404[/C][C]0.001575[/C][/ROW]
[ROW][C]12[/C][C]-0.179067[/C][C]-1.6412[/C][C]0.05225[/C][/ROW]
[ROW][C]13[/C][C]-0.547646[/C][C]-5.0193[/C][C]1e-06[/C][/ROW]
[ROW][C]14[/C][C]0.004648[/C][C]0.0426[/C][C]0.483059[/C][/ROW]
[ROW][C]15[/C][C]-0.031565[/C][C]-0.2893[/C][C]0.386534[/C][/ROW]
[ROW][C]16[/C][C]-0.046144[/C][C]-0.4229[/C][C]0.336719[/C][/ROW]
[ROW][C]17[/C][C]-0.083773[/C][C]-0.7678[/C][C]0.222381[/C][/ROW]
[ROW][C]18[/C][C]0.004399[/C][C]0.0403[/C][C]0.483968[/C][/ROW]
[ROW][C]19[/C][C]0.079336[/C][C]0.7271[/C][C]0.234585[/C][/ROW]
[ROW][C]20[/C][C]0.042284[/C][C]0.3875[/C][C]0.349669[/C][/ROW]
[ROW][C]21[/C][C]0.065875[/C][C]0.6038[/C][C]0.273817[/C][/ROW]
[ROW][C]22[/C][C]0.014701[/C][C]0.1347[/C][C]0.446571[/C][/ROW]
[ROW][C]23[/C][C]0.062814[/C][C]0.5757[/C][C]0.28318[/C][/ROW]
[ROW][C]24[/C][C]0.146199[/C][C]1.3399[/C][C]0.091939[/C][/ROW]
[ROW][C]25[/C][C]-0.061448[/C][C]-0.5632[/C][C]0.287405[/C][/ROW]
[ROW][C]26[/C][C]0.014773[/C][C]0.1354[/C][C]0.446309[/C][/ROW]
[ROW][C]27[/C][C]-0.004269[/C][C]-0.0391[/C][C]0.484443[/C][/ROW]
[ROW][C]28[/C][C]-0.009633[/C][C]-0.0883[/C][C]0.464928[/C][/ROW]
[ROW][C]29[/C][C]-0.04649[/C][C]-0.4261[/C][C]0.335567[/C][/ROW]
[ROW][C]30[/C][C]-0.036419[/C][C]-0.3338[/C][C]0.369686[/C][/ROW]
[ROW][C]31[/C][C]0.108675[/C][C]0.996[/C][C]0.16105[/C][/ROW]
[ROW][C]32[/C][C]1.2e-05[/C][C]1e-04[/C][C]0.499956[/C][/ROW]
[ROW][C]33[/C][C]0.084808[/C][C]0.7773[/C][C]0.21959[/C][/ROW]
[ROW][C]34[/C][C]-0.03448[/C][C]-0.316[/C][C]0.376387[/C][/ROW]
[ROW][C]35[/C][C]0.034653[/C][C]0.3176[/C][C]0.375787[/C][/ROW]
[ROW][C]36[/C][C]0.018747[/C][C]0.1718[/C][C]0.431998[/C][/ROW]
[ROW][C]37[/C][C]-0.063721[/C][C]-0.584[/C][C]0.280388[/C][/ROW]
[ROW][C]38[/C][C]0.000741[/C][C]0.0068[/C][C]0.4973[/C][/ROW]
[ROW][C]39[/C][C]-0.076036[/C][C]-0.6969[/C][C]0.2439[/C][/ROW]
[ROW][C]40[/C][C]-0.062831[/C][C]-0.5759[/C][C]0.283125[/C][/ROW]
[ROW][C]41[/C][C]0.030729[/C][C]0.2816[/C][C]0.389456[/C][/ROW]
[ROW][C]42[/C][C]-0.042301[/C][C]-0.3877[/C][C]0.349611[/C][/ROW]
[ROW][C]43[/C][C]0.020012[/C][C]0.1834[/C][C]0.427459[/C][/ROW]
[ROW][C]44[/C][C]-0.02032[/C][C]-0.1862[/C][C]0.426353[/C][/ROW]
[ROW][C]45[/C][C]-0.03597[/C][C]-0.3297[/C][C]0.371236[/C][/ROW]
[ROW][C]46[/C][C]-0.088019[/C][C]-0.8067[/C][C]0.211058[/C][/ROW]
[ROW][C]47[/C][C]-0.085413[/C][C]-0.7828[/C][C]0.217967[/C][/ROW]
[ROW][C]48[/C][C]0.037238[/C][C]0.3413[/C][C]0.366868[/C][/ROW]
[/TABLE]
Source: https://freestatistics.org/blog/index.php?pk=271719&T=2

Globally Unique Identifier (entire table): ba.freestatistics.org/blog/index.php?pk=271719&T=2

As an alternative you can also use a QR Code:  

The GUIDs for individual cells are displayed in the table below:

Partial Autocorrelation Function
Time lag kPACF(k)T-STATP-value
10.8095047.41920
2-0.345828-3.16960.001065
30.2924742.68060.004422
40.0870280.79760.213668
50.2265182.07610.020472
6-0.064735-0.59330.277285
7-0.114774-1.05190.147927
8-0.060564-0.55510.290158
90.0569230.52170.301625
100.1613361.47870.071485
110.3317333.04040.001575
12-0.179067-1.64120.05225
13-0.547646-5.01931e-06
140.0046480.04260.483059
15-0.031565-0.28930.386534
16-0.046144-0.42290.336719
17-0.083773-0.76780.222381
180.0043990.04030.483968
190.0793360.72710.234585
200.0422840.38750.349669
210.0658750.60380.273817
220.0147010.13470.446571
230.0628140.57570.28318
240.1461991.33990.091939
25-0.061448-0.56320.287405
260.0147730.13540.446309
27-0.004269-0.03910.484443
28-0.009633-0.08830.464928
29-0.04649-0.42610.335567
30-0.036419-0.33380.369686
310.1086750.9960.16105
321.2e-051e-040.499956
330.0848080.77730.21959
34-0.03448-0.3160.376387
350.0346530.31760.375787
360.0187470.17180.431998
37-0.063721-0.5840.280388
380.0007410.00680.4973
39-0.076036-0.69690.2439
40-0.062831-0.57590.283125
410.0307290.28160.389456
42-0.042301-0.38770.349611
430.0200120.18340.427459
44-0.02032-0.18620.426353
45-0.03597-0.32970.371236
46-0.088019-0.80670.211058
47-0.085413-0.78280.217967
480.0372380.34130.366868


Parameters (Session):
par1 = 48 ; par2 = 1 ; par3 = 0 ; par4 = 0 ; par5 = 12 ; par6 = White Noise ; par7 = 0.95 ;
Parameters (R input):
par1 = 48 ; par2 = 1 ; par3 = 0 ; par4 = 0 ; par5 = 12 ; par6 = White Noise ; par7 = 0.95 ; par8 = ;
R code (references can be found in the software module):
if (par1 == 'Default') {
par1 = 10*log10(length(x))
} else {
par1 <- as.numeric(par1)
}
par2 <- as.numeric(par2)
par3 <- as.numeric(par3)
par4 <- as.numeric(par4)
par5 <- as.numeric(par5)
if (par6 == 'White Noise') par6 <- 'white' else par6 <- 'ma'
par7 <- as.numeric(par7)
if (par8 != '') par8 <- as.numeric(par8)
ox <- x
if (par8 == '') {
if (par2 == 0) {
x <- log(x)
} else {
x <- (x ^ par2 - 1) / par2
}
} else {
x <- log(x,base=par8)
}
if (par3 > 0) x <- diff(x,lag=1,difference=par3)
if (par4 > 0) x <- diff(x,lag=par5,difference=par4)
bitmap(file='picts.png')
op <- par(mfrow=c(2,1))
plot(ox,type='l',main='Original Time Series',xlab='time',ylab='value')
if (par8=='') {
mytitle <- paste('Working Time Series (lambda=',par2,', d=',par3,', D=',par4,')',sep='')
mysub <- paste('(lambda=',par2,', d=',par3,', D=',par4,', CI=', par7, ', CI type=',par6,')',sep='')
} else {
mytitle <- paste('Working Time Series (base=',par8,', d=',par3,', D=',par4,')',sep='')
mysub <- paste('(base=',par8,', d=',par3,', D=',par4,', CI=', par7, ', CI type=',par6,')',sep='')
}
plot(x,type='l', main=mytitle,xlab='time',ylab='value')
par(op)
dev.off()
bitmap(file='pic1.png')
racf <- acf(x, par1, main='Autocorrelation', xlab='time lag', ylab='ACF', ci.type=par6, ci=par7, sub=mysub)
dev.off()
bitmap(file='pic2.png')
rpacf <- pacf(x,par1,main='Partial Autocorrelation',xlab='lags',ylab='PACF',sub=mysub)
dev.off()
(myacf <- c(racf$acf))
(mypacf <- c(rpacf$acf))
lengthx <- length(x)
sqrtn <- sqrt(lengthx)
load(file='createtable')
a<-table.start()
a<-table.row.start(a)
a<-table.element(a,'Autocorrelation Function',4,TRUE)
a<-table.row.end(a)
a<-table.row.start(a)
a<-table.element(a,'Time lag k',header=TRUE)
a<-table.element(a,hyperlink('basics.htm','ACF(k)','click here for more information about the Autocorrelation Function'),header=TRUE)
a<-table.element(a,'T-STAT',header=TRUE)
a<-table.element(a,'P-value',header=TRUE)
a<-table.row.end(a)
for (i in 2:(par1+1)) {
a<-table.row.start(a)
a<-table.element(a,i-1,header=TRUE)
a<-table.element(a,round(myacf[i],6))
mytstat <- myacf[i]*sqrtn
a<-table.element(a,round(mytstat,4))
a<-table.element(a,round(1-pt(abs(mytstat),lengthx),6))
a<-table.row.end(a)
}
a<-table.end(a)
table.save(a,file='mytable.tab')
a<-table.start()
a<-table.row.start(a)
a<-table.element(a,'Partial Autocorrelation Function',4,TRUE)
a<-table.row.end(a)
a<-table.row.start(a)
a<-table.element(a,'Time lag k',header=TRUE)
a<-table.element(a,hyperlink('basics.htm','PACF(k)','click here for more information about the Partial Autocorrelation Function'),header=TRUE)
a<-table.element(a,'T-STAT',header=TRUE)
a<-table.element(a,'P-value',header=TRUE)
a<-table.row.end(a)
for (i in 1:par1) {
a<-table.row.start(a)
a<-table.element(a,i,header=TRUE)
a<-table.element(a,round(mypacf[i],6))
mytstat <- mypacf[i]*sqrtn
a<-table.element(a,round(mytstat,4))
a<-table.element(a,round(1-pt(abs(mytstat),lengthx),6))
a<-table.row.end(a)
}
a<-table.end(a)
table.save(a,file='mytable1.tab')