Free Statistics

of Irreproducible Research!

Author's title

Author*Unverified author*
R Software Modulerwasp_exponentialsmoothing.wasp
Title produced by softwareExponential Smoothing
Date of computationWed, 31 Dec 2014 15:30:21 +0000
Cite this page as followsStatistical Computations at FreeStatistics.org, Office for Research Development and Education, URL https://freestatistics.org/blog/index.php?v=date/2014/Dec/31/t1420039853gbto127i9ps9hnz.htm/, Retrieved Thu, 16 May 2024 05:43:16 +0000
Statistical Computations at FreeStatistics.org, Office for Research Development and Education, URL https://freestatistics.org/blog/index.php?pk=271832, Retrieved Thu, 16 May 2024 05:43:16 +0000
QR Codes:

Original text written by user:
IsPrivate?No (this computation is public)
User-defined keywords
Estimated Impact95
Family? (F = Feedback message, R = changed R code, M = changed R Module, P = changed Parameters, D = changed Data)
-       [Exponential Smoothing] [Exponential Smoot...] [2014-12-31 15:30:21] [f3214e2e5ea63970beb6f1c2b92f5ecb] [Current]
Feedback Forum

Post a new message
Dataseries X:
66329
50326
47182
42247
45796
48233
40079
39596
41275
41875
29784
7199
56166
33936
34532
30261
30857
35461
33525
27825
33624
35618
27329
8081
62751
37565
44749
37537
36825
50679
38488
36522
45545
43571
37343
11593
74784
49019
56601
47634
49807
50499
42092
39064
44376
43616
41059
17226
70170
43949
52333
41034
47760
76115
30918
32994
31947
26763
30251
18211
47957
31901
35560
30408
30083
35044
30475
28308
31395
36311
40426
38948


Summary of computational transaction
Raw Inputview raw input (R code)
Raw Outputview raw output of R engine
Computing time7 seconds
R Server'Sir Maurice George Kendall' @ kendall.wessa.net

\begin{tabular}{lllllllll}
\hline
Summary of computational transaction \tabularnewline
Raw Input & view raw input (R code)  \tabularnewline
Raw Output & view raw output of R engine  \tabularnewline
Computing time & 7 seconds \tabularnewline
R Server & 'Sir Maurice George Kendall' @ kendall.wessa.net \tabularnewline
\hline
\end{tabular}
%Source: https://freestatistics.org/blog/index.php?pk=271832&T=0

[TABLE]
[ROW][C]Summary of computational transaction[/C][/ROW]
[ROW][C]Raw Input[/C][C]view raw input (R code) [/C][/ROW]
[ROW][C]Raw Output[/C][C]view raw output of R engine [/C][/ROW]
[ROW][C]Computing time[/C][C]7 seconds[/C][/ROW]
[ROW][C]R Server[/C][C]'Sir Maurice George Kendall' @ kendall.wessa.net[/C][/ROW]
[/TABLE]
Source: https://freestatistics.org/blog/index.php?pk=271832&T=0

Globally Unique Identifier (entire table): ba.freestatistics.org/blog/index.php?pk=271832&T=0

As an alternative you can also use a QR Code:  

The GUIDs for individual cells are displayed in the table below:

Summary of computational transaction
Raw Inputview raw input (R code)
Raw Outputview raw output of R engine
Computing time7 seconds
R Server'Sir Maurice George Kendall' @ kendall.wessa.net


Estimated Parameters of Exponential Smoothing
ParameterValue
alpha0.475406173203475
beta0.0271236192471463
gamma0.49829294195918

\begin{tabular}{lllllllll}
\hline
Estimated Parameters of Exponential Smoothing \tabularnewline
Parameter & Value \tabularnewline
alpha & 0.475406173203475 \tabularnewline
beta & 0.0271236192471463 \tabularnewline
gamma & 0.49829294195918 \tabularnewline
\hline
\end{tabular}
%Source: https://freestatistics.org/blog/index.php?pk=271832&T=1

[TABLE]
[ROW][C]Estimated Parameters of Exponential Smoothing[/C][/ROW]
[ROW][C]Parameter[/C][C]Value[/C][/ROW]
[ROW][C]alpha[/C][C]0.475406173203475[/C][/ROW]
[ROW][C]beta[/C][C]0.0271236192471463[/C][/ROW]
[ROW][C]gamma[/C][C]0.49829294195918[/C][/ROW]
[/TABLE]
Source: https://freestatistics.org/blog/index.php?pk=271832&T=1

Globally Unique Identifier (entire table): ba.freestatistics.org/blog/index.php?pk=271832&T=1

As an alternative you can also use a QR Code:  

The GUIDs for individual cells are displayed in the table below:

Estimated Parameters of Exponential Smoothing
ParameterValue
alpha0.475406173203475
beta0.0271236192471463
gamma0.49829294195918


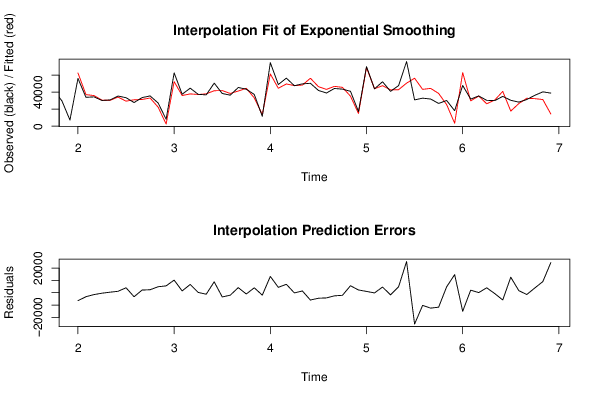
Interpolation Forecasts of Exponential Smoothing
tObservedFittedResiduals
135616662635.5208333333-6469.52083333334
143393637151.1297462954-3215.12974629543
153453236044.1463560073-1512.14635600728
163026130630.5230542261-369.523054226087
173085730405.8450215167451.15497848333
183546134287.68158279251173.3184172075
193352529470.96873216834054.03126783165
202782531086.8735503457-3261.87355034572
213362431448.31605699852175.68394300149
223561833160.36183326652457.63816673353
232732922442.5159834744886.48401652598
2480812481.118365939055599.88163406095
256275152442.566563702110308.4334362979
263756536078.54975179121486.45024820876
274474938005.84324337146743.15675662863
283753737275.9297737953261.070226204734
293682538034.1018395953-1209.10183959526
305067941762.54379433968916.4562056604
313848841926.9617410413-3438.96174104129
323652238518.6164058149-1996.61640581494
334554541369.62302484794175.3769751521
344357144598.49186292-1027.49186291998
353734333306.21098012544036.78901987462
361159313563.9032489173-1970.90324891735
377478461495.909340031313288.0906599687
384901944619.7168157084399.28318429197
395660149720.81534281346880.18465718658
404763447778.3020480866-144.302048086647
414980748370.90819298381436.0918070162
425049956449.2912711953-5950.29127119534
434209246570.1040155366-4478.10401553665
443906443285.2375429826-4221.23754298261
454437646903.7897795973-2527.7897795973
464361645711.2355122982-2095.23551229824
474105935346.72550880225712.27449119778
481722614963.71236141152262.28763858845
497017069084.68942708831085.31057291167
504394944114.0850654258-165.08506542581
515233347665.3214238054667.678576195
524103442777.7842824496-1743.78428244956
534776042945.50483692874814.49516307133
547611550665.155427979925449.8445720201
553091856469.4794550913-25551.4794550913
563299443332.47090255-10338.47090255
573194744505.7675843954-12558.7675843954
582676338548.3933550588-11785.3933550588
593025125383.96303983954867.03696016047
60182113452.334730384614758.6652696154
614795763122.6882768729-15165.6882768729
623190129806.03609547852094.9639045215
633556035430.7801350124129.219864987637
643040826386.91936398694021.08063601311
653008330761.2251708788-678.225170878817
663504440944.4741256602-5900.47412566023
673047517789.353726312812685.6462736872
682830826576.77836958771731.22163041227
693139532832.8940508899-1437.8940508899
703631132433.21491122823877.78508877175
714042631338.69954402599087.30045597408
723894814324.089842474824623.9101575252

\begin{tabular}{lllllllll}
\hline
Interpolation Forecasts of Exponential Smoothing \tabularnewline
t & Observed & Fitted & Residuals \tabularnewline
13 & 56166 & 62635.5208333333 & -6469.52083333334 \tabularnewline
14 & 33936 & 37151.1297462954 & -3215.12974629543 \tabularnewline
15 & 34532 & 36044.1463560073 & -1512.14635600728 \tabularnewline
16 & 30261 & 30630.5230542261 & -369.523054226087 \tabularnewline
17 & 30857 & 30405.8450215167 & 451.15497848333 \tabularnewline
18 & 35461 & 34287.6815827925 & 1173.3184172075 \tabularnewline
19 & 33525 & 29470.9687321683 & 4054.03126783165 \tabularnewline
20 & 27825 & 31086.8735503457 & -3261.87355034572 \tabularnewline
21 & 33624 & 31448.3160569985 & 2175.68394300149 \tabularnewline
22 & 35618 & 33160.3618332665 & 2457.63816673353 \tabularnewline
23 & 27329 & 22442.515983474 & 4886.48401652598 \tabularnewline
24 & 8081 & 2481.11836593905 & 5599.88163406095 \tabularnewline
25 & 62751 & 52442.5665637021 & 10308.4334362979 \tabularnewline
26 & 37565 & 36078.5497517912 & 1486.45024820876 \tabularnewline
27 & 44749 & 38005.8432433714 & 6743.15675662863 \tabularnewline
28 & 37537 & 37275.9297737953 & 261.070226204734 \tabularnewline
29 & 36825 & 38034.1018395953 & -1209.10183959526 \tabularnewline
30 & 50679 & 41762.5437943396 & 8916.4562056604 \tabularnewline
31 & 38488 & 41926.9617410413 & -3438.96174104129 \tabularnewline
32 & 36522 & 38518.6164058149 & -1996.61640581494 \tabularnewline
33 & 45545 & 41369.6230248479 & 4175.3769751521 \tabularnewline
34 & 43571 & 44598.49186292 & -1027.49186291998 \tabularnewline
35 & 37343 & 33306.2109801254 & 4036.78901987462 \tabularnewline
36 & 11593 & 13563.9032489173 & -1970.90324891735 \tabularnewline
37 & 74784 & 61495.9093400313 & 13288.0906599687 \tabularnewline
38 & 49019 & 44619.716815708 & 4399.28318429197 \tabularnewline
39 & 56601 & 49720.8153428134 & 6880.18465718658 \tabularnewline
40 & 47634 & 47778.3020480866 & -144.302048086647 \tabularnewline
41 & 49807 & 48370.9081929838 & 1436.0918070162 \tabularnewline
42 & 50499 & 56449.2912711953 & -5950.29127119534 \tabularnewline
43 & 42092 & 46570.1040155366 & -4478.10401553665 \tabularnewline
44 & 39064 & 43285.2375429826 & -4221.23754298261 \tabularnewline
45 & 44376 & 46903.7897795973 & -2527.7897795973 \tabularnewline
46 & 43616 & 45711.2355122982 & -2095.23551229824 \tabularnewline
47 & 41059 & 35346.7255088022 & 5712.27449119778 \tabularnewline
48 & 17226 & 14963.7123614115 & 2262.28763858845 \tabularnewline
49 & 70170 & 69084.6894270883 & 1085.31057291167 \tabularnewline
50 & 43949 & 44114.0850654258 & -165.08506542581 \tabularnewline
51 & 52333 & 47665.321423805 & 4667.678576195 \tabularnewline
52 & 41034 & 42777.7842824496 & -1743.78428244956 \tabularnewline
53 & 47760 & 42945.5048369287 & 4814.49516307133 \tabularnewline
54 & 76115 & 50665.1554279799 & 25449.8445720201 \tabularnewline
55 & 30918 & 56469.4794550913 & -25551.4794550913 \tabularnewline
56 & 32994 & 43332.47090255 & -10338.47090255 \tabularnewline
57 & 31947 & 44505.7675843954 & -12558.7675843954 \tabularnewline
58 & 26763 & 38548.3933550588 & -11785.3933550588 \tabularnewline
59 & 30251 & 25383.9630398395 & 4867.03696016047 \tabularnewline
60 & 18211 & 3452.3347303846 & 14758.6652696154 \tabularnewline
61 & 47957 & 63122.6882768729 & -15165.6882768729 \tabularnewline
62 & 31901 & 29806.0360954785 & 2094.9639045215 \tabularnewline
63 & 35560 & 35430.7801350124 & 129.219864987637 \tabularnewline
64 & 30408 & 26386.9193639869 & 4021.08063601311 \tabularnewline
65 & 30083 & 30761.2251708788 & -678.225170878817 \tabularnewline
66 & 35044 & 40944.4741256602 & -5900.47412566023 \tabularnewline
67 & 30475 & 17789.3537263128 & 12685.6462736872 \tabularnewline
68 & 28308 & 26576.7783695877 & 1731.22163041227 \tabularnewline
69 & 31395 & 32832.8940508899 & -1437.8940508899 \tabularnewline
70 & 36311 & 32433.2149112282 & 3877.78508877175 \tabularnewline
71 & 40426 & 31338.6995440259 & 9087.30045597408 \tabularnewline
72 & 38948 & 14324.0898424748 & 24623.9101575252 \tabularnewline
\hline
\end{tabular}
%Source: https://freestatistics.org/blog/index.php?pk=271832&T=2

[TABLE]
[ROW][C]Interpolation Forecasts of Exponential Smoothing[/C][/ROW]
[ROW][C]t[/C][C]Observed[/C][C]Fitted[/C][C]Residuals[/C][/ROW]
[ROW][C]13[/C][C]56166[/C][C]62635.5208333333[/C][C]-6469.52083333334[/C][/ROW]
[ROW][C]14[/C][C]33936[/C][C]37151.1297462954[/C][C]-3215.12974629543[/C][/ROW]
[ROW][C]15[/C][C]34532[/C][C]36044.1463560073[/C][C]-1512.14635600728[/C][/ROW]
[ROW][C]16[/C][C]30261[/C][C]30630.5230542261[/C][C]-369.523054226087[/C][/ROW]
[ROW][C]17[/C][C]30857[/C][C]30405.8450215167[/C][C]451.15497848333[/C][/ROW]
[ROW][C]18[/C][C]35461[/C][C]34287.6815827925[/C][C]1173.3184172075[/C][/ROW]
[ROW][C]19[/C][C]33525[/C][C]29470.9687321683[/C][C]4054.03126783165[/C][/ROW]
[ROW][C]20[/C][C]27825[/C][C]31086.8735503457[/C][C]-3261.87355034572[/C][/ROW]
[ROW][C]21[/C][C]33624[/C][C]31448.3160569985[/C][C]2175.68394300149[/C][/ROW]
[ROW][C]22[/C][C]35618[/C][C]33160.3618332665[/C][C]2457.63816673353[/C][/ROW]
[ROW][C]23[/C][C]27329[/C][C]22442.515983474[/C][C]4886.48401652598[/C][/ROW]
[ROW][C]24[/C][C]8081[/C][C]2481.11836593905[/C][C]5599.88163406095[/C][/ROW]
[ROW][C]25[/C][C]62751[/C][C]52442.5665637021[/C][C]10308.4334362979[/C][/ROW]
[ROW][C]26[/C][C]37565[/C][C]36078.5497517912[/C][C]1486.45024820876[/C][/ROW]
[ROW][C]27[/C][C]44749[/C][C]38005.8432433714[/C][C]6743.15675662863[/C][/ROW]
[ROW][C]28[/C][C]37537[/C][C]37275.9297737953[/C][C]261.070226204734[/C][/ROW]
[ROW][C]29[/C][C]36825[/C][C]38034.1018395953[/C][C]-1209.10183959526[/C][/ROW]
[ROW][C]30[/C][C]50679[/C][C]41762.5437943396[/C][C]8916.4562056604[/C][/ROW]
[ROW][C]31[/C][C]38488[/C][C]41926.9617410413[/C][C]-3438.96174104129[/C][/ROW]
[ROW][C]32[/C][C]36522[/C][C]38518.6164058149[/C][C]-1996.61640581494[/C][/ROW]
[ROW][C]33[/C][C]45545[/C][C]41369.6230248479[/C][C]4175.3769751521[/C][/ROW]
[ROW][C]34[/C][C]43571[/C][C]44598.49186292[/C][C]-1027.49186291998[/C][/ROW]
[ROW][C]35[/C][C]37343[/C][C]33306.2109801254[/C][C]4036.78901987462[/C][/ROW]
[ROW][C]36[/C][C]11593[/C][C]13563.9032489173[/C][C]-1970.90324891735[/C][/ROW]
[ROW][C]37[/C][C]74784[/C][C]61495.9093400313[/C][C]13288.0906599687[/C][/ROW]
[ROW][C]38[/C][C]49019[/C][C]44619.716815708[/C][C]4399.28318429197[/C][/ROW]
[ROW][C]39[/C][C]56601[/C][C]49720.8153428134[/C][C]6880.18465718658[/C][/ROW]
[ROW][C]40[/C][C]47634[/C][C]47778.3020480866[/C][C]-144.302048086647[/C][/ROW]
[ROW][C]41[/C][C]49807[/C][C]48370.9081929838[/C][C]1436.0918070162[/C][/ROW]
[ROW][C]42[/C][C]50499[/C][C]56449.2912711953[/C][C]-5950.29127119534[/C][/ROW]
[ROW][C]43[/C][C]42092[/C][C]46570.1040155366[/C][C]-4478.10401553665[/C][/ROW]
[ROW][C]44[/C][C]39064[/C][C]43285.2375429826[/C][C]-4221.23754298261[/C][/ROW]
[ROW][C]45[/C][C]44376[/C][C]46903.7897795973[/C][C]-2527.7897795973[/C][/ROW]
[ROW][C]46[/C][C]43616[/C][C]45711.2355122982[/C][C]-2095.23551229824[/C][/ROW]
[ROW][C]47[/C][C]41059[/C][C]35346.7255088022[/C][C]5712.27449119778[/C][/ROW]
[ROW][C]48[/C][C]17226[/C][C]14963.7123614115[/C][C]2262.28763858845[/C][/ROW]
[ROW][C]49[/C][C]70170[/C][C]69084.6894270883[/C][C]1085.31057291167[/C][/ROW]
[ROW][C]50[/C][C]43949[/C][C]44114.0850654258[/C][C]-165.08506542581[/C][/ROW]
[ROW][C]51[/C][C]52333[/C][C]47665.321423805[/C][C]4667.678576195[/C][/ROW]
[ROW][C]52[/C][C]41034[/C][C]42777.7842824496[/C][C]-1743.78428244956[/C][/ROW]
[ROW][C]53[/C][C]47760[/C][C]42945.5048369287[/C][C]4814.49516307133[/C][/ROW]
[ROW][C]54[/C][C]76115[/C][C]50665.1554279799[/C][C]25449.8445720201[/C][/ROW]
[ROW][C]55[/C][C]30918[/C][C]56469.4794550913[/C][C]-25551.4794550913[/C][/ROW]
[ROW][C]56[/C][C]32994[/C][C]43332.47090255[/C][C]-10338.47090255[/C][/ROW]
[ROW][C]57[/C][C]31947[/C][C]44505.7675843954[/C][C]-12558.7675843954[/C][/ROW]
[ROW][C]58[/C][C]26763[/C][C]38548.3933550588[/C][C]-11785.3933550588[/C][/ROW]
[ROW][C]59[/C][C]30251[/C][C]25383.9630398395[/C][C]4867.03696016047[/C][/ROW]
[ROW][C]60[/C][C]18211[/C][C]3452.3347303846[/C][C]14758.6652696154[/C][/ROW]
[ROW][C]61[/C][C]47957[/C][C]63122.6882768729[/C][C]-15165.6882768729[/C][/ROW]
[ROW][C]62[/C][C]31901[/C][C]29806.0360954785[/C][C]2094.9639045215[/C][/ROW]
[ROW][C]63[/C][C]35560[/C][C]35430.7801350124[/C][C]129.219864987637[/C][/ROW]
[ROW][C]64[/C][C]30408[/C][C]26386.9193639869[/C][C]4021.08063601311[/C][/ROW]
[ROW][C]65[/C][C]30083[/C][C]30761.2251708788[/C][C]-678.225170878817[/C][/ROW]
[ROW][C]66[/C][C]35044[/C][C]40944.4741256602[/C][C]-5900.47412566023[/C][/ROW]
[ROW][C]67[/C][C]30475[/C][C]17789.3537263128[/C][C]12685.6462736872[/C][/ROW]
[ROW][C]68[/C][C]28308[/C][C]26576.7783695877[/C][C]1731.22163041227[/C][/ROW]
[ROW][C]69[/C][C]31395[/C][C]32832.8940508899[/C][C]-1437.8940508899[/C][/ROW]
[ROW][C]70[/C][C]36311[/C][C]32433.2149112282[/C][C]3877.78508877175[/C][/ROW]
[ROW][C]71[/C][C]40426[/C][C]31338.6995440259[/C][C]9087.30045597408[/C][/ROW]
[ROW][C]72[/C][C]38948[/C][C]14324.0898424748[/C][C]24623.9101575252[/C][/ROW]
[/TABLE]
Source: https://freestatistics.org/blog/index.php?pk=271832&T=2

Globally Unique Identifier (entire table): ba.freestatistics.org/blog/index.php?pk=271832&T=2

As an alternative you can also use a QR Code:  

The GUIDs for individual cells are displayed in the table below:

Interpolation Forecasts of Exponential Smoothing
tObservedFittedResiduals
135616662635.5208333333-6469.52083333334
143393637151.1297462954-3215.12974629543
153453236044.1463560073-1512.14635600728
163026130630.5230542261-369.523054226087
173085730405.8450215167451.15497848333
183546134287.68158279251173.3184172075
193352529470.96873216834054.03126783165
202782531086.8735503457-3261.87355034572
213362431448.31605699852175.68394300149
223561833160.36183326652457.63816673353
232732922442.5159834744886.48401652598
2480812481.118365939055599.88163406095
256275152442.566563702110308.4334362979
263756536078.54975179121486.45024820876
274474938005.84324337146743.15675662863
283753737275.9297737953261.070226204734
293682538034.1018395953-1209.10183959526
305067941762.54379433968916.4562056604
313848841926.9617410413-3438.96174104129
323652238518.6164058149-1996.61640581494
334554541369.62302484794175.3769751521
344357144598.49186292-1027.49186291998
353734333306.21098012544036.78901987462
361159313563.9032489173-1970.90324891735
377478461495.909340031313288.0906599687
384901944619.7168157084399.28318429197
395660149720.81534281346880.18465718658
404763447778.3020480866-144.302048086647
414980748370.90819298381436.0918070162
425049956449.2912711953-5950.29127119534
434209246570.1040155366-4478.10401553665
443906443285.2375429826-4221.23754298261
454437646903.7897795973-2527.7897795973
464361645711.2355122982-2095.23551229824
474105935346.72550880225712.27449119778
481722614963.71236141152262.28763858845
497017069084.68942708831085.31057291167
504394944114.0850654258-165.08506542581
515233347665.3214238054667.678576195
524103442777.7842824496-1743.78428244956
534776042945.50483692874814.49516307133
547611550665.155427979925449.8445720201
553091856469.4794550913-25551.4794550913
563299443332.47090255-10338.47090255
573194744505.7675843954-12558.7675843954
582676338548.3933550588-11785.3933550588
593025125383.96303983954867.03696016047
60182113452.334730384614758.6652696154
614795763122.6882768729-15165.6882768729
623190129806.03609547852094.9639045215
633556035430.7801350124129.219864987637
643040826386.91936398694021.08063601311
653008330761.2251708788-678.225170878817
663504440944.4741256602-5900.47412566023
673047517789.353726312812685.6462736872
682830826576.77836958771731.22163041227
693139532832.8940508899-1437.8940508899
703631132433.21491122823877.78508877175
714042631338.69954402599087.30045597408
723894814324.089842474824623.9101575252


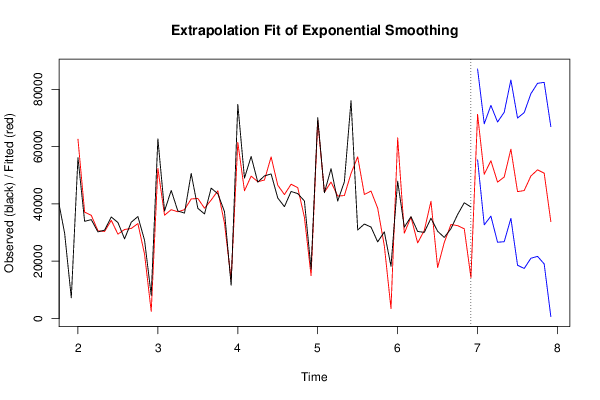
Extrapolation Forecasts of Exponential Smoothing
tForecast95% Lower Bound95% Upper Bound
7371314.377276182555457.600110476987171.1544418882
7450367.306653929232721.07326653968013.5400413194
7555102.990731640535749.699341169174456.2821221118
7647634.116699747926634.06903700768634.1643624888
7749435.600854456326834.063064988672037.138643924
7859152.154610316534983.662133822983320.6470868101
7944312.654571009918603.800622263770021.5085197562
8044694.225271552817465.553730850471922.8968122551
8149765.055135615121032.394429815878497.7158414144
8251923.185857267221698.618059610282147.7536549241
8350781.619299627919074.202329130682489.0362701253
8433825.6612323038641.97874376965867009.343720838

\begin{tabular}{lllllllll}
\hline
Extrapolation Forecasts of Exponential Smoothing \tabularnewline
t & Forecast & 95% Lower Bound & 95% Upper Bound \tabularnewline
73 & 71314.3772761825 & 55457.6001104769 & 87171.1544418882 \tabularnewline
74 & 50367.3066539292 & 32721.073266539 & 68013.5400413194 \tabularnewline
75 & 55102.9907316405 & 35749.6993411691 & 74456.2821221118 \tabularnewline
76 & 47634.1166997479 & 26634.069037007 & 68634.1643624888 \tabularnewline
77 & 49435.6008544563 & 26834.0630649886 & 72037.138643924 \tabularnewline
78 & 59152.1546103165 & 34983.6621338229 & 83320.6470868101 \tabularnewline
79 & 44312.6545710099 & 18603.8006222637 & 70021.5085197562 \tabularnewline
80 & 44694.2252715528 & 17465.5537308504 & 71922.8968122551 \tabularnewline
81 & 49765.0551356151 & 21032.3944298158 & 78497.7158414144 \tabularnewline
82 & 51923.1858572672 & 21698.6180596102 & 82147.7536549241 \tabularnewline
83 & 50781.6192996279 & 19074.2023291306 & 82489.0362701253 \tabularnewline
84 & 33825.6612323038 & 641.978743769658 & 67009.343720838 \tabularnewline
\hline
\end{tabular}
%Source: https://freestatistics.org/blog/index.php?pk=271832&T=3

[TABLE]
[ROW][C]Extrapolation Forecasts of Exponential Smoothing[/C][/ROW]
[ROW][C]t[/C][C]Forecast[/C][C]95% Lower Bound[/C][C]95% Upper Bound[/C][/ROW]
[ROW][C]73[/C][C]71314.3772761825[/C][C]55457.6001104769[/C][C]87171.1544418882[/C][/ROW]
[ROW][C]74[/C][C]50367.3066539292[/C][C]32721.073266539[/C][C]68013.5400413194[/C][/ROW]
[ROW][C]75[/C][C]55102.9907316405[/C][C]35749.6993411691[/C][C]74456.2821221118[/C][/ROW]
[ROW][C]76[/C][C]47634.1166997479[/C][C]26634.069037007[/C][C]68634.1643624888[/C][/ROW]
[ROW][C]77[/C][C]49435.6008544563[/C][C]26834.0630649886[/C][C]72037.138643924[/C][/ROW]
[ROW][C]78[/C][C]59152.1546103165[/C][C]34983.6621338229[/C][C]83320.6470868101[/C][/ROW]
[ROW][C]79[/C][C]44312.6545710099[/C][C]18603.8006222637[/C][C]70021.5085197562[/C][/ROW]
[ROW][C]80[/C][C]44694.2252715528[/C][C]17465.5537308504[/C][C]71922.8968122551[/C][/ROW]
[ROW][C]81[/C][C]49765.0551356151[/C][C]21032.3944298158[/C][C]78497.7158414144[/C][/ROW]
[ROW][C]82[/C][C]51923.1858572672[/C][C]21698.6180596102[/C][C]82147.7536549241[/C][/ROW]
[ROW][C]83[/C][C]50781.6192996279[/C][C]19074.2023291306[/C][C]82489.0362701253[/C][/ROW]
[ROW][C]84[/C][C]33825.6612323038[/C][C]641.978743769658[/C][C]67009.343720838[/C][/ROW]
[/TABLE]
Source: https://freestatistics.org/blog/index.php?pk=271832&T=3

Globally Unique Identifier (entire table): ba.freestatistics.org/blog/index.php?pk=271832&T=3

As an alternative you can also use a QR Code:  

The GUIDs for individual cells are displayed in the table below:

Extrapolation Forecasts of Exponential Smoothing
tForecast95% Lower Bound95% Upper Bound
7371314.377276182555457.600110476987171.1544418882
7450367.306653929232721.07326653968013.5400413194
7555102.990731640535749.699341169174456.2821221118
7647634.116699747926634.06903700768634.1643624888
7749435.600854456326834.063064988672037.138643924
7859152.154610316534983.662133822983320.6470868101
7944312.654571009918603.800622263770021.5085197562
8044694.225271552817465.553730850471922.8968122551
8149765.055135615121032.394429815878497.7158414144
8251923.185857267221698.618059610282147.7536549241
8350781.619299627919074.202329130682489.0362701253
8433825.6612323038641.97874376965867009.343720838


Parameters (Session):
par1 = 12 ; par2 = Triple ; par3 = additive ;
Parameters (R input):
par1 = 12 ; par2 = Triple ; par3 = additive ;
R code (references can be found in the software module):
par1 <- as.numeric(par1)
if (par2 == 'Single') K <- 1
if (par2 == 'Double') K <- 2
if (par2 == 'Triple') K <- par1
nx <- length(x)
nxmK <- nx - K
x <- ts(x, frequency = par1)
if (par2 == 'Single') fit <- HoltWinters(x, gamma=F, beta=F)
if (par2 == 'Double') fit <- HoltWinters(x, gamma=F)
if (par2 == 'Triple') fit <- HoltWinters(x, seasonal=par3)
fit
myresid <- x - fit$fitted[,'xhat']
bitmap(file='test1.png')
op <- par(mfrow=c(2,1))
plot(fit,ylab='Observed (black) / Fitted (red)',main='Interpolation Fit of Exponential Smoothing')
plot(myresid,ylab='Residuals',main='Interpolation Prediction Errors')
par(op)
dev.off()
bitmap(file='test2.png')
p <- predict(fit, par1, prediction.interval=TRUE)
np <- length(p[,1])
plot(fit,p,ylab='Observed (black) / Fitted (red)',main='Extrapolation Fit of Exponential Smoothing')
dev.off()
bitmap(file='test3.png')
op <- par(mfrow = c(2,2))
acf(as.numeric(myresid),lag.max = nx/2,main='Residual ACF')
spectrum(myresid,main='Residals Periodogram')
cpgram(myresid,main='Residal Cumulative Periodogram')
qqnorm(myresid,main='Residual Normal QQ Plot')
qqline(myresid)
par(op)
dev.off()
load(file='createtable')
a<-table.start()
a<-table.row.start(a)
a<-table.element(a,'Estimated Parameters of Exponential Smoothing',2,TRUE)
a<-table.row.end(a)
a<-table.row.start(a)
a<-table.element(a,'Parameter',header=TRUE)
a<-table.element(a,'Value',header=TRUE)
a<-table.row.end(a)
a<-table.row.start(a)
a<-table.element(a,'alpha',header=TRUE)
a<-table.element(a,fit$alpha)
a<-table.row.end(a)
a<-table.row.start(a)
a<-table.element(a,'beta',header=TRUE)
a<-table.element(a,fit$beta)
a<-table.row.end(a)
a<-table.row.start(a)
a<-table.element(a,'gamma',header=TRUE)
a<-table.element(a,fit$gamma)
a<-table.row.end(a)
a<-table.end(a)
table.save(a,file='mytable.tab')
a<-table.start()
a<-table.row.start(a)
a<-table.element(a,'Interpolation Forecasts of Exponential Smoothing',4,TRUE)
a<-table.row.end(a)
a<-table.row.start(a)
a<-table.element(a,'t',header=TRUE)
a<-table.element(a,'Observed',header=TRUE)
a<-table.element(a,'Fitted',header=TRUE)
a<-table.element(a,'Residuals',header=TRUE)
a<-table.row.end(a)
for (i in 1:nxmK) {
a<-table.row.start(a)
a<-table.element(a,i+K,header=TRUE)
a<-table.element(a,x[i+K])
a<-table.element(a,fit$fitted[i,'xhat'])
a<-table.element(a,myresid[i])
a<-table.row.end(a)
}
a<-table.end(a)
table.save(a,file='mytable1.tab')
a<-table.start()
a<-table.row.start(a)
a<-table.element(a,'Extrapolation Forecasts of Exponential Smoothing',4,TRUE)
a<-table.row.end(a)
a<-table.row.start(a)
a<-table.element(a,'t',header=TRUE)
a<-table.element(a,'Forecast',header=TRUE)
a<-table.element(a,'95% Lower Bound',header=TRUE)
a<-table.element(a,'95% Upper Bound',header=TRUE)
a<-table.row.end(a)
for (i in 1:np) {
a<-table.row.start(a)
a<-table.element(a,nx+i,header=TRUE)
a<-table.element(a,p[i,'fit'])
a<-table.element(a,p[i,'lwr'])
a<-table.element(a,p[i,'upr'])
a<-table.row.end(a)
}
a<-table.end(a)
table.save(a,file='mytable2.tab')