Free Statistics

of Irreproducible Research!

Author's title

Author*Unverified author*
R Software Modulerwasp_univariatedataseries.wasp
Title produced by softwareUnivariate Data Series
Date of computationSun, 02 Feb 2014 13:39:17 -0500
Cite this page as followsStatistical Computations at FreeStatistics.org, Office for Research Development and Education, URL https://freestatistics.org/blog/index.php?v=date/2014/Feb/02/t1391366476nj4jsdgxwfpjmdx.htm/, Retrieved Wed, 15 May 2024 12:57:24 +0000
Statistical Computations at FreeStatistics.org, Office for Research Development and Education, URL https://freestatistics.org/blog/index.php?pk=233214, Retrieved Wed, 15 May 2024 12:57:24 +0000
QR Codes:

Original text written by user:
IsPrivate?No (this computation is public)
User-defined keywords
Estimated Impact142
Family? (F = Feedback message, R = changed R code, M = changed R Module, P = changed Parameters, D = changed Data)
-       [Univariate Data Series] [] [2014-02-02 18:39:17] [037e8324e286ad6b42f22dbe2b069133] [Current]
Feedback Forum

Post a new message
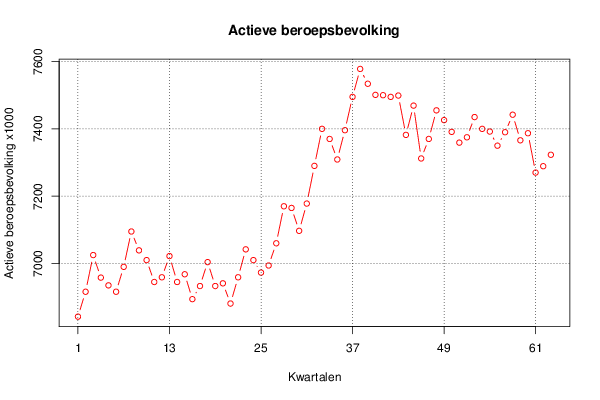
Dataseries X:
6842
6916
7025
6958
6935
6916
6990
7095
7039
7010
6945
6959
7022
6945
6968
6894
6933
7004
6933
6941
6881
6959
7042
7010
6973
6994
7060
7170
7165
7097
7178
7290
7400
7370
7309
7396
7495
7578
7534
7501
7500
7495
7499
7382
7469
7312
7370
7455
7426
7391
7359
7375
7435
7400
7392
7350
7390
7442
7366
7387
7270
7289
7323


Summary of computational transaction
Raw Inputview raw input (R code)
Raw Outputview raw output of R engine
Computing time3 seconds
R Server'Gertrude Mary Cox' @ cox.wessa.net

\begin{tabular}{lllllllll}
\hline
Summary of computational transaction \tabularnewline
Raw Input & view raw input (R code)  \tabularnewline
Raw Output & view raw output of R engine  \tabularnewline
Computing time & 3 seconds \tabularnewline
R Server & 'Gertrude Mary Cox' @ cox.wessa.net \tabularnewline
\hline
\end{tabular}
%Source: https://freestatistics.org/blog/index.php?pk=233214&T=0

[TABLE]
[ROW][C]Summary of computational transaction[/C][/ROW]
[ROW][C]Raw Input[/C][C]view raw input (R code) [/C][/ROW]
[ROW][C]Raw Output[/C][C]view raw output of R engine [/C][/ROW]
[ROW][C]Computing time[/C][C]3 seconds[/C][/ROW]
[ROW][C]R Server[/C][C]'Gertrude Mary Cox' @ cox.wessa.net[/C][/ROW]
[/TABLE]
Source: https://freestatistics.org/blog/index.php?pk=233214&T=0

Globally Unique Identifier (entire table): ba.freestatistics.org/blog/index.php?pk=233214&T=0

As an alternative you can also use a QR Code:  

The GUIDs for individual cells are displayed in the table below:

Summary of computational transaction
Raw Inputview raw input (R code)
Raw Outputview raw output of R engine
Computing time3 seconds
R Server'Gertrude Mary Cox' @ cox.wessa.net


Univariate Dataseries
Name of dataseriesActieve beroepsbevolking
SourceCBS
DescriptionHet aantal actieve mensen op beroepsleeftijd
Number of observations63

\begin{tabular}{lllllllll}
\hline
Univariate Dataseries \tabularnewline
Name of dataseries & Actieve beroepsbevolking \tabularnewline
Source & CBS \tabularnewline
Description & Het aantal actieve mensen op beroepsleeftijd \tabularnewline
Number of observations & 63 \tabularnewline
\hline
\end{tabular}
%Source: https://freestatistics.org/blog/index.php?pk=233214&T=1

[TABLE]
[ROW][C]Univariate Dataseries[/C][/ROW]
[ROW][C]Name of dataseries[/C][C]Actieve beroepsbevolking[/C][/ROW]
[ROW][C]Source[/C][C]CBS[/C][/ROW]
[ROW][C]Description[/C][C]Het aantal actieve mensen op beroepsleeftijd[/C][/ROW]
[ROW][C]Number of observations[/C][C]63[/C][/ROW]
[/TABLE]
Source: https://freestatistics.org/blog/index.php?pk=233214&T=1

Globally Unique Identifier (entire table): ba.freestatistics.org/blog/index.php?pk=233214&T=1

As an alternative you can also use a QR Code:  

The GUIDs for individual cells are displayed in the table below:

Univariate Dataseries
Name of dataseriesActieve beroepsbevolking
SourceCBS
DescriptionHet aantal actieve mensen op beroepsleeftijd
Number of observations63


Parameters (Session):
par1 = Actieve beroepsbevolking ; par2 = CBS ; par3 = Het aantal actieve mensen op beroepsleeftijd ; par4 = 12 ;
Parameters (R input):
par1 = Actieve beroepsbevolking ; par2 = CBS ; par3 = Het aantal actieve mensen op beroepsleeftijd ; par4 = 12 ;
R code (references can be found in the software module):
par4 <- '12'
par3 <- 'Het aantal actieve mensen op beroepsleeftijd'
par2 <- 'CBS'
par1 <- 'Actieve beroepsbevolking'
if (par4 != 'No season') {
par4 <- as.numeric(par4)
if (par4 < 4) par4 <- 12
}
summary(x)
n <- length(x)
bitmap(file='test1.png')
if (par4=='No season') {
plot(x,col=2,type='b',main=main,xlab=xlab,ylab=ylab,xaxt='n')
axis(1,at=seq(1,n,10))
}
if (par4!='No season') {
plot(x,col=2,type='b',main=main,xlab=xlab,ylab=ylab,xaxt='n')
axis(1,at=seq(1,n,par4))
grid(nx=0,ny=NULL,col='black')
abline(v=seq(1,n,par4),col='black',lty='dotted')
}
dev.off()
load(file='createtable')
a<-table.start()
a<-table.row.start(a)
a<-table.element(a,'Univariate Dataseries',2,TRUE)
a<-table.row.end(a)
a<-table.row.start(a)
a<-table.element(a,'Name of dataseries',header=TRUE)
a<-table.element(a,par1)
a<-table.row.end(a)
a<-table.row.start(a)
a<-table.element(a,'Source',header=TRUE)
a<-table.element(a,par2)
a<-table.row.end(a)
a<-table.row.start(a)
a<-table.element(a,'Description',header=TRUE)
a<-table.element(a,par3)
a<-table.row.end(a)
a<-table.row.start(a)
a<-table.element(a,'Number of observations',header=TRUE)
a<-table.element(a,length(x))
a<-table.row.end(a)
a<-table.end(a)
table.save(a,file='mytable.tab')