Free Statistics

of Irreproducible Research!

Author's title

Author*Unverified author*
R Software Modulerwasp_univariatedataseries.wasp
Title produced by softwareUnivariate Data Series
Date of computationMon, 03 Feb 2014 06:49:01 -0500
Cite this page as followsStatistical Computations at FreeStatistics.org, Office for Research Development and Education, URL https://freestatistics.org/blog/index.php?v=date/2014/Feb/03/t1391428206j5uq794t3764ewh.htm/, Retrieved Thu, 16 May 2024 07:32:17 +0000
Statistical Computations at FreeStatistics.org, Office for Research Development and Education, URL https://freestatistics.org/blog/index.php?pk=233223, Retrieved Thu, 16 May 2024 07:32:17 +0000
QR Codes:

Original text written by user:
IsPrivate?No (this computation is public)
User-defined keywords
Estimated Impact147
Family? (F = Feedback message, R = changed R code, M = changed R Module, P = changed Parameters, D = changed Data)
-       [Univariate Data Series] [] [2014-02-03 11:49:01] [941d89646656d1688f5e273fb31a8e6b] [Current]
Feedback Forum

Post a new message
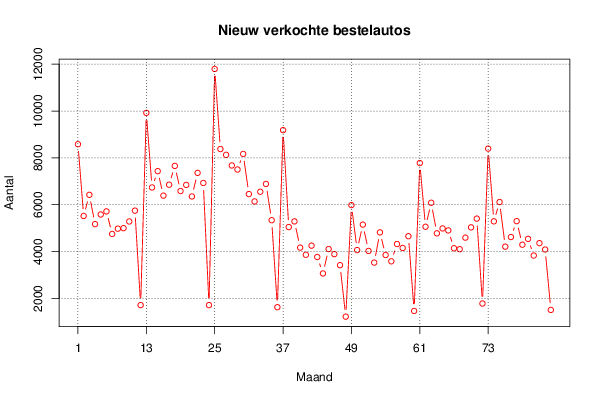
Dataseries X:
8584
5522
6423
5173
5583
5716
4752
4977
4999
5285
5747
1713
9923
6737
7433
6388
6855
7658
6585
6847
6353
7361
6929
1714
11798
8378
8131
7676
7505
8168
6455
6141
6554
6888
5339
1624
9187
5047
5289
4169
3862
4253
3768
3066
4108
3890
3420
1221
5984
4064
5151
4027
3530
4819
3855
3584
4322
4154
4656
1464
7780
5060
6084
4778
4989
4903
4142
4101
4595
5034
5407
1782
8395
5291
6116
4210
4621
5299
4293
4542
3831
4360
4088
1508


Summary of computational transaction
Raw Inputview raw input (R code)
Raw Outputview raw output of R engine
Computing time2 seconds
R Server'Gwilym Jenkins' @ jenkins.wessa.net

\begin{tabular}{lllllllll}
\hline
Summary of computational transaction \tabularnewline
Raw Input & view raw input (R code)  \tabularnewline
Raw Output & view raw output of R engine  \tabularnewline
Computing time & 2 seconds \tabularnewline
R Server & 'Gwilym Jenkins' @ jenkins.wessa.net \tabularnewline
\hline
\end{tabular}
%Source: https://freestatistics.org/blog/index.php?pk=233223&T=0

[TABLE]
[ROW][C]Summary of computational transaction[/C][/ROW]
[ROW][C]Raw Input[/C][C]view raw input (R code) [/C][/ROW]
[ROW][C]Raw Output[/C][C]view raw output of R engine [/C][/ROW]
[ROW][C]Computing time[/C][C]2 seconds[/C][/ROW]
[ROW][C]R Server[/C][C]'Gwilym Jenkins' @ jenkins.wessa.net[/C][/ROW]
[/TABLE]
Source: https://freestatistics.org/blog/index.php?pk=233223&T=0

Globally Unique Identifier (entire table): ba.freestatistics.org/blog/index.php?pk=233223&T=0

As an alternative you can also use a QR Code:  

The GUIDs for individual cells are displayed in the table below:

Summary of computational transaction
Raw Inputview raw input (R code)
Raw Outputview raw output of R engine
Computing time2 seconds
R Server'Gwilym Jenkins' @ jenkins.wessa.net


Univariate Dataseries
Name of dataseriesAantal nieuw verkochte bestelautos per maand
SourceStatline
DescriptionAantal nieuw verkochte bestelautos per maand
Number of observations84

\begin{tabular}{lllllllll}
\hline
Univariate Dataseries \tabularnewline
Name of dataseries & Aantal nieuw verkochte bestelautos per maand \tabularnewline
Source & Statline \tabularnewline
Description & Aantal nieuw verkochte bestelautos per maand \tabularnewline
Number of observations & 84 \tabularnewline
\hline
\end{tabular}
%Source: https://freestatistics.org/blog/index.php?pk=233223&T=1

[TABLE]
[ROW][C]Univariate Dataseries[/C][/ROW]
[ROW][C]Name of dataseries[/C][C]Aantal nieuw verkochte bestelautos per maand[/C][/ROW]
[ROW][C]Source[/C][C]Statline[/C][/ROW]
[ROW][C]Description[/C][C]Aantal nieuw verkochte bestelautos per maand[/C][/ROW]
[ROW][C]Number of observations[/C][C]84[/C][/ROW]
[/TABLE]
Source: https://freestatistics.org/blog/index.php?pk=233223&T=1

Globally Unique Identifier (entire table): ba.freestatistics.org/blog/index.php?pk=233223&T=1

As an alternative you can also use a QR Code:  

The GUIDs for individual cells are displayed in the table below:

Univariate Dataseries
Name of dataseriesAantal nieuw verkochte bestelautos per maand
SourceStatline
DescriptionAantal nieuw verkochte bestelautos per maand
Number of observations84


Parameters (Session):
par1 = Aantal nieuw verkochte bestelautos per maand ; par2 = Statline ; par3 = Aantal nieuw verkochte bestelautos per maand ; par4 = 12 ;
Parameters (R input):
par1 = Aantal nieuw verkochte bestelautos per maand ; par2 = Statline ; par3 = Aantal nieuw verkochte bestelautos per maand ; par4 = 12 ;
R code (references can be found in the software module):
if (par4 != 'No season') {
par4 <- as.numeric(par4)
if (par4 < 4) par4 <- 12
}
summary(x)
n <- length(x)
bitmap(file='test1.png')
if (par4=='No season') {
plot(x,col=2,type='b',main=main,xlab=xlab,ylab=ylab,xaxt='n')
axis(1,at=seq(1,n,10))
}
if (par4!='No season') {
plot(x,col=2,type='b',main=main,xlab=xlab,ylab=ylab,xaxt='n')
axis(1,at=seq(1,n,par4))
grid(nx=0,ny=NULL,col='black')
abline(v=seq(1,n,par4),col='black',lty='dotted')
}
dev.off()
load(file='createtable')
a<-table.start()
a<-table.row.start(a)
a<-table.element(a,'Univariate Dataseries',2,TRUE)
a<-table.row.end(a)
a<-table.row.start(a)
a<-table.element(a,'Name of dataseries',header=TRUE)
a<-table.element(a,par1)
a<-table.row.end(a)
a<-table.row.start(a)
a<-table.element(a,'Source',header=TRUE)
a<-table.element(a,par2)
a<-table.row.end(a)
a<-table.row.start(a)
a<-table.element(a,'Description',header=TRUE)
a<-table.element(a,par3)
a<-table.row.end(a)
a<-table.row.start(a)
a<-table.element(a,'Number of observations',header=TRUE)
a<-table.element(a,length(x))
a<-table.row.end(a)
a<-table.end(a)
table.save(a,file='mytable.tab')