Free Statistics
of Irreproducible Research!
Description of Statistical Computation | |||||||||||||||||||||||||||||||||||||||||||||
|---|---|---|---|---|---|---|---|---|---|---|---|---|---|---|---|---|---|---|---|---|---|---|---|---|---|---|---|---|---|---|---|---|---|---|---|---|---|---|---|---|---|---|---|---|---|
| Author's title | |||||||||||||||||||||||||||||||||||||||||||||
| Author | *Unverified author* | ||||||||||||||||||||||||||||||||||||||||||||
| R Software Module | rwasp_univariatedataseries.wasp | ||||||||||||||||||||||||||||||||||||||||||||
| Title produced by software | Univariate Data Series | ||||||||||||||||||||||||||||||||||||||||||||
| Date of computation | Sun, 09 Feb 2014 06:30:26 -0500 | ||||||||||||||||||||||||||||||||||||||||||||
| Cite this page as follows | Statistical Computations at FreeStatistics.org, Office for Research Development and Education, URL https://freestatistics.org/blog/index.php?v=date/2014/Feb/09/t1391945638bq453cosjz43301.htm/, Retrieved Thu, 16 May 2024 14:48:25 +0000 | ||||||||||||||||||||||||||||||||||||||||||||
| Statistical Computations at FreeStatistics.org, Office for Research Development and Education, URL https://freestatistics.org/blog/index.php?pk=233406, Retrieved Thu, 16 May 2024 14:48:25 +0000 | |||||||||||||||||||||||||||||||||||||||||||||
| QR Codes: | |||||||||||||||||||||||||||||||||||||||||||||
|
| |||||||||||||||||||||||||||||||||||||||||||||
| Original text written by user: | |||||||||||||||||||||||||||||||||||||||||||||
| IsPrivate? | No (this computation is public) | ||||||||||||||||||||||||||||||||||||||||||||
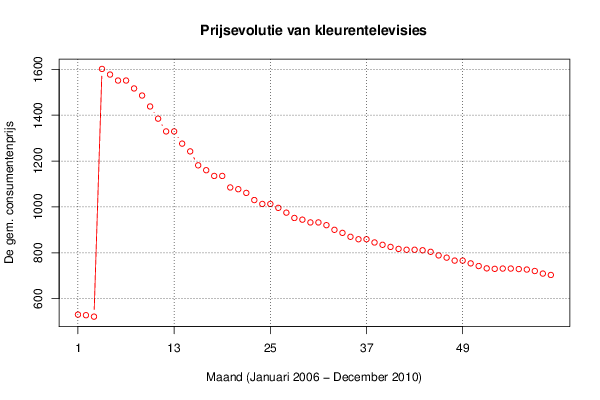
| User-defined keywords | Dit is een overzicht van consumentenprijzen over een periode van 5 jaar. | ||||||||||||||||||||||||||||||||||||||||||||
| Estimated Impact | 110 | ||||||||||||||||||||||||||||||||||||||||||||
Tree of Dependent Computations | |||||||||||||||||||||||||||||||||||||||||||||
| Family? (F = Feedback message, R = changed R code, M = changed R Module, P = changed Parameters, D = changed Data) | |||||||||||||||||||||||||||||||||||||||||||||
| - [Univariate Data Series] [Consumentenprijze...] [2014-02-09 11:30:26] [bde58939c1a4c9e8add61ba7c57eaa76] [Current] - RMPD [Histogram] [Frequentietabel r...] [2014-02-09 18:48:51] [2daa9a4ec9d75efbc809ebbbc6248090] - RMPD [Kernel Density Estimation] [Dichtheidsgrafiek...] [2014-02-09 18:55:31] [2daa9a4ec9d75efbc809ebbbc6248090] | |||||||||||||||||||||||||||||||||||||||||||||
| Feedback Forum | |||||||||||||||||||||||||||||||||||||||||||||
Post a new message | |||||||||||||||||||||||||||||||||||||||||||||
Dataset | |||||||||||||||||||||||||||||||||||||||||||||
| Dataseries X: | |||||||||||||||||||||||||||||||||||||||||||||
530.3 527.76 521.41 1601.93 1577.49 1551.43 1551.43 1516.88 1485.95 1438.22 1385.06 1329.49 1329.49 1276.16 1242.34 1181.59 1160.21 1135.18 1135.18 1084.96 1077.35 1061.13 1029.98 1013.08 1013.08 996.04 975.02 951.89 944.4 932.47 932.47 920.44 900.18 886.9 869.74 859.03 859.03 844.99 834.82 825.62 816.92 813.21 813.21 811.03 804.16 788.62 778.76 765.91 765.91 753.85 742.22 732.11 729.94 731.22 731.22 729.11 726.94 720.52 709.36 703.21 | |||||||||||||||||||||||||||||||||||||||||||||
Tables (Output of Computation) | |||||||||||||||||||||||||||||||||||||||||||||
| |||||||||||||||||||||||||||||||||||||||||||||
Figures (Output of Computation) | |||||||||||||||||||||||||||||||||||||||||||||
Input Parameters & R Code | |||||||||||||||||||||||||||||||||||||||||||||
| Parameters (Session): | |||||||||||||||||||||||||||||||||||||||||||||
| par1 = Prijsevolutie van kleurentelevisies ; par2 = http://www.nbb.be/belgostat/PresentationLinker?Order=true&TableId=696000087&Lang=N&prop=treeview ; par3 = Consumentenprijzen van kleurentelevisies over 5 jaar ; par4 = 12 ; | |||||||||||||||||||||||||||||||||||||||||||||
| Parameters (R input): | |||||||||||||||||||||||||||||||||||||||||||||
| par1 = Prijsevolutie van kleurentelevisies ; par2 = http://www.nbb.be/belgostat/PresentationLinker?Order=true&TableId=696000087&Lang=N&prop=treeview ; par3 = Consumentenprijzen van kleurentelevisies over 5 jaar ; par4 = 12 ; | |||||||||||||||||||||||||||||||||||||||||||||
| R code (references can be found in the software module): | |||||||||||||||||||||||||||||||||||||||||||||
par4 <- '12' | |||||||||||||||||||||||||||||||||||||||||||||