Free Statistics

of Irreproducible Research!

Author's title

Author*Unverified author*
R Software Modulerwasp_density.wasp
Title produced by softwareKernel Density Estimation
Date of computationSun, 09 Feb 2014 15:06:23 -0500
Cite this page as followsStatistical Computations at FreeStatistics.org, Office for Research Development and Education, URL https://freestatistics.org/blog/index.php?v=date/2014/Feb/09/t1391976394hb3a67l873k3xos.htm/, Retrieved Thu, 16 May 2024 23:24:24 +0000
Statistical Computations at FreeStatistics.org, Office for Research Development and Education, URL https://freestatistics.org/blog/index.php?pk=233484, Retrieved Thu, 16 May 2024 23:24:24 +0000
QR Codes:

Original text written by user:
IsPrivate?No (this computation is public)
User-defined keywords
Estimated Impact96
Family? (F = Feedback message, R = changed R code, M = changed R Module, P = changed Parameters, D = changed Data)
-     [Univariate Data Series] [] [2014-02-02 14:29:18] [1230435f6fa475afaecdfd296e9ed611]
- RMPD    [Kernel Density Estimation] [] [2014-02-09 20:06:23] [a17c9baa293c9bc97942594e3a0541eb] [Current]
Feedback Forum

Post a new message
Dataseries X:
329.6
327.2
326.3
315.4
308.6
302.6
295.6
291.5
288.1
281.1
282.4
284.9
274.2
265.7
259.7
253.7
249.5
244.6
243
239.2
235.7
231.1
226.7
221.7
219.4
214.2
211.7
207.7
204.7
201.2
199.9
197.8
195.2
194.3
192.8
188.5
183.2
181.4
180.5
180.2
179.2
177.1
174.2
172.1
171.1
169.8
169.5
165.5
167.2
167.6
171.8
175.9
180
184.9
184.6
187.6
191.5
195.5
201.6
203.5
209.1
217.1
227.6
237.2
245.6
253.2
260.5
266.1
273
280.8
284.4
288.5
284.8
288.9
299.6
307.8
311.4
322
317.8
319.1
322.3
323.1
322.8
325
323.2
318.8
328.2
329.2
326.5
330.1
323.8
321.8
319.6
315.5
310.7
306.5
295.1
288
293.9
289.3
287.4
282.6
276.9
272.7
267.9
262.8
256.6
250.7
243.2
235.1
229.6
222.9
217.6
214.1
210.8
208
202.6
199
195.5
192.1
189.4
182.4
179.2
176.5
174
171.7
169.8
168.3
166.4
165.9
166.4
170.6
177.6
183.4
191.9
201.7
210.6
221.6
232.2
240.4
248.4
258.5
265
271.7
273.9
277.8
273.4
270.9
268.3
264.7
264.1
264.5
262.2
258.6
259.4
262.7
264.9
260.5
256.4
254.7
254.8
255.3
256.8
258.7
259.8
261.7
264.7
269.1
279
283.4
285.5
288.2
292.1
295.6
302.4
308.5
314.1
319.8
329.7
339.7


Summary of computational transaction
Raw Inputview raw input (R code)
Raw Outputview raw output of R engine
Computing time6 seconds
R Server'Herman Ole Andreas Wold' @ wold.wessa.net

\begin{tabular}{lllllllll}
\hline
Summary of computational transaction \tabularnewline
Raw Input & view raw input (R code)  \tabularnewline
Raw Output & view raw output of R engine  \tabularnewline
Computing time & 6 seconds \tabularnewline
R Server & 'Herman Ole Andreas Wold' @ wold.wessa.net \tabularnewline
\hline
\end{tabular}
%Source: https://freestatistics.org/blog/index.php?pk=233484&T=0

[TABLE]
[ROW][C]Summary of computational transaction[/C][/ROW]
[ROW][C]Raw Input[/C][C]view raw input (R code) [/C][/ROW]
[ROW][C]Raw Output[/C][C]view raw output of R engine [/C][/ROW]
[ROW][C]Computing time[/C][C]6 seconds[/C][/ROW]
[ROW][C]R Server[/C][C]'Herman Ole Andreas Wold' @ wold.wessa.net[/C][/ROW]
[/TABLE]
Source: https://freestatistics.org/blog/index.php?pk=233484&T=0

Globally Unique Identifier (entire table): ba.freestatistics.org/blog/index.php?pk=233484&T=0

As an alternative you can also use a QR Code:  

The GUIDs for individual cells are displayed in the table below:

Summary of computational transaction
Raw Inputview raw input (R code)
Raw Outputview raw output of R engine
Computing time6 seconds
R Server'Herman Ole Andreas Wold' @ wold.wessa.net


Properties of Density Trace
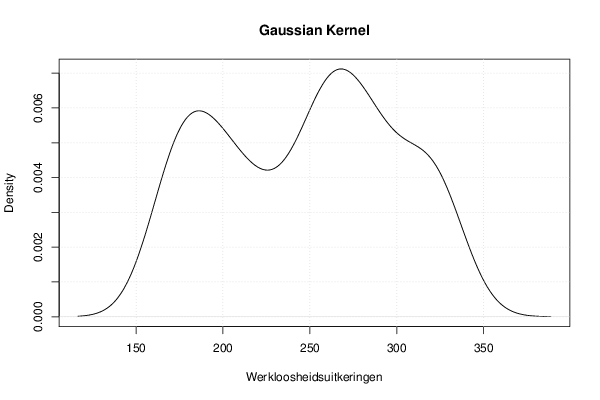
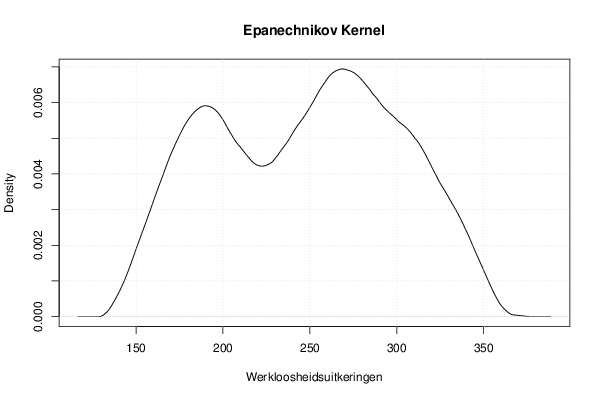
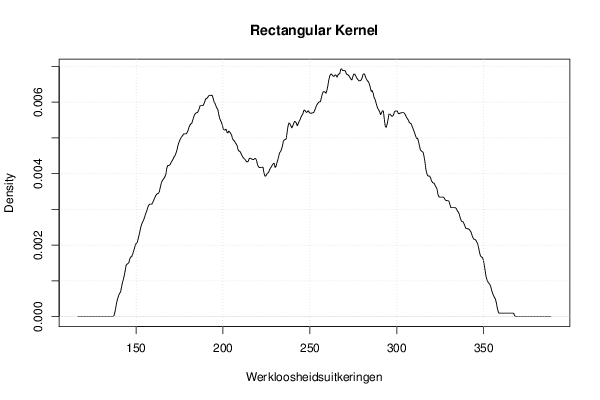
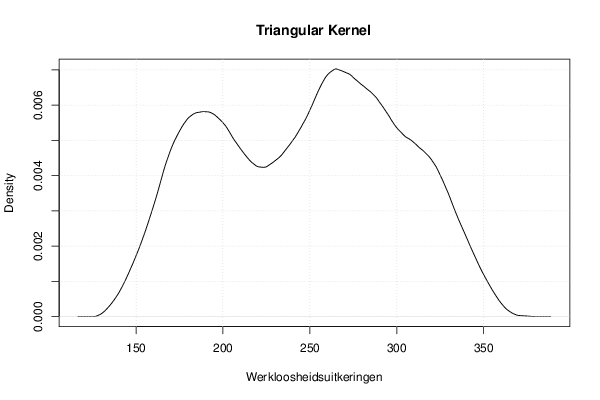
Bandwidth16.2975792909611
#Observations180

\begin{tabular}{lllllllll}
\hline
Properties of Density Trace \tabularnewline
Bandwidth & 16.2975792909611 \tabularnewline
#Observations & 180 \tabularnewline
\hline
\end{tabular}
%Source: https://freestatistics.org/blog/index.php?pk=233484&T=1

[TABLE]
[ROW][C]Properties of Density Trace[/C][/ROW]
[ROW][C]Bandwidth[/C][C]16.2975792909611[/C][/ROW]
[ROW][C]#Observations[/C][C]180[/C][/ROW]
[/TABLE]
Source: https://freestatistics.org/blog/index.php?pk=233484&T=1

Globally Unique Identifier (entire table): ba.freestatistics.org/blog/index.php?pk=233484&T=1

As an alternative you can also use a QR Code:  

The GUIDs for individual cells are displayed in the table below:

Properties of Density Trace
Bandwidth16.2975792909611
#Observations180


Maximum Density Values
Kernelx-valuemax. density
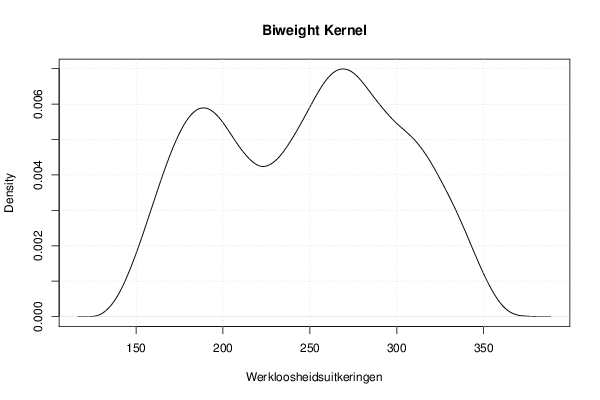
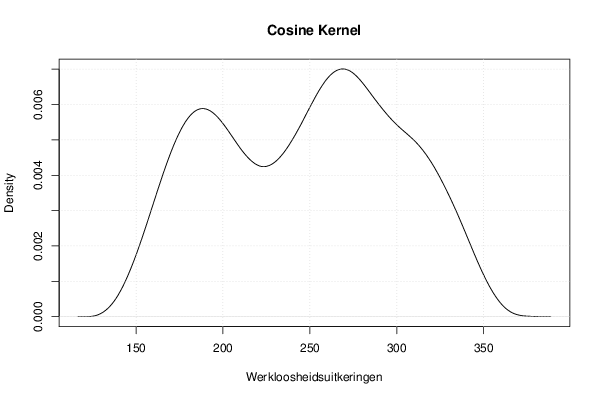
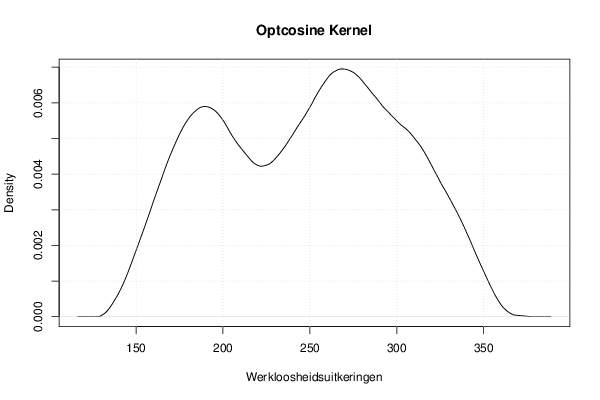
Gaussian267.7694443419850.00712088975466367
Epanechnikov268.8339667519490.00694464260820944
Rectangular268.3017055469670.00693152965564837
Triangular265.1081383170750.00702785597883299
Biweight268.8339667519490.00698984241787351
Cosine268.8339667519490.00700764504718015
Optcosine268.3017055469670.00695199434259777

\begin{tabular}{lllllllll}
\hline
Maximum Density Values \tabularnewline
Kernel & x-value & max. density \tabularnewline
Gaussian & 267.769444341985 & 0.00712088975466367 \tabularnewline
Epanechnikov & 268.833966751949 & 0.00694464260820944 \tabularnewline
Rectangular & 268.301705546967 & 0.00693152965564837 \tabularnewline
Triangular & 265.108138317075 & 0.00702785597883299 \tabularnewline
Biweight & 268.833966751949 & 0.00698984241787351 \tabularnewline
Cosine & 268.833966751949 & 0.00700764504718015 \tabularnewline
Optcosine & 268.301705546967 & 0.00695199434259777 \tabularnewline
\hline
\end{tabular}
%Source: https://freestatistics.org/blog/index.php?pk=233484&T=2

[TABLE]
[ROW][C]Maximum Density Values[/C][/ROW]
[ROW][C]Kernel[/C][C]x-value[/C][C]max. density[/C][/ROW]
[ROW][C]Gaussian[/C][C]267.769444341985[/C][C]0.00712088975466367[/C][/ROW]
[ROW][C]Epanechnikov[/C][C]268.833966751949[/C][C]0.00694464260820944[/C][/ROW]
[ROW][C]Rectangular[/C][C]268.301705546967[/C][C]0.00693152965564837[/C][/ROW]
[ROW][C]Triangular[/C][C]265.108138317075[/C][C]0.00702785597883299[/C][/ROW]
[ROW][C]Biweight[/C][C]268.833966751949[/C][C]0.00698984241787351[/C][/ROW]
[ROW][C]Cosine[/C][C]268.833966751949[/C][C]0.00700764504718015[/C][/ROW]
[ROW][C]Optcosine[/C][C]268.301705546967[/C][C]0.00695199434259777[/C][/ROW]
[/TABLE]
Source: https://freestatistics.org/blog/index.php?pk=233484&T=2

Globally Unique Identifier (entire table): ba.freestatistics.org/blog/index.php?pk=233484&T=2

As an alternative you can also use a QR Code:  

The GUIDs for individual cells are displayed in the table below:

Maximum Density Values
Kernelx-valuemax. density
Gaussian267.7694443419850.00712088975466367
Epanechnikov268.8339667519490.00694464260820944
Rectangular268.3017055469670.00693152965564837
Triangular265.1081383170750.00702785597883299
Biweight268.8339667519490.00698984241787351
Cosine268.8339667519490.00700764504718015
Optcosine268.3017055469670.00695199434259777


Parameters (Session):
par1 = 0 ; par2 = no ; par3 = 512 ;
Parameters (R input):
par1 = 0 ; par2 = no ; par3 = 512 ;
R code (references can be found in the software module):
if (par1 == '0') bw <- 'nrd0'
if (par1 != '0') bw <- as.numeric(par1)
par3 <- as.numeric(par3)
mydensity <- array(NA, dim=c(par3,8))
bitmap(file='density1.png')
mydensity1<-density(x,bw=bw,kernel='gaussian',na.rm=TRUE)
mydensity[,8] = signif(mydensity1$x,3)
mydensity[,1] = signif(mydensity1$y,3)
plot(mydensity1,main='Gaussian Kernel',xlab=xlab,ylab=ylab)
grid()
dev.off()
mydensity1
bitmap(file='density2.png')
mydensity2<-density(x,bw=bw,kernel='epanechnikov',na.rm=TRUE)
mydensity[,2] = signif(mydensity2$y,3)
plot(mydensity2,main='Epanechnikov Kernel',xlab=xlab,ylab=ylab)
grid()
dev.off()
bitmap(file='density3.png')
mydensity3<-density(x,bw=bw,kernel='rectangular',na.rm=TRUE)
mydensity[,3] = signif(mydensity3$y,3)
plot(mydensity3,main='Rectangular Kernel',xlab=xlab,ylab=ylab)
grid()
dev.off()
bitmap(file='density4.png')
mydensity4<-density(x,bw=bw,kernel='triangular',na.rm=TRUE)
mydensity[,4] = signif(mydensity4$y,3)
plot(mydensity4,main='Triangular Kernel',xlab=xlab,ylab=ylab)
grid()
dev.off()
bitmap(file='density5.png')
mydensity5<-density(x,bw=bw,kernel='biweight',na.rm=TRUE)
mydensity[,5] = signif(mydensity5$y,3)
plot(mydensity5,main='Biweight Kernel',xlab=xlab,ylab=ylab)
grid()
dev.off()
bitmap(file='density6.png')
mydensity6<-density(x,bw=bw,kernel='cosine',na.rm=TRUE)
mydensity[,6] = signif(mydensity6$y,3)
plot(mydensity6,main='Cosine Kernel',xlab=xlab,ylab=ylab)
grid()
dev.off()
bitmap(file='density7.png')
mydensity7<-density(x,bw=bw,kernel='optcosine',na.rm=TRUE)
mydensity[,7] = signif(mydensity7$y,3)
plot(mydensity7,main='Optcosine Kernel',xlab=xlab,ylab=ylab)
grid()
dev.off()
load(file='createtable')
a<-table.start()
a<-table.row.start(a)
a<-table.element(a,'Properties of Density Trace',2,TRUE)
a<-table.row.end(a)
a<-table.row.start(a)
a<-table.element(a,'Bandwidth',header=TRUE)
a<-table.element(a,mydensity1$bw)
a<-table.row.end(a)
a<-table.row.start(a)
a<-table.element(a,'#Observations',header=TRUE)
a<-table.element(a,mydensity1$n)
a<-table.row.end(a)
a<-table.end(a)
table.save(a,file='mytable.tab')
a<-table.start()
a<-table.row.start(a)
a<-table.element(a,'Maximum Density Values',3,TRUE)
a<-table.row.end(a)
a<-table.row.start(a)
a<-table.element(a,'Kernel',1,TRUE)
a<-table.element(a,'x-value',1,TRUE)
a<-table.element(a,'max. density',1,TRUE)
a<-table.row.end(a)
a<-table.row.start(a)
a<-table.element(a,'Gaussian',1,TRUE)
a<-table.element(a,mydensity1$x[mydensity1$y==max(mydensity1$y)],1)
a<-table.element(a,mydensity1$y[mydensity1$y==max(mydensity1$y)],1)
a<-table.row.end(a)
a<-table.row.start(a)
a<-table.element(a,'Epanechnikov',1,TRUE)
a<-table.element(a,mydensity2$x[mydensity2$y==max(mydensity2$y)],1)
a<-table.element(a,mydensity2$y[mydensity2$y==max(mydensity2$y)],1)
a<-table.row.end(a)
a<-table.row.start(a)
a<-table.element(a,'Rectangular',1,TRUE)
a<-table.element(a,mydensity3$x[mydensity3$y==max(mydensity3$y)],1)
a<-table.element(a,mydensity3$y[mydensity3$y==max(mydensity3$y)],1)
a<-table.row.end(a)
a<-table.row.start(a)
a<-table.element(a,'Triangular',1,TRUE)
a<-table.element(a,mydensity4$x[mydensity4$y==max(mydensity4$y)],1)
a<-table.element(a,mydensity4$y[mydensity4$y==max(mydensity4$y)],1)
a<-table.row.end(a)
a<-table.row.start(a)
a<-table.element(a,'Biweight',1,TRUE)
a<-table.element(a,mydensity5$x[mydensity5$y==max(mydensity5$y)],1)
a<-table.element(a,mydensity5$y[mydensity5$y==max(mydensity5$y)],1)
a<-table.row.end(a)
a<-table.row.start(a)
a<-table.element(a,'Cosine',1,TRUE)
a<-table.element(a,mydensity6$x[mydensity6$y==max(mydensity6$y)],1)
a<-table.element(a,mydensity6$y[mydensity6$y==max(mydensity6$y)],1)
a<-table.row.end(a)
a<-table.row.start(a)
a<-table.element(a,'Optcosine',1,TRUE)
a<-table.element(a,mydensity7$x[mydensity7$y==max(mydensity7$y)],1)
a<-table.element(a,mydensity7$y[mydensity7$y==max(mydensity7$y)],1)
a<-table.row.end(a)
a<-table.end(a)
table.save(a,file='mytable2.tab')
if (par2=='yes') {
a<-table.start()
a<-table.row.start(a)
a<-table.element(a,'Kernel Density Values',8,TRUE)
a<-table.row.end(a)
a<-table.row.start(a)
a<-table.element(a,'x-value',1,TRUE)
a<-table.element(a,'Gaussian',1,TRUE)
a<-table.element(a,'Epanechnikov',1,TRUE)
a<-table.element(a,'Rectangular',1,TRUE)
a<-table.element(a,'Triangular',1,TRUE)
a<-table.element(a,'Biweight',1,TRUE)
a<-table.element(a,'Cosine',1,TRUE)
a<-table.element(a,'Optcosine',1,TRUE)
a<-table.row.end(a)
for(i in 1:par3) {
a<-table.row.start(a)
a<-table.element(a,mydensity[i,8],1,TRUE)
for(j in 1:7) {
a<-table.element(a,mydensity[i,j],1)
}
a<-table.row.end(a)
}
a<-table.end(a)
table.save(a,file='mytable1.tab')
}