Free Statistics
of Irreproducible Research!
Description of Statistical Computation | |||||||||||||||||||||||||||||||||||||||||
|---|---|---|---|---|---|---|---|---|---|---|---|---|---|---|---|---|---|---|---|---|---|---|---|---|---|---|---|---|---|---|---|---|---|---|---|---|---|---|---|---|---|
| Author's title | |||||||||||||||||||||||||||||||||||||||||
| Author | *Unverified author* | ||||||||||||||||||||||||||||||||||||||||
| R Software Module | rwasp_univariatedataseries.wasp | ||||||||||||||||||||||||||||||||||||||||
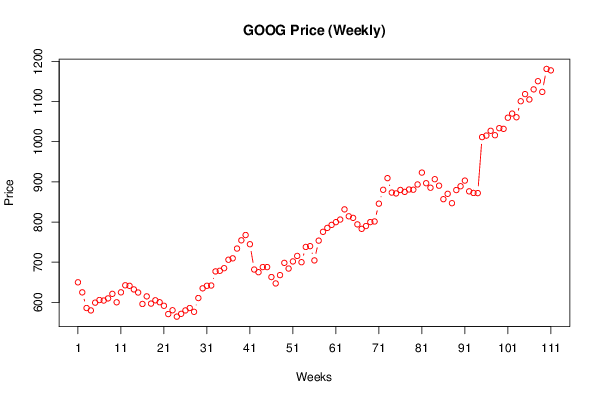
| Title produced by software | Univariate Data Series | ||||||||||||||||||||||||||||||||||||||||
| Date of computation | Sun, 09 Feb 2014 18:28:57 -0500 | ||||||||||||||||||||||||||||||||||||||||
| Cite this page as follows | Statistical Computations at FreeStatistics.org, Office for Research Development and Education, URL https://freestatistics.org/blog/index.php?v=date/2014/Feb/09/t1391988684db1670q2rm6twb8.htm/, Retrieved Thu, 16 May 2024 17:55:49 +0000 | ||||||||||||||||||||||||||||||||||||||||
| Statistical Computations at FreeStatistics.org, Office for Research Development and Education, URL https://freestatistics.org/blog/index.php?pk=233534, Retrieved Thu, 16 May 2024 17:55:49 +0000 | |||||||||||||||||||||||||||||||||||||||||
| QR Codes: | |||||||||||||||||||||||||||||||||||||||||
|
| |||||||||||||||||||||||||||||||||||||||||
| Original text written by user: | |||||||||||||||||||||||||||||||||||||||||
| IsPrivate? | No (this computation is public) | ||||||||||||||||||||||||||||||||||||||||
| User-defined keywords | |||||||||||||||||||||||||||||||||||||||||
| Estimated Impact | 72 | ||||||||||||||||||||||||||||||||||||||||
Tree of Dependent Computations | |||||||||||||||||||||||||||||||||||||||||
| Family? (F = Feedback message, R = changed R code, M = changed R Module, P = changed Parameters, D = changed Data) | |||||||||||||||||||||||||||||||||||||||||
| - [Univariate Data Series] [GOOG Weekly price] [2014-02-09 23:28:57] [d41d8cd98f00b204e9800998ecf8427e] [Current] | |||||||||||||||||||||||||||||||||||||||||
| Feedback Forum | |||||||||||||||||||||||||||||||||||||||||
Post a new message | |||||||||||||||||||||||||||||||||||||||||
Dataset | |||||||||||||||||||||||||||||||||||||||||
| Dataseries X: | |||||||||||||||||||||||||||||||||||||||||
650.02 624.99 585.99 579.98 599.33 605.91 604.64 609.90 621.25 600.25 625.04 642.59 641.24 632.32 624.60 596.06 614.98 596.97 605.23 600.40 591.53 570.98 580.45 564.51 571.48 580.07 585.98 576.52 610.82 634.96 641.33 642.00 677.14 678.63 685.09 706.15 709.68 733.99 754.50 767.65 744.75 681.79 675.15 687.92 687.92 663.03 647.18 667.97 698.37 684.21 701.96 715.63 700.01 737.97 739.99 704.51 753.67 775.60 785.37 792.89 799.71 806.19 831.52 814.30 810.31 794.19 783.05 790.05 799.87 801.42 845.72 880.23 909.18 873.32 871.22 879.73 875.04 880.93 880.37 893.49 923.00 896.60 885.35 906.57 890.41 856.91 870.21 846.90 879.58 889.07 903.11 876.39 872.35 871.99 1011.41 1015.20 1027.04 1016.03 1033.56 1031.89 1059.59 1069.87 1060.79 1100.62 1118.40 1105.00 1130.18 1150.53 1123.83 1180.97 1177.44 | |||||||||||||||||||||||||||||||||||||||||
Tables (Output of Computation) | |||||||||||||||||||||||||||||||||||||||||
| |||||||||||||||||||||||||||||||||||||||||
Figures (Output of Computation) | |||||||||||||||||||||||||||||||||||||||||
Input Parameters & R Code | |||||||||||||||||||||||||||||||||||||||||
| Parameters (Session): | |||||||||||||||||||||||||||||||||||||||||
| par1 = GOOG WEEKLY STOCK PRICE ; par2 = http://finance.yahoo.com/q/hp?s=GOOG+Historical+Prices ; par3 = Wekelijkse sluit prijs van het aandeel van Google inc. op de NYSE ; par4 = No season ; | |||||||||||||||||||||||||||||||||||||||||
| Parameters (R input): | |||||||||||||||||||||||||||||||||||||||||
| par1 = GOOG WEEKLY STOCK PRICE ; par2 = http://finance.yahoo.com/q/hp?s=GOOG+Historical+Prices ; par3 = Wekelijkse sluit prijs van het aandeel van Google inc. op de NYSE ; par4 = No season ; | |||||||||||||||||||||||||||||||||||||||||
| R code (references can be found in the software module): | |||||||||||||||||||||||||||||||||||||||||
par4 <- 'No season' | |||||||||||||||||||||||||||||||||||||||||