Free Statistics

of Irreproducible Research!

Author's title

Author*Unverified author*
R Software Modulerwasp_centraltendency.wasp
Title produced by softwareCentral Tendency
Date of computationSun, 23 Feb 2014 07:42:25 -0500
Cite this page as followsStatistical Computations at FreeStatistics.org, Office for Research Development and Education, URL https://freestatistics.org/blog/index.php?v=date/2014/Feb/23/t1393159365as27g622r3htlt3.htm/, Retrieved Wed, 15 May 2024 13:50:26 +0000
Statistical Computations at FreeStatistics.org, Office for Research Development and Education, URL https://freestatistics.org/blog/index.php?pk=233971, Retrieved Wed, 15 May 2024 13:50:26 +0000
QR Codes:

Original text written by user:
IsPrivate?No (this computation is public)
User-defined keywords
Estimated Impact130
Family? (F = Feedback message, R = changed R code, M = changed R Module, P = changed Parameters, D = changed Data)
-       [Central Tendency] [] [2014-02-23 12:42:25] [96d7fff632246663047c645f81fe87bb] [Current]
Feedback Forum

Post a new message
Dataseries X:
1,005
1,026
1,043
1,068
1,07
1,091
1,102
1,091
1,121
1,134
1,225
1,191
1,184
1,207
1,271
1,299
1,411
1,437
1,462
1,36
1,33
1,234
1,142
1,017
1,016
1,013
1
1,018
1,024
1,075
1,055
1,091
1,062
1,083
1,099
1,097
1,138
1,138
1,181
1,223
1,23
1,232
1,209
1,209
1,218
1,225
1,242
1,294
1,33
1,357
1,407
1,42
1,386
1,377
1,393
1,371
1,393
1,405
1,438
1,424
1,47
1,481
1,506
1,503
1,478
1,433
1,459
1,51
1,526
1,543
1,529
1,499


Summary of computational transaction
Raw Inputview raw input (R code)
Raw Outputview raw output of R engine
Computing time3 seconds
R Server'Herman Ole Andreas Wold' @ wold.wessa.net

\begin{tabular}{lllllllll}
\hline
Summary of computational transaction \tabularnewline
Raw Input & view raw input (R code)  \tabularnewline
Raw Output & view raw output of R engine  \tabularnewline
Computing time & 3 seconds \tabularnewline
R Server & 'Herman Ole Andreas Wold' @ wold.wessa.net \tabularnewline
\hline
\end{tabular}
%Source: https://freestatistics.org/blog/index.php?pk=233971&T=0

[TABLE]
[ROW][C]Summary of computational transaction[/C][/ROW]
[ROW][C]Raw Input[/C][C]view raw input (R code) [/C][/ROW]
[ROW][C]Raw Output[/C][C]view raw output of R engine [/C][/ROW]
[ROW][C]Computing time[/C][C]3 seconds[/C][/ROW]
[ROW][C]R Server[/C][C]'Herman Ole Andreas Wold' @ wold.wessa.net[/C][/ROW]
[/TABLE]
Source: https://freestatistics.org/blog/index.php?pk=233971&T=0

Globally Unique Identifier (entire table): ba.freestatistics.org/blog/index.php?pk=233971&T=0

As an alternative you can also use a QR Code:  

The GUIDs for individual cells are displayed in the table below:

Summary of computational transaction
Raw Inputview raw input (R code)
Raw Outputview raw output of R engine
Computing time3 seconds
R Server'Herman Ole Andreas Wold' @ wold.wessa.net


Central Tendency - Ungrouped Data
MeasureValueS.E.Value/S.E.
Arithmetic Mean1.254597222222220.019900266390057163.0442426061726
Geometric Mean1.24338421407537
Harmonic Mean1.23225030496315
Quadratic Mean1.26575339335029
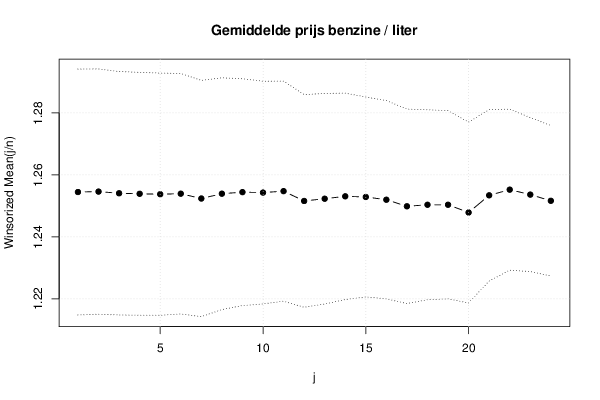
Winsorized Mean ( 1 / 24 )1.254472222222220.019849078180743963.2005280446333
Winsorized Mean ( 2 / 24 )1.254611111111110.01979414358659963.3829448403367
Winsorized Mean ( 3 / 24 )1.254069444444440.019647194609426963.8294407611117
Winsorized Mean ( 4 / 24 )1.253902777777780.019597207249317563.9837483895288
Winsorized Mean ( 5 / 24 )1.253763888888890.019547817590640364.1383051113186
Winsorized Mean ( 6 / 24 )1.253930555555560.019404044703524464.6221225891013
Winsorized Mean ( 7 / 24 )1.2523750.019068081195066865.6791308568589
Winsorized Mean ( 8 / 24 )1.253930555555560.018703804086858867.0414718702363
Winsorized Mean ( 9 / 24 )1.254430555555560.018302201762466368.5398714229076
Winsorized Mean ( 10 / 24 )1.254291666666670.017971715709193769.7925388406301
Winsorized Mean ( 11 / 24 )1.254750.017760334446617670.6490074143262
Winsorized Mean ( 12 / 24 )1.251583333333330.017159312317733772.939014696985
Winsorized Mean ( 13 / 24 )1.252305555555560.016998085583185773.6733292362241
Winsorized Mean ( 14 / 24 )1.253083333333330.016653219340340775.2457112180029
Winsorized Mean ( 15 / 24 )1.2528750.016132786452095677.6601738156184
Winsorized Mean ( 16 / 24 )1.251986111111110.016000653999930578.2459336422468
Winsorized Mean ( 17 / 24 )1.249861111111110.015689790465944479.6607904881843
Winsorized Mean ( 18 / 24 )1.250361111111110.015332890705434681.5476438939157
Winsorized Mean ( 19 / 24 )1.250361111111110.015182835955474382.3535942018976
Winsorized Mean ( 20 / 24 )1.247861111111110.014593008937219485.5108851422988
Winsorized Mean ( 21 / 24 )1.253402777777780.013828845073716690.6368370674727
Winsorized Mean ( 22 / 24 )1.255236111111110.012996229937495296.5846339398516
Winsorized Mean ( 23 / 24 )1.253638888888890.0124237156717998100.906920442045
Winsorized Mean ( 24 / 24 )1.251638888888890.0121454298152565103.054309969058
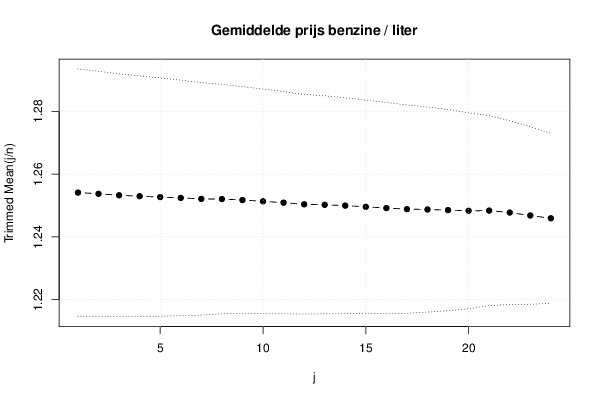
Trimmed Mean ( 1 / 24 )1.254114285714290.019710351274212663.6271910260202
Trimmed Mean ( 2 / 24 )1.253735294117650.019535964646841564.1757556784043
Trimmed Mean ( 3 / 24 )1.253257575757580.019352686767759964.7588415395326
Trimmed Mean ( 4 / 24 )1.2529531250.019188037124578365.2986606636834
Trimmed Mean ( 5 / 24 )1.252677419354840.018996461779065765.9426704785256
Trimmed Mean ( 6 / 24 )1.252416666666670.018768998535520466.7279431183537
Trimmed Mean ( 7 / 24 )1.252103448275860.018521185032610767.6038518092256
Trimmed Mean ( 8 / 24 )1.252053571428570.018291957988165668.4483078431852
Trimmed Mean ( 9 / 24 )1.251740740740740.018082371993984969.2243662035672
Trimmed Mean ( 10 / 24 )1.251326923076920.017896988656804469.9182944724711
Trimmed Mean ( 11 / 24 )1.25090.017718945239719170.5967529712752
Trimmed Mean ( 12 / 24 )1.2503750.017519407298541871.3708505483559
Trimmed Mean ( 13 / 24 )1.250217391304350.017371944538445971.9676135586025
Trimmed Mean ( 14 / 24 )1.249954545454550.017190358012863472.7125371396695
Trimmed Mean ( 15 / 24 )1.249571428571430.017000995491012273.4998976519954
Trimmed Mean ( 16 / 24 )1.2491750.016835169517777674.2003220508648
Trimmed Mean ( 17 / 24 )1.248842105263160.016610658556770175.1831783788101
Trimmed Mean ( 18 / 24 )1.248722222222220.016347545377178476.3859156473407
Trimmed Mean ( 19 / 24 )1.248529411764710.016039514224784277.8408494339238
Trimmed Mean ( 20 / 24 )1.24831250.01561278151299779.9545230912782
Trimmed Mean ( 21 / 24 )1.248366666666670.015141742815109782.445375140102
Trimmed Mean ( 22 / 24 )1.247750.014652737342906785.1547373572509
Trimmed Mean ( 23 / 24 )1.246807692307690.014155185973374988.081336031393
Trimmed Mean ( 24 / 24 )1.245916666666670.013555564217546991.911826514303
Median1.2275
Midrange1.2715
Midmean - Weighted Average at Xnp1.23658974358974
Midmean - Weighted Average at X(n+1)p1.24872222222222
Midmean - Empirical Distribution Function1.23658974358974
Midmean - Empirical Distribution Function - Averaging1.24872222222222
Midmean - Empirical Distribution Function - Interpolation1.24872222222222
Midmean - Closest Observation1.23658974358974
Midmean - True Basic - Statistics Graphics Toolkit1.24872222222222
Midmean - MS Excel (old versions)1.24095
Number of observations72

\begin{tabular}{lllllllll}
\hline
Central Tendency - Ungrouped Data \tabularnewline
Measure & Value & S.E. & Value/S.E. \tabularnewline
Arithmetic Mean & 1.25459722222222 & 0.0199002663900571 & 63.0442426061726 \tabularnewline
Geometric Mean & 1.24338421407537 &  &  \tabularnewline
Harmonic Mean & 1.23225030496315 &  &  \tabularnewline
Quadratic Mean & 1.26575339335029 &  &  \tabularnewline
Winsorized Mean ( 1 / 24 ) & 1.25447222222222 & 0.0198490781807439 & 63.2005280446333 \tabularnewline
Winsorized Mean ( 2 / 24 ) & 1.25461111111111 & 0.019794143586599 & 63.3829448403367 \tabularnewline
Winsorized Mean ( 3 / 24 ) & 1.25406944444444 & 0.0196471946094269 & 63.8294407611117 \tabularnewline
Winsorized Mean ( 4 / 24 ) & 1.25390277777778 & 0.0195972072493175 & 63.9837483895288 \tabularnewline
Winsorized Mean ( 5 / 24 ) & 1.25376388888889 & 0.0195478175906403 & 64.1383051113186 \tabularnewline
Winsorized Mean ( 6 / 24 ) & 1.25393055555556 & 0.0194040447035244 & 64.6221225891013 \tabularnewline
Winsorized Mean ( 7 / 24 ) & 1.252375 & 0.0190680811950668 & 65.6791308568589 \tabularnewline
Winsorized Mean ( 8 / 24 ) & 1.25393055555556 & 0.0187038040868588 & 67.0414718702363 \tabularnewline
Winsorized Mean ( 9 / 24 ) & 1.25443055555556 & 0.0183022017624663 & 68.5398714229076 \tabularnewline
Winsorized Mean ( 10 / 24 ) & 1.25429166666667 & 0.0179717157091937 & 69.7925388406301 \tabularnewline
Winsorized Mean ( 11 / 24 ) & 1.25475 & 0.0177603344466176 & 70.6490074143262 \tabularnewline
Winsorized Mean ( 12 / 24 ) & 1.25158333333333 & 0.0171593123177337 & 72.939014696985 \tabularnewline
Winsorized Mean ( 13 / 24 ) & 1.25230555555556 & 0.0169980855831857 & 73.6733292362241 \tabularnewline
Winsorized Mean ( 14 / 24 ) & 1.25308333333333 & 0.0166532193403407 & 75.2457112180029 \tabularnewline
Winsorized Mean ( 15 / 24 ) & 1.252875 & 0.0161327864520956 & 77.6601738156184 \tabularnewline
Winsorized Mean ( 16 / 24 ) & 1.25198611111111 & 0.0160006539999305 & 78.2459336422468 \tabularnewline
Winsorized Mean ( 17 / 24 ) & 1.24986111111111 & 0.0156897904659444 & 79.6607904881843 \tabularnewline
Winsorized Mean ( 18 / 24 ) & 1.25036111111111 & 0.0153328907054346 & 81.5476438939157 \tabularnewline
Winsorized Mean ( 19 / 24 ) & 1.25036111111111 & 0.0151828359554743 & 82.3535942018976 \tabularnewline
Winsorized Mean ( 20 / 24 ) & 1.24786111111111 & 0.0145930089372194 & 85.5108851422988 \tabularnewline
Winsorized Mean ( 21 / 24 ) & 1.25340277777778 & 0.0138288450737166 & 90.6368370674727 \tabularnewline
Winsorized Mean ( 22 / 24 ) & 1.25523611111111 & 0.0129962299374952 & 96.5846339398516 \tabularnewline
Winsorized Mean ( 23 / 24 ) & 1.25363888888889 & 0.0124237156717998 & 100.906920442045 \tabularnewline
Winsorized Mean ( 24 / 24 ) & 1.25163888888889 & 0.0121454298152565 & 103.054309969058 \tabularnewline
Trimmed Mean ( 1 / 24 ) & 1.25411428571429 & 0.0197103512742126 & 63.6271910260202 \tabularnewline
Trimmed Mean ( 2 / 24 ) & 1.25373529411765 & 0.0195359646468415 & 64.1757556784043 \tabularnewline
Trimmed Mean ( 3 / 24 ) & 1.25325757575758 & 0.0193526867677599 & 64.7588415395326 \tabularnewline
Trimmed Mean ( 4 / 24 ) & 1.252953125 & 0.0191880371245783 & 65.2986606636834 \tabularnewline
Trimmed Mean ( 5 / 24 ) & 1.25267741935484 & 0.0189964617790657 & 65.9426704785256 \tabularnewline
Trimmed Mean ( 6 / 24 ) & 1.25241666666667 & 0.0187689985355204 & 66.7279431183537 \tabularnewline
Trimmed Mean ( 7 / 24 ) & 1.25210344827586 & 0.0185211850326107 & 67.6038518092256 \tabularnewline
Trimmed Mean ( 8 / 24 ) & 1.25205357142857 & 0.0182919579881656 & 68.4483078431852 \tabularnewline
Trimmed Mean ( 9 / 24 ) & 1.25174074074074 & 0.0180823719939849 & 69.2243662035672 \tabularnewline
Trimmed Mean ( 10 / 24 ) & 1.25132692307692 & 0.0178969886568044 & 69.9182944724711 \tabularnewline
Trimmed Mean ( 11 / 24 ) & 1.2509 & 0.0177189452397191 & 70.5967529712752 \tabularnewline
Trimmed Mean ( 12 / 24 ) & 1.250375 & 0.0175194072985418 & 71.3708505483559 \tabularnewline
Trimmed Mean ( 13 / 24 ) & 1.25021739130435 & 0.0173719445384459 & 71.9676135586025 \tabularnewline
Trimmed Mean ( 14 / 24 ) & 1.24995454545455 & 0.0171903580128634 & 72.7125371396695 \tabularnewline
Trimmed Mean ( 15 / 24 ) & 1.24957142857143 & 0.0170009954910122 & 73.4998976519954 \tabularnewline
Trimmed Mean ( 16 / 24 ) & 1.249175 & 0.0168351695177776 & 74.2003220508648 \tabularnewline
Trimmed Mean ( 17 / 24 ) & 1.24884210526316 & 0.0166106585567701 & 75.1831783788101 \tabularnewline
Trimmed Mean ( 18 / 24 ) & 1.24872222222222 & 0.0163475453771784 & 76.3859156473407 \tabularnewline
Trimmed Mean ( 19 / 24 ) & 1.24852941176471 & 0.0160395142247842 & 77.8408494339238 \tabularnewline
Trimmed Mean ( 20 / 24 ) & 1.2483125 & 0.015612781512997 & 79.9545230912782 \tabularnewline
Trimmed Mean ( 21 / 24 ) & 1.24836666666667 & 0.0151417428151097 & 82.445375140102 \tabularnewline
Trimmed Mean ( 22 / 24 ) & 1.24775 & 0.0146527373429067 & 85.1547373572509 \tabularnewline
Trimmed Mean ( 23 / 24 ) & 1.24680769230769 & 0.0141551859733749 & 88.081336031393 \tabularnewline
Trimmed Mean ( 24 / 24 ) & 1.24591666666667 & 0.0135555642175469 & 91.911826514303 \tabularnewline
Median & 1.2275 &  &  \tabularnewline
Midrange & 1.2715 &  &  \tabularnewline
Midmean - Weighted Average at Xnp & 1.23658974358974 &  &  \tabularnewline
Midmean - Weighted Average at X(n+1)p & 1.24872222222222 &  &  \tabularnewline
Midmean - Empirical Distribution Function & 1.23658974358974 &  &  \tabularnewline
Midmean - Empirical Distribution Function - Averaging & 1.24872222222222 &  &  \tabularnewline
Midmean - Empirical Distribution Function - Interpolation & 1.24872222222222 &  &  \tabularnewline
Midmean - Closest Observation & 1.23658974358974 &  &  \tabularnewline
Midmean - True Basic - Statistics Graphics Toolkit & 1.24872222222222 &  &  \tabularnewline
Midmean - MS Excel (old versions) & 1.24095 &  &  \tabularnewline
Number of observations & 72 &  &  \tabularnewline
\hline
\end{tabular}
%Source: https://freestatistics.org/blog/index.php?pk=233971&T=1

[TABLE]
[ROW][C]Central Tendency - Ungrouped Data[/C][/ROW]
[ROW][C]Measure[/C][C]Value[/C][C]S.E.[/C][C]Value/S.E.[/C][/ROW]
[ROW][C]Arithmetic Mean[/C][C]1.25459722222222[/C][C]0.0199002663900571[/C][C]63.0442426061726[/C][/ROW]
[ROW][C]Geometric Mean[/C][C]1.24338421407537[/C][C][/C][C][/C][/ROW]
[ROW][C]Harmonic Mean[/C][C]1.23225030496315[/C][C][/C][C][/C][/ROW]
[ROW][C]Quadratic Mean[/C][C]1.26575339335029[/C][C][/C][C][/C][/ROW]
[ROW][C]Winsorized Mean ( 1 / 24 )[/C][C]1.25447222222222[/C][C]0.0198490781807439[/C][C]63.2005280446333[/C][/ROW]
[ROW][C]Winsorized Mean ( 2 / 24 )[/C][C]1.25461111111111[/C][C]0.019794143586599[/C][C]63.3829448403367[/C][/ROW]
[ROW][C]Winsorized Mean ( 3 / 24 )[/C][C]1.25406944444444[/C][C]0.0196471946094269[/C][C]63.8294407611117[/C][/ROW]
[ROW][C]Winsorized Mean ( 4 / 24 )[/C][C]1.25390277777778[/C][C]0.0195972072493175[/C][C]63.9837483895288[/C][/ROW]
[ROW][C]Winsorized Mean ( 5 / 24 )[/C][C]1.25376388888889[/C][C]0.0195478175906403[/C][C]64.1383051113186[/C][/ROW]
[ROW][C]Winsorized Mean ( 6 / 24 )[/C][C]1.25393055555556[/C][C]0.0194040447035244[/C][C]64.6221225891013[/C][/ROW]
[ROW][C]Winsorized Mean ( 7 / 24 )[/C][C]1.252375[/C][C]0.0190680811950668[/C][C]65.6791308568589[/C][/ROW]
[ROW][C]Winsorized Mean ( 8 / 24 )[/C][C]1.25393055555556[/C][C]0.0187038040868588[/C][C]67.0414718702363[/C][/ROW]
[ROW][C]Winsorized Mean ( 9 / 24 )[/C][C]1.25443055555556[/C][C]0.0183022017624663[/C][C]68.5398714229076[/C][/ROW]
[ROW][C]Winsorized Mean ( 10 / 24 )[/C][C]1.25429166666667[/C][C]0.0179717157091937[/C][C]69.7925388406301[/C][/ROW]
[ROW][C]Winsorized Mean ( 11 / 24 )[/C][C]1.25475[/C][C]0.0177603344466176[/C][C]70.6490074143262[/C][/ROW]
[ROW][C]Winsorized Mean ( 12 / 24 )[/C][C]1.25158333333333[/C][C]0.0171593123177337[/C][C]72.939014696985[/C][/ROW]
[ROW][C]Winsorized Mean ( 13 / 24 )[/C][C]1.25230555555556[/C][C]0.0169980855831857[/C][C]73.6733292362241[/C][/ROW]
[ROW][C]Winsorized Mean ( 14 / 24 )[/C][C]1.25308333333333[/C][C]0.0166532193403407[/C][C]75.2457112180029[/C][/ROW]
[ROW][C]Winsorized Mean ( 15 / 24 )[/C][C]1.252875[/C][C]0.0161327864520956[/C][C]77.6601738156184[/C][/ROW]
[ROW][C]Winsorized Mean ( 16 / 24 )[/C][C]1.25198611111111[/C][C]0.0160006539999305[/C][C]78.2459336422468[/C][/ROW]
[ROW][C]Winsorized Mean ( 17 / 24 )[/C][C]1.24986111111111[/C][C]0.0156897904659444[/C][C]79.6607904881843[/C][/ROW]
[ROW][C]Winsorized Mean ( 18 / 24 )[/C][C]1.25036111111111[/C][C]0.0153328907054346[/C][C]81.5476438939157[/C][/ROW]
[ROW][C]Winsorized Mean ( 19 / 24 )[/C][C]1.25036111111111[/C][C]0.0151828359554743[/C][C]82.3535942018976[/C][/ROW]
[ROW][C]Winsorized Mean ( 20 / 24 )[/C][C]1.24786111111111[/C][C]0.0145930089372194[/C][C]85.5108851422988[/C][/ROW]
[ROW][C]Winsorized Mean ( 21 / 24 )[/C][C]1.25340277777778[/C][C]0.0138288450737166[/C][C]90.6368370674727[/C][/ROW]
[ROW][C]Winsorized Mean ( 22 / 24 )[/C][C]1.25523611111111[/C][C]0.0129962299374952[/C][C]96.5846339398516[/C][/ROW]
[ROW][C]Winsorized Mean ( 23 / 24 )[/C][C]1.25363888888889[/C][C]0.0124237156717998[/C][C]100.906920442045[/C][/ROW]
[ROW][C]Winsorized Mean ( 24 / 24 )[/C][C]1.25163888888889[/C][C]0.0121454298152565[/C][C]103.054309969058[/C][/ROW]
[ROW][C]Trimmed Mean ( 1 / 24 )[/C][C]1.25411428571429[/C][C]0.0197103512742126[/C][C]63.6271910260202[/C][/ROW]
[ROW][C]Trimmed Mean ( 2 / 24 )[/C][C]1.25373529411765[/C][C]0.0195359646468415[/C][C]64.1757556784043[/C][/ROW]
[ROW][C]Trimmed Mean ( 3 / 24 )[/C][C]1.25325757575758[/C][C]0.0193526867677599[/C][C]64.7588415395326[/C][/ROW]
[ROW][C]Trimmed Mean ( 4 / 24 )[/C][C]1.252953125[/C][C]0.0191880371245783[/C][C]65.2986606636834[/C][/ROW]
[ROW][C]Trimmed Mean ( 5 / 24 )[/C][C]1.25267741935484[/C][C]0.0189964617790657[/C][C]65.9426704785256[/C][/ROW]
[ROW][C]Trimmed Mean ( 6 / 24 )[/C][C]1.25241666666667[/C][C]0.0187689985355204[/C][C]66.7279431183537[/C][/ROW]
[ROW][C]Trimmed Mean ( 7 / 24 )[/C][C]1.25210344827586[/C][C]0.0185211850326107[/C][C]67.6038518092256[/C][/ROW]
[ROW][C]Trimmed Mean ( 8 / 24 )[/C][C]1.25205357142857[/C][C]0.0182919579881656[/C][C]68.4483078431852[/C][/ROW]
[ROW][C]Trimmed Mean ( 9 / 24 )[/C][C]1.25174074074074[/C][C]0.0180823719939849[/C][C]69.2243662035672[/C][/ROW]
[ROW][C]Trimmed Mean ( 10 / 24 )[/C][C]1.25132692307692[/C][C]0.0178969886568044[/C][C]69.9182944724711[/C][/ROW]
[ROW][C]Trimmed Mean ( 11 / 24 )[/C][C]1.2509[/C][C]0.0177189452397191[/C][C]70.5967529712752[/C][/ROW]
[ROW][C]Trimmed Mean ( 12 / 24 )[/C][C]1.250375[/C][C]0.0175194072985418[/C][C]71.3708505483559[/C][/ROW]
[ROW][C]Trimmed Mean ( 13 / 24 )[/C][C]1.25021739130435[/C][C]0.0173719445384459[/C][C]71.9676135586025[/C][/ROW]
[ROW][C]Trimmed Mean ( 14 / 24 )[/C][C]1.24995454545455[/C][C]0.0171903580128634[/C][C]72.7125371396695[/C][/ROW]
[ROW][C]Trimmed Mean ( 15 / 24 )[/C][C]1.24957142857143[/C][C]0.0170009954910122[/C][C]73.4998976519954[/C][/ROW]
[ROW][C]Trimmed Mean ( 16 / 24 )[/C][C]1.249175[/C][C]0.0168351695177776[/C][C]74.2003220508648[/C][/ROW]
[ROW][C]Trimmed Mean ( 17 / 24 )[/C][C]1.24884210526316[/C][C]0.0166106585567701[/C][C]75.1831783788101[/C][/ROW]
[ROW][C]Trimmed Mean ( 18 / 24 )[/C][C]1.24872222222222[/C][C]0.0163475453771784[/C][C]76.3859156473407[/C][/ROW]
[ROW][C]Trimmed Mean ( 19 / 24 )[/C][C]1.24852941176471[/C][C]0.0160395142247842[/C][C]77.8408494339238[/C][/ROW]
[ROW][C]Trimmed Mean ( 20 / 24 )[/C][C]1.2483125[/C][C]0.015612781512997[/C][C]79.9545230912782[/C][/ROW]
[ROW][C]Trimmed Mean ( 21 / 24 )[/C][C]1.24836666666667[/C][C]0.0151417428151097[/C][C]82.445375140102[/C][/ROW]
[ROW][C]Trimmed Mean ( 22 / 24 )[/C][C]1.24775[/C][C]0.0146527373429067[/C][C]85.1547373572509[/C][/ROW]
[ROW][C]Trimmed Mean ( 23 / 24 )[/C][C]1.24680769230769[/C][C]0.0141551859733749[/C][C]88.081336031393[/C][/ROW]
[ROW][C]Trimmed Mean ( 24 / 24 )[/C][C]1.24591666666667[/C][C]0.0135555642175469[/C][C]91.911826514303[/C][/ROW]
[ROW][C]Median[/C][C]1.2275[/C][C][/C][C][/C][/ROW]
[ROW][C]Midrange[/C][C]1.2715[/C][C][/C][C][/C][/ROW]
[ROW][C]Midmean - Weighted Average at Xnp[/C][C]1.23658974358974[/C][C][/C][C][/C][/ROW]
[ROW][C]Midmean - Weighted Average at X(n+1)p[/C][C]1.24872222222222[/C][C][/C][C][/C][/ROW]
[ROW][C]Midmean - Empirical Distribution Function[/C][C]1.23658974358974[/C][C][/C][C][/C][/ROW]
[ROW][C]Midmean - Empirical Distribution Function - Averaging[/C][C]1.24872222222222[/C][C][/C][C][/C][/ROW]
[ROW][C]Midmean - Empirical Distribution Function - Interpolation[/C][C]1.24872222222222[/C][C][/C][C][/C][/ROW]
[ROW][C]Midmean - Closest Observation[/C][C]1.23658974358974[/C][C][/C][C][/C][/ROW]
[ROW][C]Midmean - True Basic - Statistics Graphics Toolkit[/C][C]1.24872222222222[/C][C][/C][C][/C][/ROW]
[ROW][C]Midmean - MS Excel (old versions)[/C][C]1.24095[/C][C][/C][C][/C][/ROW]
[ROW][C]Number of observations[/C][C]72[/C][C][/C][C][/C][/ROW]
[/TABLE]
Source: https://freestatistics.org/blog/index.php?pk=233971&T=1

Globally Unique Identifier (entire table): ba.freestatistics.org/blog/index.php?pk=233971&T=1

As an alternative you can also use a QR Code:  

The GUIDs for individual cells are displayed in the table below:

Central Tendency - Ungrouped Data
MeasureValueS.E.Value/S.E.
Arithmetic Mean1.254597222222220.019900266390057163.0442426061726
Geometric Mean1.24338421407537
Harmonic Mean1.23225030496315
Quadratic Mean1.26575339335029
Winsorized Mean ( 1 / 24 )1.254472222222220.019849078180743963.2005280446333
Winsorized Mean ( 2 / 24 )1.254611111111110.01979414358659963.3829448403367
Winsorized Mean ( 3 / 24 )1.254069444444440.019647194609426963.8294407611117
Winsorized Mean ( 4 / 24 )1.253902777777780.019597207249317563.9837483895288
Winsorized Mean ( 5 / 24 )1.253763888888890.019547817590640364.1383051113186
Winsorized Mean ( 6 / 24 )1.253930555555560.019404044703524464.6221225891013
Winsorized Mean ( 7 / 24 )1.2523750.019068081195066865.6791308568589
Winsorized Mean ( 8 / 24 )1.253930555555560.018703804086858867.0414718702363
Winsorized Mean ( 9 / 24 )1.254430555555560.018302201762466368.5398714229076
Winsorized Mean ( 10 / 24 )1.254291666666670.017971715709193769.7925388406301
Winsorized Mean ( 11 / 24 )1.254750.017760334446617670.6490074143262
Winsorized Mean ( 12 / 24 )1.251583333333330.017159312317733772.939014696985
Winsorized Mean ( 13 / 24 )1.252305555555560.016998085583185773.6733292362241
Winsorized Mean ( 14 / 24 )1.253083333333330.016653219340340775.2457112180029
Winsorized Mean ( 15 / 24 )1.2528750.016132786452095677.6601738156184
Winsorized Mean ( 16 / 24 )1.251986111111110.016000653999930578.2459336422468
Winsorized Mean ( 17 / 24 )1.249861111111110.015689790465944479.6607904881843
Winsorized Mean ( 18 / 24 )1.250361111111110.015332890705434681.5476438939157
Winsorized Mean ( 19 / 24 )1.250361111111110.015182835955474382.3535942018976
Winsorized Mean ( 20 / 24 )1.247861111111110.014593008937219485.5108851422988
Winsorized Mean ( 21 / 24 )1.253402777777780.013828845073716690.6368370674727
Winsorized Mean ( 22 / 24 )1.255236111111110.012996229937495296.5846339398516
Winsorized Mean ( 23 / 24 )1.253638888888890.0124237156717998100.906920442045
Winsorized Mean ( 24 / 24 )1.251638888888890.0121454298152565103.054309969058
Trimmed Mean ( 1 / 24 )1.254114285714290.019710351274212663.6271910260202
Trimmed Mean ( 2 / 24 )1.253735294117650.019535964646841564.1757556784043
Trimmed Mean ( 3 / 24 )1.253257575757580.019352686767759964.7588415395326
Trimmed Mean ( 4 / 24 )1.2529531250.019188037124578365.2986606636834
Trimmed Mean ( 5 / 24 )1.252677419354840.018996461779065765.9426704785256
Trimmed Mean ( 6 / 24 )1.252416666666670.018768998535520466.7279431183537
Trimmed Mean ( 7 / 24 )1.252103448275860.018521185032610767.6038518092256
Trimmed Mean ( 8 / 24 )1.252053571428570.018291957988165668.4483078431852
Trimmed Mean ( 9 / 24 )1.251740740740740.018082371993984969.2243662035672
Trimmed Mean ( 10 / 24 )1.251326923076920.017896988656804469.9182944724711
Trimmed Mean ( 11 / 24 )1.25090.017718945239719170.5967529712752
Trimmed Mean ( 12 / 24 )1.2503750.017519407298541871.3708505483559
Trimmed Mean ( 13 / 24 )1.250217391304350.017371944538445971.9676135586025
Trimmed Mean ( 14 / 24 )1.249954545454550.017190358012863472.7125371396695
Trimmed Mean ( 15 / 24 )1.249571428571430.017000995491012273.4998976519954
Trimmed Mean ( 16 / 24 )1.2491750.016835169517777674.2003220508648
Trimmed Mean ( 17 / 24 )1.248842105263160.016610658556770175.1831783788101
Trimmed Mean ( 18 / 24 )1.248722222222220.016347545377178476.3859156473407
Trimmed Mean ( 19 / 24 )1.248529411764710.016039514224784277.8408494339238
Trimmed Mean ( 20 / 24 )1.24831250.01561278151299779.9545230912782
Trimmed Mean ( 21 / 24 )1.248366666666670.015141742815109782.445375140102
Trimmed Mean ( 22 / 24 )1.247750.014652737342906785.1547373572509
Trimmed Mean ( 23 / 24 )1.246807692307690.014155185973374988.081336031393
Trimmed Mean ( 24 / 24 )1.245916666666670.013555564217546991.911826514303
Median1.2275
Midrange1.2715
Midmean - Weighted Average at Xnp1.23658974358974
Midmean - Weighted Average at X(n+1)p1.24872222222222
Midmean - Empirical Distribution Function1.23658974358974
Midmean - Empirical Distribution Function - Averaging1.24872222222222
Midmean - Empirical Distribution Function - Interpolation1.24872222222222
Midmean - Closest Observation1.23658974358974
Midmean - True Basic - Statistics Graphics Toolkit1.24872222222222
Midmean - MS Excel (old versions)1.24095
Number of observations72


Parameters (Session):
Parameters (R input):
R code (references can be found in the software module):
geomean <- function(x) {
return(exp(mean(log(x))))
}
harmean <- function(x) {
return(1/mean(1/x))
}
quamean <- function(x) {
return(sqrt(mean(x*x)))
}
winmean <- function(x) {
x <-sort(x[!is.na(x)])
n<-length(x)
denom <- 3
nodenom <- n/denom
if (nodenom>40) denom <- n/40
sqrtn = sqrt(n)
roundnodenom = floor(nodenom)
win <- array(NA,dim=c(roundnodenom,2))
for (j in 1:roundnodenom) {
win[j,1] <- (j*x[j+1]+sum(x[(j+1):(n-j)])+j*x[n-j])/n
win[j,2] <- sd(c(rep(x[j+1],j),x[(j+1):(n-j)],rep(x[n-j],j)))/sqrtn
}
return(win)
}
trimean <- function(x) {
x <-sort(x[!is.na(x)])
n<-length(x)
denom <- 3
nodenom <- n/denom
if (nodenom>40) denom <- n/40
sqrtn = sqrt(n)
roundnodenom = floor(nodenom)
tri <- array(NA,dim=c(roundnodenom,2))
for (j in 1:roundnodenom) {
tri[j,1] <- mean(x,trim=j/n)
tri[j,2] <- sd(x[(j+1):(n-j)]) / sqrt(n-j*2)
}
return(tri)
}
midrange <- function(x) {
return((max(x)+min(x))/2)
}
q1 <- function(data,n,p,i,f) {
np <- n*p;
i <<- floor(np)
f <<- np - i
qvalue <- (1-f)*data[i] + f*data[i+1]
}
q2 <- function(data,n,p,i,f) {
np <- (n+1)*p
i <<- floor(np)
f <<- np - i
qvalue <- (1-f)*data[i] + f*data[i+1]
}
q3 <- function(data,n,p,i,f) {
np <- n*p
i <<- floor(np)
f <<- np - i
if (f==0) {
qvalue <- data[i]
} else {
qvalue <- data[i+1]
}
}
q4 <- function(data,n,p,i,f) {
np <- n*p
i <<- floor(np)
f <<- np - i
if (f==0) {
qvalue <- (data[i]+data[i+1])/2
} else {
qvalue <- data[i+1]
}
}
q5 <- function(data,n,p,i,f) {
np <- (n-1)*p
i <<- floor(np)
f <<- np - i
if (f==0) {
qvalue <- data[i+1]
} else {
qvalue <- data[i+1] + f*(data[i+2]-data[i+1])
}
}
q6 <- function(data,n,p,i,f) {
np <- n*p+0.5
i <<- floor(np)
f <<- np - i
qvalue <- data[i]
}
q7 <- function(data,n,p,i,f) {
np <- (n+1)*p
i <<- floor(np)
f <<- np - i
if (f==0) {
qvalue <- data[i]
} else {
qvalue <- f*data[i] + (1-f)*data[i+1]
}
}
q8 <- function(data,n,p,i,f) {
np <- (n+1)*p
i <<- floor(np)
f <<- np - i
if (f==0) {
qvalue <- data[i]
} else {
if (f == 0.5) {
qvalue <- (data[i]+data[i+1])/2
} else {
if (f < 0.5) {
qvalue <- data[i]
} else {
qvalue <- data[i+1]
}
}
}
}
midmean <- function(x,def) {
x <-sort(x[!is.na(x)])
n<-length(x)
if (def==1) {
qvalue1 <- q1(x,n,0.25,i,f)
qvalue3 <- q1(x,n,0.75,i,f)
}
if (def==2) {
qvalue1 <- q2(x,n,0.25,i,f)
qvalue3 <- q2(x,n,0.75,i,f)
}
if (def==3) {
qvalue1 <- q3(x,n,0.25,i,f)
qvalue3 <- q3(x,n,0.75,i,f)
}
if (def==4) {
qvalue1 <- q4(x,n,0.25,i,f)
qvalue3 <- q4(x,n,0.75,i,f)
}
if (def==5) {
qvalue1 <- q5(x,n,0.25,i,f)
qvalue3 <- q5(x,n,0.75,i,f)
}
if (def==6) {
qvalue1 <- q6(x,n,0.25,i,f)
qvalue3 <- q6(x,n,0.75,i,f)
}
if (def==7) {
qvalue1 <- q7(x,n,0.25,i,f)
qvalue3 <- q7(x,n,0.75,i,f)
}
if (def==8) {
qvalue1 <- q8(x,n,0.25,i,f)
qvalue3 <- q8(x,n,0.75,i,f)
}
midm <- 0
myn <- 0
roundno4 <- round(n/4)
round3no4 <- round(3*n/4)
for (i in 1:n) {
if ((x[i]>=qvalue1) & (x[i]<=qvalue3)){
midm = midm + x[i]
myn = myn + 1
}
}
midm = midm / myn
return(midm)
}
(arm <- mean(x))
sqrtn <- sqrt(length(x))
(armse <- sd(x) / sqrtn)
(armose <- arm / armse)
(geo <- geomean(x))
(har <- harmean(x))
(qua <- quamean(x))
(win <- winmean(x))
(tri <- trimean(x))
(midr <- midrange(x))
midm <- array(NA,dim=8)
for (j in 1:8) midm[j] <- midmean(x,j)
midm
bitmap(file='test1.png')
lb <- win[,1] - 2*win[,2]
ub <- win[,1] + 2*win[,2]
if ((ylimmin == '') | (ylimmax == '')) plot(win[,1],type='b',main=main, xlab='j', pch=19, ylab='Winsorized Mean(j/n)', ylim=c(min(lb),max(ub))) else plot(win[,1],type='l',main=main, xlab='j', pch=19, ylab='Winsorized Mean(j/n)', ylim=c(ylimmin,ylimmax))
lines(ub,lty=3)
lines(lb,lty=3)
grid()
dev.off()
bitmap(file='test2.png')
lb <- tri[,1] - 2*tri[,2]
ub <- tri[,1] + 2*tri[,2]
if ((ylimmin == '') | (ylimmax == '')) plot(tri[,1],type='b',main=main, xlab='j', pch=19, ylab='Trimmed Mean(j/n)', ylim=c(min(lb),max(ub))) else plot(tri[,1],type='l',main=main, xlab='j', pch=19, ylab='Trimmed Mean(j/n)', ylim=c(ylimmin,ylimmax))
lines(ub,lty=3)
lines(lb,lty=3)
grid()
dev.off()
load(file='createtable')
a<-table.start()
a<-table.row.start(a)
a<-table.element(a,'Central Tendency - Ungrouped Data',4,TRUE)
a<-table.row.end(a)
a<-table.row.start(a)
a<-table.element(a,'Measure',header=TRUE)
a<-table.element(a,'Value',header=TRUE)
a<-table.element(a,'S.E.',header=TRUE)
a<-table.element(a,'Value/S.E.',header=TRUE)
a<-table.row.end(a)
a<-table.row.start(a)
a<-table.element(a,hyperlink('arithmetic_mean.htm', 'Arithmetic Mean', 'click to view the definition of the Arithmetic Mean'),header=TRUE)
a<-table.element(a,arm)
a<-table.element(a,hyperlink('arithmetic_mean_standard_error.htm', armse, 'click to view the definition of the Standard Error of the Arithmetic Mean'))
a<-table.element(a,armose)
a<-table.row.end(a)
a<-table.row.start(a)
a<-table.element(a,hyperlink('geometric_mean.htm', 'Geometric Mean', 'click to view the definition of the Geometric Mean'),header=TRUE)
a<-table.element(a,geo)
a<-table.element(a,'')
a<-table.row.end(a)
a<-table.row.start(a)
a<-table.element(a,hyperlink('harmonic_mean.htm', 'Harmonic Mean', 'click to view the definition of the Harmonic Mean'),header=TRUE)
a<-table.element(a,har)
a<-table.element(a,'')
a<-table.row.end(a)
a<-table.row.start(a)
a<-table.element(a,hyperlink('quadratic_mean.htm', 'Quadratic Mean', 'click to view the definition of the Quadratic Mean'),header=TRUE)
a<-table.element(a,qua)
a<-table.element(a,'')
a<-table.row.end(a)
for (j in 1:length(win[,1])) {
a<-table.row.start(a)
mylabel <- paste('Winsorized Mean (',j)
mylabel <- paste(mylabel,'/')
mylabel <- paste(mylabel,length(win[,1]))
mylabel <- paste(mylabel,')')
a<-table.element(a,hyperlink('winsorized_mean.htm', mylabel, 'click to view the definition of the Winsorized Mean'),header=TRUE)
a<-table.element(a,win[j,1])
a<-table.element(a,win[j,2])
a<-table.element(a,win[j,1]/win[j,2])
a<-table.row.end(a)
}
for (j in 1:length(tri[,1])) {
a<-table.row.start(a)
mylabel <- paste('Trimmed Mean (',j)
mylabel <- paste(mylabel,'/')
mylabel <- paste(mylabel,length(tri[,1]))
mylabel <- paste(mylabel,')')
a<-table.element(a,hyperlink('arithmetic_mean.htm', mylabel, 'click to view the definition of the Trimmed Mean'),header=TRUE)
a<-table.element(a,tri[j,1])
a<-table.element(a,tri[j,2])
a<-table.element(a,tri[j,1]/tri[j,2])
a<-table.row.end(a)
}
a<-table.row.start(a)
a<-table.element(a,hyperlink('median_1.htm', 'Median', 'click to view the definition of the Median'),header=TRUE)
a<-table.element(a,median(x))
a<-table.element(a,'')
a<-table.row.end(a)
a<-table.row.start(a)
a<-table.element(a,hyperlink('midrange.htm', 'Midrange', 'click to view the definition of the Midrange'),header=TRUE)
a<-table.element(a,midr)
a<-table.element(a,'')
a<-table.row.end(a)
a<-table.row.start(a)
mymid <- hyperlink('midmean.htm', 'Midmean', 'click to view the definition of the Midmean')
mylabel <- paste(mymid,hyperlink('method_1.htm','Weighted Average at Xnp',''),sep=' - ')
a<-table.element(a,mylabel,header=TRUE)
a<-table.element(a,midm[1])
a<-table.element(a,'')
a<-table.row.end(a)
a<-table.row.start(a)
mymid <- hyperlink('midmean.htm', 'Midmean', 'click to view the definition of the Midmean')
mylabel <- paste(mymid,hyperlink('method_2.htm','Weighted Average at X(n+1)p',''),sep=' - ')
a<-table.element(a,mylabel,header=TRUE)
a<-table.element(a,midm[2])
a<-table.element(a,'')
a<-table.row.end(a)
a<-table.row.start(a)
mymid <- hyperlink('midmean.htm', 'Midmean', 'click to view the definition of the Midmean')
mylabel <- paste(mymid,hyperlink('method_3.htm','Empirical Distribution Function',''),sep=' - ')
a<-table.element(a,mylabel,header=TRUE)
a<-table.element(a,midm[3])
a<-table.element(a,'')
a<-table.row.end(a)
a<-table.row.start(a)
mymid <- hyperlink('midmean.htm', 'Midmean', 'click to view the definition of the Midmean')
mylabel <- paste(mymid,hyperlink('method_4.htm','Empirical Distribution Function - Averaging',''),sep=' - ')
a<-table.element(a,mylabel,header=TRUE)
a<-table.element(a,midm[4])
a<-table.element(a,'')
a<-table.row.end(a)
a<-table.row.start(a)
mymid <- hyperlink('midmean.htm', 'Midmean', 'click to view the definition of the Midmean')
mylabel <- paste(mymid,hyperlink('method_5.htm','Empirical Distribution Function - Interpolation',''),sep=' - ')
a<-table.element(a,mylabel,header=TRUE)
a<-table.element(a,midm[5])
a<-table.element(a,'')
a<-table.row.end(a)
a<-table.row.start(a)
mymid <- hyperlink('midmean.htm', 'Midmean', 'click to view the definition of the Midmean')
mylabel <- paste(mymid,hyperlink('method_6.htm','Closest Observation',''),sep=' - ')
a<-table.element(a,mylabel,header=TRUE)
a<-table.element(a,midm[6])
a<-table.element(a,'')
a<-table.row.end(a)
a<-table.row.start(a)
mymid <- hyperlink('midmean.htm', 'Midmean', 'click to view the definition of the Midmean')
mylabel <- paste(mymid,hyperlink('method_7.htm','True Basic - Statistics Graphics Toolkit',''),sep=' - ')
a<-table.element(a,mylabel,header=TRUE)
a<-table.element(a,midm[7])
a<-table.element(a,'')
a<-table.row.end(a)
a<-table.row.start(a)
mymid <- hyperlink('midmean.htm', 'Midmean', 'click to view the definition of the Midmean')
mylabel <- paste(mymid,hyperlink('method_8.htm','MS Excel (old versions)',''),sep=' - ')
a<-table.element(a,mylabel,header=TRUE)
a<-table.element(a,midm[8])
a<-table.element(a,'')
a<-table.row.end(a)
a<-table.row.start(a)
a<-table.element(a,'Number of observations',header=TRUE)
a<-table.element(a,length(x))
a<-table.element(a,'')
a<-table.row.end(a)
a<-table.end(a)
table.save(a,file='mytable.tab')