Free Statistics

of Irreproducible Research!

Author's title

Author*Unverified author*
R Software Modulerwasp_centraltendency.wasp
Title produced by softwareCentral Tendency
Date of computationMon, 24 Feb 2014 16:51:42 -0500
Cite this page as followsStatistical Computations at FreeStatistics.org, Office for Research Development and Education, URL https://freestatistics.org/blog/index.php?v=date/2014/Feb/24/t1393278721qsyvrkuuzqpi87a.htm/, Retrieved Thu, 16 May 2024 04:54:19 +0000
Statistical Computations at FreeStatistics.org, Office for Research Development and Education, URL https://freestatistics.org/blog/index.php?pk=234033, Retrieved Thu, 16 May 2024 04:54:19 +0000
QR Codes:

Original text written by user:
IsPrivate?No (this computation is public)
User-defined keywords
Estimated Impact84
Family? (F = Feedback message, R = changed R code, M = changed R Module, P = changed Parameters, D = changed Data)
-       [Central Tendency] [] [2014-02-24 21:51:42] [a051cf513b3103c0fd2487dcb9eab576] [Current]
Feedback Forum

Post a new message
Dataseries X:
1516
1289
1428
1335
1402
1475
1582
1317
1450
1497
1556
981
1807
1573
1756
1708
1737
1679
1872
1598
1747
1882
1369
865
1432
1172
1268
1120
1235
1272
1360
1069
1434
1552
1584
1070
1676
1690
1643
1446
1566
1352
1805
1613
1824
1866
1774
1505
1972
1856
2037
1888
2167
2191
2036
2103
2131
2039
1983
1629
2032
2216
2141
2073
2145
2429
2157
1994
2116
2287
2162
1699


Summary of computational transaction
Raw Inputview raw input (R code)
Raw Outputview raw output of R engine
Computing time2 seconds
R Server'Gertrude Mary Cox' @ cox.wessa.net

\begin{tabular}{lllllllll}
\hline
Summary of computational transaction \tabularnewline
Raw Input & view raw input (R code)  \tabularnewline
Raw Output & view raw output of R engine  \tabularnewline
Computing time & 2 seconds \tabularnewline
R Server & 'Gertrude Mary Cox' @ cox.wessa.net \tabularnewline
\hline
\end{tabular}
%Source: https://freestatistics.org/blog/index.php?pk=234033&T=0

[TABLE]
[ROW][C]Summary of computational transaction[/C][/ROW]
[ROW][C]Raw Input[/C][C]view raw input (R code) [/C][/ROW]
[ROW][C]Raw Output[/C][C]view raw output of R engine [/C][/ROW]
[ROW][C]Computing time[/C][C]2 seconds[/C][/ROW]
[ROW][C]R Server[/C][C]'Gertrude Mary Cox' @ cox.wessa.net[/C][/ROW]
[/TABLE]
Source: https://freestatistics.org/blog/index.php?pk=234033&T=0

Globally Unique Identifier (entire table): ba.freestatistics.org/blog/index.php?pk=234033&T=0

As an alternative you can also use a QR Code:  

The GUIDs for individual cells are displayed in the table below:

Summary of computational transaction
Raw Inputview raw input (R code)
Raw Outputview raw output of R engine
Computing time2 seconds
R Server'Gertrude Mary Cox' @ cox.wessa.net


Central Tendency - Ungrouped Data
MeasureValueS.E.Value/S.E.
Arithmetic Mean1683.7777777777841.213399479344840.8551053552776
Geometric Mean1645.90112840098
Harmonic Mean1605.75211867522
Quadratic Mean1719.21617314403
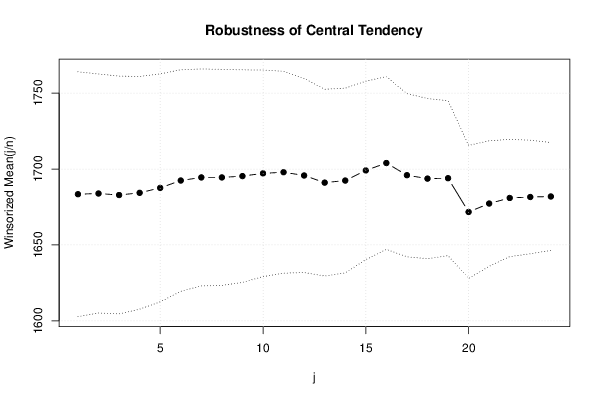
Winsorized Mean ( 1 / 24 )1683.4166666666740.330620859010341.7404104080528
Winsorized Mean ( 2 / 24 )1683.8888888888939.365704211378342.7755306966457
Winsorized Mean ( 3 / 24 )1682.8888888888939.162184118455942.9722939813205
Winsorized Mean ( 4 / 24 )1684.3333333333338.327709324122543.9455778348135
Winsorized Mean ( 5 / 24 )1687.5972222222237.54206644059444.9521665221239
Winsorized Mean ( 6 / 24 )1692.4305555555636.495850656966846.3732321644758
Winsorized Mean ( 7 / 24 )1694.4722222222235.734698686679747.4181197686675
Winsorized Mean ( 8 / 24 )1694.4722222222235.581443376611347.6223576510684
Winsorized Mean ( 9 / 24 )1695.3472222222235.010020696753448.4246278203269
Winsorized Mean ( 10 / 24 )1697.1527777777834.022774176213649.8828452079699
Winsorized Mean ( 11 / 24 )1697.9166666666733.252370866324951.0615220037188
Winsorized Mean ( 12 / 24 )1695.7531.975396143424953.0329629817173
Winsorized Mean ( 13 / 24 )1691.0555555555630.757029610437254.9811076353649
Winsorized Mean ( 14 / 24 )1692.4166666666730.431403594414455.614150737934
Winsorized Mean ( 15 / 24 )1699.0833333333329.393655631663157.8044240098896
Winsorized Mean ( 16 / 24 )1703.9722222222228.443427173649759.9074159319591
Winsorized Mean ( 17 / 24 )1695.9444444444426.883616381892163.0846840080182
Winsorized Mean ( 18 / 24 )1693.6944444444426.387332752075164.1858902662775
Winsorized Mean ( 19 / 24 )1693.9583333333325.5039997898766.4193203924884
Winsorized Mean ( 20 / 24 )1671.7361111111121.923861642811976.2519002513052
Winsorized Mean ( 21 / 24 )1677.2777777777820.657523176320381.1945247966821
Winsorized Mean ( 22 / 24 )1680.9444444444419.31666037672987.0204482380139
Winsorized Mean ( 23 / 24 )1681.5833333333318.708838491878189.8817601137207
Winsorized Mean ( 24 / 24 )1681.9166666666717.762371980466494.6898684768173
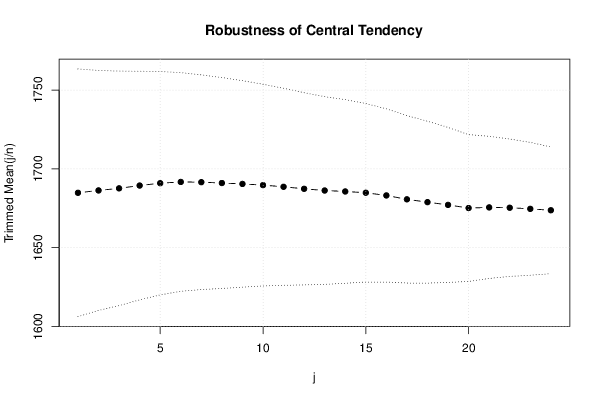
Trimmed Mean ( 1 / 24 )1684.8285714285739.292732518226542.8788853166942
Trimmed Mean ( 2 / 24 )1686.3235294117638.058082783221444.3092086119275
Trimmed Mean ( 3 / 24 )1687.6515151515237.201740017607345.3648542878039
Trimmed Mean ( 4 / 24 )1689.437536.263242484040946.5881532999567
Trimmed Mean ( 5 / 24 )1690.9193548387135.438294428448547.7144676997012
Trimmed Mean ( 6 / 24 )1691.7166666666734.683712874989748.775535444089
Trimmed Mean ( 7 / 24 )1691.5689655172434.051836859531549.6762912525159
Trimmed Mean ( 8 / 24 )1691.0357142857133.460443444613950.5383533569971
Trimmed Mean ( 9 / 24 )1690.4629629629632.753315460101251.6119647497127
Trimmed Mean ( 10 / 24 )1689.7115384615431.996303714436652.8095855553198
Trimmed Mean ( 11 / 24 )1688.6431.261422532820154.0167357460195
Trimmed Mean ( 12 / 24 )1687.37530.491651354181655.3389181976395
Trimmed Mean ( 13 / 24 )1686.2826086956529.78390226042356.6172489404248
Trimmed Mean ( 14 / 24 )1685.6818181818229.129109927463557.8693211834985
Trimmed Mean ( 15 / 24 )1684.8571428571428.32562383522359.481731193578
Trimmed Mean ( 16 / 24 )1683.1527.481988273907361.245568669355
Trimmed Mean ( 17 / 24 )1680.6842105263226.551115662177863.2999468613841
Trimmed Mean ( 18 / 24 )1678.8888888888925.681961360647865.3723002426689
Trimmed Mean ( 19 / 24 )1677.1470588235324.590990493742968.201687900708
Trimmed Mean ( 20 / 24 )1675.1562523.288128178591371.9317687172455
Trimmed Mean ( 21 / 24 )1675.5666666666722.539757126930174.3382751300691
Trimmed Mean ( 22 / 24 )1675.3571428571421.796085656883676.8650467442091
Trimmed Mean ( 23 / 24 )1674.6538461538521.073493544676379.4673100880753
Trimmed Mean ( 24 / 24 )1673.7520.110406311882183.2280548708297
Median1677.5
Midrange1647
Midmean - Weighted Average at Xnp1672.21621621622
Midmean - Weighted Average at X(n+1)p1678.88888888889
Midmean - Empirical Distribution Function1672.21621621622
Midmean - Empirical Distribution Function - Averaging1678.88888888889
Midmean - Empirical Distribution Function - Interpolation1678.88888888889
Midmean - Closest Observation1672.21621621622
Midmean - True Basic - Statistics Graphics Toolkit1678.88888888889
Midmean - MS Excel (old versions)1680.68421052632
Number of observations72

\begin{tabular}{lllllllll}
\hline
Central Tendency - Ungrouped Data \tabularnewline
Measure & Value & S.E. & Value/S.E. \tabularnewline
Arithmetic Mean & 1683.77777777778 & 41.2133994793448 & 40.8551053552776 \tabularnewline
Geometric Mean & 1645.90112840098 &  &  \tabularnewline
Harmonic Mean & 1605.75211867522 &  &  \tabularnewline
Quadratic Mean & 1719.21617314403 &  &  \tabularnewline
Winsorized Mean ( 1 / 24 ) & 1683.41666666667 & 40.3306208590103 & 41.7404104080528 \tabularnewline
Winsorized Mean ( 2 / 24 ) & 1683.88888888889 & 39.3657042113783 & 42.7755306966457 \tabularnewline
Winsorized Mean ( 3 / 24 ) & 1682.88888888889 & 39.1621841184559 & 42.9722939813205 \tabularnewline
Winsorized Mean ( 4 / 24 ) & 1684.33333333333 & 38.3277093241225 & 43.9455778348135 \tabularnewline
Winsorized Mean ( 5 / 24 ) & 1687.59722222222 & 37.542066440594 & 44.9521665221239 \tabularnewline
Winsorized Mean ( 6 / 24 ) & 1692.43055555556 & 36.4958506569668 & 46.3732321644758 \tabularnewline
Winsorized Mean ( 7 / 24 ) & 1694.47222222222 & 35.7346986866797 & 47.4181197686675 \tabularnewline
Winsorized Mean ( 8 / 24 ) & 1694.47222222222 & 35.5814433766113 & 47.6223576510684 \tabularnewline
Winsorized Mean ( 9 / 24 ) & 1695.34722222222 & 35.0100206967534 & 48.4246278203269 \tabularnewline
Winsorized Mean ( 10 / 24 ) & 1697.15277777778 & 34.0227741762136 & 49.8828452079699 \tabularnewline
Winsorized Mean ( 11 / 24 ) & 1697.91666666667 & 33.2523708663249 & 51.0615220037188 \tabularnewline
Winsorized Mean ( 12 / 24 ) & 1695.75 & 31.9753961434249 & 53.0329629817173 \tabularnewline
Winsorized Mean ( 13 / 24 ) & 1691.05555555556 & 30.7570296104372 & 54.9811076353649 \tabularnewline
Winsorized Mean ( 14 / 24 ) & 1692.41666666667 & 30.4314035944144 & 55.614150737934 \tabularnewline
Winsorized Mean ( 15 / 24 ) & 1699.08333333333 & 29.3936556316631 & 57.8044240098896 \tabularnewline
Winsorized Mean ( 16 / 24 ) & 1703.97222222222 & 28.4434271736497 & 59.9074159319591 \tabularnewline
Winsorized Mean ( 17 / 24 ) & 1695.94444444444 & 26.8836163818921 & 63.0846840080182 \tabularnewline
Winsorized Mean ( 18 / 24 ) & 1693.69444444444 & 26.3873327520751 & 64.1858902662775 \tabularnewline
Winsorized Mean ( 19 / 24 ) & 1693.95833333333 & 25.50399978987 & 66.4193203924884 \tabularnewline
Winsorized Mean ( 20 / 24 ) & 1671.73611111111 & 21.9238616428119 & 76.2519002513052 \tabularnewline
Winsorized Mean ( 21 / 24 ) & 1677.27777777778 & 20.6575231763203 & 81.1945247966821 \tabularnewline
Winsorized Mean ( 22 / 24 ) & 1680.94444444444 & 19.316660376729 & 87.0204482380139 \tabularnewline
Winsorized Mean ( 23 / 24 ) & 1681.58333333333 & 18.7088384918781 & 89.8817601137207 \tabularnewline
Winsorized Mean ( 24 / 24 ) & 1681.91666666667 & 17.7623719804664 & 94.6898684768173 \tabularnewline
Trimmed Mean ( 1 / 24 ) & 1684.82857142857 & 39.2927325182265 & 42.8788853166942 \tabularnewline
Trimmed Mean ( 2 / 24 ) & 1686.32352941176 & 38.0580827832214 & 44.3092086119275 \tabularnewline
Trimmed Mean ( 3 / 24 ) & 1687.65151515152 & 37.2017400176073 & 45.3648542878039 \tabularnewline
Trimmed Mean ( 4 / 24 ) & 1689.4375 & 36.2632424840409 & 46.5881532999567 \tabularnewline
Trimmed Mean ( 5 / 24 ) & 1690.91935483871 & 35.4382944284485 & 47.7144676997012 \tabularnewline
Trimmed Mean ( 6 / 24 ) & 1691.71666666667 & 34.6837128749897 & 48.775535444089 \tabularnewline
Trimmed Mean ( 7 / 24 ) & 1691.56896551724 & 34.0518368595315 & 49.6762912525159 \tabularnewline
Trimmed Mean ( 8 / 24 ) & 1691.03571428571 & 33.4604434446139 & 50.5383533569971 \tabularnewline
Trimmed Mean ( 9 / 24 ) & 1690.46296296296 & 32.7533154601012 & 51.6119647497127 \tabularnewline
Trimmed Mean ( 10 / 24 ) & 1689.71153846154 & 31.9963037144366 & 52.8095855553198 \tabularnewline
Trimmed Mean ( 11 / 24 ) & 1688.64 & 31.2614225328201 & 54.0167357460195 \tabularnewline
Trimmed Mean ( 12 / 24 ) & 1687.375 & 30.4916513541816 & 55.3389181976395 \tabularnewline
Trimmed Mean ( 13 / 24 ) & 1686.28260869565 & 29.783902260423 & 56.6172489404248 \tabularnewline
Trimmed Mean ( 14 / 24 ) & 1685.68181818182 & 29.1291099274635 & 57.8693211834985 \tabularnewline
Trimmed Mean ( 15 / 24 ) & 1684.85714285714 & 28.325623835223 & 59.481731193578 \tabularnewline
Trimmed Mean ( 16 / 24 ) & 1683.15 & 27.4819882739073 & 61.245568669355 \tabularnewline
Trimmed Mean ( 17 / 24 ) & 1680.68421052632 & 26.5511156621778 & 63.2999468613841 \tabularnewline
Trimmed Mean ( 18 / 24 ) & 1678.88888888889 & 25.6819613606478 & 65.3723002426689 \tabularnewline
Trimmed Mean ( 19 / 24 ) & 1677.14705882353 & 24.5909904937429 & 68.201687900708 \tabularnewline
Trimmed Mean ( 20 / 24 ) & 1675.15625 & 23.2881281785913 & 71.9317687172455 \tabularnewline
Trimmed Mean ( 21 / 24 ) & 1675.56666666667 & 22.5397571269301 & 74.3382751300691 \tabularnewline
Trimmed Mean ( 22 / 24 ) & 1675.35714285714 & 21.7960856568836 & 76.8650467442091 \tabularnewline
Trimmed Mean ( 23 / 24 ) & 1674.65384615385 & 21.0734935446763 & 79.4673100880753 \tabularnewline
Trimmed Mean ( 24 / 24 ) & 1673.75 & 20.1104063118821 & 83.2280548708297 \tabularnewline
Median & 1677.5 &  &  \tabularnewline
Midrange & 1647 &  &  \tabularnewline
Midmean - Weighted Average at Xnp & 1672.21621621622 &  &  \tabularnewline
Midmean - Weighted Average at X(n+1)p & 1678.88888888889 &  &  \tabularnewline
Midmean - Empirical Distribution Function & 1672.21621621622 &  &  \tabularnewline
Midmean - Empirical Distribution Function - Averaging & 1678.88888888889 &  &  \tabularnewline
Midmean - Empirical Distribution Function - Interpolation & 1678.88888888889 &  &  \tabularnewline
Midmean - Closest Observation & 1672.21621621622 &  &  \tabularnewline
Midmean - True Basic - Statistics Graphics Toolkit & 1678.88888888889 &  &  \tabularnewline
Midmean - MS Excel (old versions) & 1680.68421052632 &  &  \tabularnewline
Number of observations & 72 &  &  \tabularnewline
\hline
\end{tabular}
%Source: https://freestatistics.org/blog/index.php?pk=234033&T=1

[TABLE]
[ROW][C]Central Tendency - Ungrouped Data[/C][/ROW]
[ROW][C]Measure[/C][C]Value[/C][C]S.E.[/C][C]Value/S.E.[/C][/ROW]
[ROW][C]Arithmetic Mean[/C][C]1683.77777777778[/C][C]41.2133994793448[/C][C]40.8551053552776[/C][/ROW]
[ROW][C]Geometric Mean[/C][C]1645.90112840098[/C][C][/C][C][/C][/ROW]
[ROW][C]Harmonic Mean[/C][C]1605.75211867522[/C][C][/C][C][/C][/ROW]
[ROW][C]Quadratic Mean[/C][C]1719.21617314403[/C][C][/C][C][/C][/ROW]
[ROW][C]Winsorized Mean ( 1 / 24 )[/C][C]1683.41666666667[/C][C]40.3306208590103[/C][C]41.7404104080528[/C][/ROW]
[ROW][C]Winsorized Mean ( 2 / 24 )[/C][C]1683.88888888889[/C][C]39.3657042113783[/C][C]42.7755306966457[/C][/ROW]
[ROW][C]Winsorized Mean ( 3 / 24 )[/C][C]1682.88888888889[/C][C]39.1621841184559[/C][C]42.9722939813205[/C][/ROW]
[ROW][C]Winsorized Mean ( 4 / 24 )[/C][C]1684.33333333333[/C][C]38.3277093241225[/C][C]43.9455778348135[/C][/ROW]
[ROW][C]Winsorized Mean ( 5 / 24 )[/C][C]1687.59722222222[/C][C]37.542066440594[/C][C]44.9521665221239[/C][/ROW]
[ROW][C]Winsorized Mean ( 6 / 24 )[/C][C]1692.43055555556[/C][C]36.4958506569668[/C][C]46.3732321644758[/C][/ROW]
[ROW][C]Winsorized Mean ( 7 / 24 )[/C][C]1694.47222222222[/C][C]35.7346986866797[/C][C]47.4181197686675[/C][/ROW]
[ROW][C]Winsorized Mean ( 8 / 24 )[/C][C]1694.47222222222[/C][C]35.5814433766113[/C][C]47.6223576510684[/C][/ROW]
[ROW][C]Winsorized Mean ( 9 / 24 )[/C][C]1695.34722222222[/C][C]35.0100206967534[/C][C]48.4246278203269[/C][/ROW]
[ROW][C]Winsorized Mean ( 10 / 24 )[/C][C]1697.15277777778[/C][C]34.0227741762136[/C][C]49.8828452079699[/C][/ROW]
[ROW][C]Winsorized Mean ( 11 / 24 )[/C][C]1697.91666666667[/C][C]33.2523708663249[/C][C]51.0615220037188[/C][/ROW]
[ROW][C]Winsorized Mean ( 12 / 24 )[/C][C]1695.75[/C][C]31.9753961434249[/C][C]53.0329629817173[/C][/ROW]
[ROW][C]Winsorized Mean ( 13 / 24 )[/C][C]1691.05555555556[/C][C]30.7570296104372[/C][C]54.9811076353649[/C][/ROW]
[ROW][C]Winsorized Mean ( 14 / 24 )[/C][C]1692.41666666667[/C][C]30.4314035944144[/C][C]55.614150737934[/C][/ROW]
[ROW][C]Winsorized Mean ( 15 / 24 )[/C][C]1699.08333333333[/C][C]29.3936556316631[/C][C]57.8044240098896[/C][/ROW]
[ROW][C]Winsorized Mean ( 16 / 24 )[/C][C]1703.97222222222[/C][C]28.4434271736497[/C][C]59.9074159319591[/C][/ROW]
[ROW][C]Winsorized Mean ( 17 / 24 )[/C][C]1695.94444444444[/C][C]26.8836163818921[/C][C]63.0846840080182[/C][/ROW]
[ROW][C]Winsorized Mean ( 18 / 24 )[/C][C]1693.69444444444[/C][C]26.3873327520751[/C][C]64.1858902662775[/C][/ROW]
[ROW][C]Winsorized Mean ( 19 / 24 )[/C][C]1693.95833333333[/C][C]25.50399978987[/C][C]66.4193203924884[/C][/ROW]
[ROW][C]Winsorized Mean ( 20 / 24 )[/C][C]1671.73611111111[/C][C]21.9238616428119[/C][C]76.2519002513052[/C][/ROW]
[ROW][C]Winsorized Mean ( 21 / 24 )[/C][C]1677.27777777778[/C][C]20.6575231763203[/C][C]81.1945247966821[/C][/ROW]
[ROW][C]Winsorized Mean ( 22 / 24 )[/C][C]1680.94444444444[/C][C]19.316660376729[/C][C]87.0204482380139[/C][/ROW]
[ROW][C]Winsorized Mean ( 23 / 24 )[/C][C]1681.58333333333[/C][C]18.7088384918781[/C][C]89.8817601137207[/C][/ROW]
[ROW][C]Winsorized Mean ( 24 / 24 )[/C][C]1681.91666666667[/C][C]17.7623719804664[/C][C]94.6898684768173[/C][/ROW]
[ROW][C]Trimmed Mean ( 1 / 24 )[/C][C]1684.82857142857[/C][C]39.2927325182265[/C][C]42.8788853166942[/C][/ROW]
[ROW][C]Trimmed Mean ( 2 / 24 )[/C][C]1686.32352941176[/C][C]38.0580827832214[/C][C]44.3092086119275[/C][/ROW]
[ROW][C]Trimmed Mean ( 3 / 24 )[/C][C]1687.65151515152[/C][C]37.2017400176073[/C][C]45.3648542878039[/C][/ROW]
[ROW][C]Trimmed Mean ( 4 / 24 )[/C][C]1689.4375[/C][C]36.2632424840409[/C][C]46.5881532999567[/C][/ROW]
[ROW][C]Trimmed Mean ( 5 / 24 )[/C][C]1690.91935483871[/C][C]35.4382944284485[/C][C]47.7144676997012[/C][/ROW]
[ROW][C]Trimmed Mean ( 6 / 24 )[/C][C]1691.71666666667[/C][C]34.6837128749897[/C][C]48.775535444089[/C][/ROW]
[ROW][C]Trimmed Mean ( 7 / 24 )[/C][C]1691.56896551724[/C][C]34.0518368595315[/C][C]49.6762912525159[/C][/ROW]
[ROW][C]Trimmed Mean ( 8 / 24 )[/C][C]1691.03571428571[/C][C]33.4604434446139[/C][C]50.5383533569971[/C][/ROW]
[ROW][C]Trimmed Mean ( 9 / 24 )[/C][C]1690.46296296296[/C][C]32.7533154601012[/C][C]51.6119647497127[/C][/ROW]
[ROW][C]Trimmed Mean ( 10 / 24 )[/C][C]1689.71153846154[/C][C]31.9963037144366[/C][C]52.8095855553198[/C][/ROW]
[ROW][C]Trimmed Mean ( 11 / 24 )[/C][C]1688.64[/C][C]31.2614225328201[/C][C]54.0167357460195[/C][/ROW]
[ROW][C]Trimmed Mean ( 12 / 24 )[/C][C]1687.375[/C][C]30.4916513541816[/C][C]55.3389181976395[/C][/ROW]
[ROW][C]Trimmed Mean ( 13 / 24 )[/C][C]1686.28260869565[/C][C]29.783902260423[/C][C]56.6172489404248[/C][/ROW]
[ROW][C]Trimmed Mean ( 14 / 24 )[/C][C]1685.68181818182[/C][C]29.1291099274635[/C][C]57.8693211834985[/C][/ROW]
[ROW][C]Trimmed Mean ( 15 / 24 )[/C][C]1684.85714285714[/C][C]28.325623835223[/C][C]59.481731193578[/C][/ROW]
[ROW][C]Trimmed Mean ( 16 / 24 )[/C][C]1683.15[/C][C]27.4819882739073[/C][C]61.245568669355[/C][/ROW]
[ROW][C]Trimmed Mean ( 17 / 24 )[/C][C]1680.68421052632[/C][C]26.5511156621778[/C][C]63.2999468613841[/C][/ROW]
[ROW][C]Trimmed Mean ( 18 / 24 )[/C][C]1678.88888888889[/C][C]25.6819613606478[/C][C]65.3723002426689[/C][/ROW]
[ROW][C]Trimmed Mean ( 19 / 24 )[/C][C]1677.14705882353[/C][C]24.5909904937429[/C][C]68.201687900708[/C][/ROW]
[ROW][C]Trimmed Mean ( 20 / 24 )[/C][C]1675.15625[/C][C]23.2881281785913[/C][C]71.9317687172455[/C][/ROW]
[ROW][C]Trimmed Mean ( 21 / 24 )[/C][C]1675.56666666667[/C][C]22.5397571269301[/C][C]74.3382751300691[/C][/ROW]
[ROW][C]Trimmed Mean ( 22 / 24 )[/C][C]1675.35714285714[/C][C]21.7960856568836[/C][C]76.8650467442091[/C][/ROW]
[ROW][C]Trimmed Mean ( 23 / 24 )[/C][C]1674.65384615385[/C][C]21.0734935446763[/C][C]79.4673100880753[/C][/ROW]
[ROW][C]Trimmed Mean ( 24 / 24 )[/C][C]1673.75[/C][C]20.1104063118821[/C][C]83.2280548708297[/C][/ROW]
[ROW][C]Median[/C][C]1677.5[/C][C][/C][C][/C][/ROW]
[ROW][C]Midrange[/C][C]1647[/C][C][/C][C][/C][/ROW]
[ROW][C]Midmean - Weighted Average at Xnp[/C][C]1672.21621621622[/C][C][/C][C][/C][/ROW]
[ROW][C]Midmean - Weighted Average at X(n+1)p[/C][C]1678.88888888889[/C][C][/C][C][/C][/ROW]
[ROW][C]Midmean - Empirical Distribution Function[/C][C]1672.21621621622[/C][C][/C][C][/C][/ROW]
[ROW][C]Midmean - Empirical Distribution Function - Averaging[/C][C]1678.88888888889[/C][C][/C][C][/C][/ROW]
[ROW][C]Midmean - Empirical Distribution Function - Interpolation[/C][C]1678.88888888889[/C][C][/C][C][/C][/ROW]
[ROW][C]Midmean - Closest Observation[/C][C]1672.21621621622[/C][C][/C][C][/C][/ROW]
[ROW][C]Midmean - True Basic - Statistics Graphics Toolkit[/C][C]1678.88888888889[/C][C][/C][C][/C][/ROW]
[ROW][C]Midmean - MS Excel (old versions)[/C][C]1680.68421052632[/C][C][/C][C][/C][/ROW]
[ROW][C]Number of observations[/C][C]72[/C][C][/C][C][/C][/ROW]
[/TABLE]
Source: https://freestatistics.org/blog/index.php?pk=234033&T=1

Globally Unique Identifier (entire table): ba.freestatistics.org/blog/index.php?pk=234033&T=1

As an alternative you can also use a QR Code:  

The GUIDs for individual cells are displayed in the table below:

Central Tendency - Ungrouped Data
MeasureValueS.E.Value/S.E.
Arithmetic Mean1683.7777777777841.213399479344840.8551053552776
Geometric Mean1645.90112840098
Harmonic Mean1605.75211867522
Quadratic Mean1719.21617314403
Winsorized Mean ( 1 / 24 )1683.4166666666740.330620859010341.7404104080528
Winsorized Mean ( 2 / 24 )1683.8888888888939.365704211378342.7755306966457
Winsorized Mean ( 3 / 24 )1682.8888888888939.162184118455942.9722939813205
Winsorized Mean ( 4 / 24 )1684.3333333333338.327709324122543.9455778348135
Winsorized Mean ( 5 / 24 )1687.5972222222237.54206644059444.9521665221239
Winsorized Mean ( 6 / 24 )1692.4305555555636.495850656966846.3732321644758
Winsorized Mean ( 7 / 24 )1694.4722222222235.734698686679747.4181197686675
Winsorized Mean ( 8 / 24 )1694.4722222222235.581443376611347.6223576510684
Winsorized Mean ( 9 / 24 )1695.3472222222235.010020696753448.4246278203269
Winsorized Mean ( 10 / 24 )1697.1527777777834.022774176213649.8828452079699
Winsorized Mean ( 11 / 24 )1697.9166666666733.252370866324951.0615220037188
Winsorized Mean ( 12 / 24 )1695.7531.975396143424953.0329629817173
Winsorized Mean ( 13 / 24 )1691.0555555555630.757029610437254.9811076353649
Winsorized Mean ( 14 / 24 )1692.4166666666730.431403594414455.614150737934
Winsorized Mean ( 15 / 24 )1699.0833333333329.393655631663157.8044240098896
Winsorized Mean ( 16 / 24 )1703.9722222222228.443427173649759.9074159319591
Winsorized Mean ( 17 / 24 )1695.9444444444426.883616381892163.0846840080182
Winsorized Mean ( 18 / 24 )1693.6944444444426.387332752075164.1858902662775
Winsorized Mean ( 19 / 24 )1693.9583333333325.5039997898766.4193203924884
Winsorized Mean ( 20 / 24 )1671.7361111111121.923861642811976.2519002513052
Winsorized Mean ( 21 / 24 )1677.2777777777820.657523176320381.1945247966821
Winsorized Mean ( 22 / 24 )1680.9444444444419.31666037672987.0204482380139
Winsorized Mean ( 23 / 24 )1681.5833333333318.708838491878189.8817601137207
Winsorized Mean ( 24 / 24 )1681.9166666666717.762371980466494.6898684768173
Trimmed Mean ( 1 / 24 )1684.8285714285739.292732518226542.8788853166942
Trimmed Mean ( 2 / 24 )1686.3235294117638.058082783221444.3092086119275
Trimmed Mean ( 3 / 24 )1687.6515151515237.201740017607345.3648542878039
Trimmed Mean ( 4 / 24 )1689.437536.263242484040946.5881532999567
Trimmed Mean ( 5 / 24 )1690.9193548387135.438294428448547.7144676997012
Trimmed Mean ( 6 / 24 )1691.7166666666734.683712874989748.775535444089
Trimmed Mean ( 7 / 24 )1691.5689655172434.051836859531549.6762912525159
Trimmed Mean ( 8 / 24 )1691.0357142857133.460443444613950.5383533569971
Trimmed Mean ( 9 / 24 )1690.4629629629632.753315460101251.6119647497127
Trimmed Mean ( 10 / 24 )1689.7115384615431.996303714436652.8095855553198
Trimmed Mean ( 11 / 24 )1688.6431.261422532820154.0167357460195
Trimmed Mean ( 12 / 24 )1687.37530.491651354181655.3389181976395
Trimmed Mean ( 13 / 24 )1686.2826086956529.78390226042356.6172489404248
Trimmed Mean ( 14 / 24 )1685.6818181818229.129109927463557.8693211834985
Trimmed Mean ( 15 / 24 )1684.8571428571428.32562383522359.481731193578
Trimmed Mean ( 16 / 24 )1683.1527.481988273907361.245568669355
Trimmed Mean ( 17 / 24 )1680.6842105263226.551115662177863.2999468613841
Trimmed Mean ( 18 / 24 )1678.8888888888925.681961360647865.3723002426689
Trimmed Mean ( 19 / 24 )1677.1470588235324.590990493742968.201687900708
Trimmed Mean ( 20 / 24 )1675.1562523.288128178591371.9317687172455
Trimmed Mean ( 21 / 24 )1675.5666666666722.539757126930174.3382751300691
Trimmed Mean ( 22 / 24 )1675.3571428571421.796085656883676.8650467442091
Trimmed Mean ( 23 / 24 )1674.6538461538521.073493544676379.4673100880753
Trimmed Mean ( 24 / 24 )1673.7520.110406311882183.2280548708297
Median1677.5
Midrange1647
Midmean - Weighted Average at Xnp1672.21621621622
Midmean - Weighted Average at X(n+1)p1678.88888888889
Midmean - Empirical Distribution Function1672.21621621622
Midmean - Empirical Distribution Function - Averaging1678.88888888889
Midmean - Empirical Distribution Function - Interpolation1678.88888888889
Midmean - Closest Observation1672.21621621622
Midmean - True Basic - Statistics Graphics Toolkit1678.88888888889
Midmean - MS Excel (old versions)1680.68421052632
Number of observations72


Parameters (Session):
Parameters (R input):
R code (references can be found in the software module):
geomean <- function(x) {
return(exp(mean(log(x))))
}
harmean <- function(x) {
return(1/mean(1/x))
}
quamean <- function(x) {
return(sqrt(mean(x*x)))
}
winmean <- function(x) {
x <-sort(x[!is.na(x)])
n<-length(x)
denom <- 3
nodenom <- n/denom
if (nodenom>40) denom <- n/40
sqrtn = sqrt(n)
roundnodenom = floor(nodenom)
win <- array(NA,dim=c(roundnodenom,2))
for (j in 1:roundnodenom) {
win[j,1] <- (j*x[j+1]+sum(x[(j+1):(n-j)])+j*x[n-j])/n
win[j,2] <- sd(c(rep(x[j+1],j),x[(j+1):(n-j)],rep(x[n-j],j)))/sqrtn
}
return(win)
}
trimean <- function(x) {
x <-sort(x[!is.na(x)])
n<-length(x)
denom <- 3
nodenom <- n/denom
if (nodenom>40) denom <- n/40
sqrtn = sqrt(n)
roundnodenom = floor(nodenom)
tri <- array(NA,dim=c(roundnodenom,2))
for (j in 1:roundnodenom) {
tri[j,1] <- mean(x,trim=j/n)
tri[j,2] <- sd(x[(j+1):(n-j)]) / sqrt(n-j*2)
}
return(tri)
}
midrange <- function(x) {
return((max(x)+min(x))/2)
}
q1 <- function(data,n,p,i,f) {
np <- n*p;
i <<- floor(np)
f <<- np - i
qvalue <- (1-f)*data[i] + f*data[i+1]
}
q2 <- function(data,n,p,i,f) {
np <- (n+1)*p
i <<- floor(np)
f <<- np - i
qvalue <- (1-f)*data[i] + f*data[i+1]
}
q3 <- function(data,n,p,i,f) {
np <- n*p
i <<- floor(np)
f <<- np - i
if (f==0) {
qvalue <- data[i]
} else {
qvalue <- data[i+1]
}
}
q4 <- function(data,n,p,i,f) {
np <- n*p
i <<- floor(np)
f <<- np - i
if (f==0) {
qvalue <- (data[i]+data[i+1])/2
} else {
qvalue <- data[i+1]
}
}
q5 <- function(data,n,p,i,f) {
np <- (n-1)*p
i <<- floor(np)
f <<- np - i
if (f==0) {
qvalue <- data[i+1]
} else {
qvalue <- data[i+1] + f*(data[i+2]-data[i+1])
}
}
q6 <- function(data,n,p,i,f) {
np <- n*p+0.5
i <<- floor(np)
f <<- np - i
qvalue <- data[i]
}
q7 <- function(data,n,p,i,f) {
np <- (n+1)*p
i <<- floor(np)
f <<- np - i
if (f==0) {
qvalue <- data[i]
} else {
qvalue <- f*data[i] + (1-f)*data[i+1]
}
}
q8 <- function(data,n,p,i,f) {
np <- (n+1)*p
i <<- floor(np)
f <<- np - i
if (f==0) {
qvalue <- data[i]
} else {
if (f == 0.5) {
qvalue <- (data[i]+data[i+1])/2
} else {
if (f < 0.5) {
qvalue <- data[i]
} else {
qvalue <- data[i+1]
}
}
}
}
midmean <- function(x,def) {
x <-sort(x[!is.na(x)])
n<-length(x)
if (def==1) {
qvalue1 <- q1(x,n,0.25,i,f)
qvalue3 <- q1(x,n,0.75,i,f)
}
if (def==2) {
qvalue1 <- q2(x,n,0.25,i,f)
qvalue3 <- q2(x,n,0.75,i,f)
}
if (def==3) {
qvalue1 <- q3(x,n,0.25,i,f)
qvalue3 <- q3(x,n,0.75,i,f)
}
if (def==4) {
qvalue1 <- q4(x,n,0.25,i,f)
qvalue3 <- q4(x,n,0.75,i,f)
}
if (def==5) {
qvalue1 <- q5(x,n,0.25,i,f)
qvalue3 <- q5(x,n,0.75,i,f)
}
if (def==6) {
qvalue1 <- q6(x,n,0.25,i,f)
qvalue3 <- q6(x,n,0.75,i,f)
}
if (def==7) {
qvalue1 <- q7(x,n,0.25,i,f)
qvalue3 <- q7(x,n,0.75,i,f)
}
if (def==8) {
qvalue1 <- q8(x,n,0.25,i,f)
qvalue3 <- q8(x,n,0.75,i,f)
}
midm <- 0
myn <- 0
roundno4 <- round(n/4)
round3no4 <- round(3*n/4)
for (i in 1:n) {
if ((x[i]>=qvalue1) & (x[i]<=qvalue3)){
midm = midm + x[i]
myn = myn + 1
}
}
midm = midm / myn
return(midm)
}
(arm <- mean(x))
sqrtn <- sqrt(length(x))
(armse <- sd(x) / sqrtn)
(armose <- arm / armse)
(geo <- geomean(x))
(har <- harmean(x))
(qua <- quamean(x))
(win <- winmean(x))
(tri <- trimean(x))
(midr <- midrange(x))
midm <- array(NA,dim=8)
for (j in 1:8) midm[j] <- midmean(x,j)
midm
bitmap(file='test1.png')
lb <- win[,1] - 2*win[,2]
ub <- win[,1] + 2*win[,2]
if ((ylimmin == '') | (ylimmax == '')) plot(win[,1],type='b',main=main, xlab='j', pch=19, ylab='Winsorized Mean(j/n)', ylim=c(min(lb),max(ub))) else plot(win[,1],type='l',main=main, xlab='j', pch=19, ylab='Winsorized Mean(j/n)', ylim=c(ylimmin,ylimmax))
lines(ub,lty=3)
lines(lb,lty=3)
grid()
dev.off()
bitmap(file='test2.png')
lb <- tri[,1] - 2*tri[,2]
ub <- tri[,1] + 2*tri[,2]
if ((ylimmin == '') | (ylimmax == '')) plot(tri[,1],type='b',main=main, xlab='j', pch=19, ylab='Trimmed Mean(j/n)', ylim=c(min(lb),max(ub))) else plot(tri[,1],type='l',main=main, xlab='j', pch=19, ylab='Trimmed Mean(j/n)', ylim=c(ylimmin,ylimmax))
lines(ub,lty=3)
lines(lb,lty=3)
grid()
dev.off()
load(file='createtable')
a<-table.start()
a<-table.row.start(a)
a<-table.element(a,'Central Tendency - Ungrouped Data',4,TRUE)
a<-table.row.end(a)
a<-table.row.start(a)
a<-table.element(a,'Measure',header=TRUE)
a<-table.element(a,'Value',header=TRUE)
a<-table.element(a,'S.E.',header=TRUE)
a<-table.element(a,'Value/S.E.',header=TRUE)
a<-table.row.end(a)
a<-table.row.start(a)
a<-table.element(a,hyperlink('arithmetic_mean.htm', 'Arithmetic Mean', 'click to view the definition of the Arithmetic Mean'),header=TRUE)
a<-table.element(a,arm)
a<-table.element(a,hyperlink('arithmetic_mean_standard_error.htm', armse, 'click to view the definition of the Standard Error of the Arithmetic Mean'))
a<-table.element(a,armose)
a<-table.row.end(a)
a<-table.row.start(a)
a<-table.element(a,hyperlink('geometric_mean.htm', 'Geometric Mean', 'click to view the definition of the Geometric Mean'),header=TRUE)
a<-table.element(a,geo)
a<-table.element(a,'')
a<-table.row.end(a)
a<-table.row.start(a)
a<-table.element(a,hyperlink('harmonic_mean.htm', 'Harmonic Mean', 'click to view the definition of the Harmonic Mean'),header=TRUE)
a<-table.element(a,har)
a<-table.element(a,'')
a<-table.row.end(a)
a<-table.row.start(a)
a<-table.element(a,hyperlink('quadratic_mean.htm', 'Quadratic Mean', 'click to view the definition of the Quadratic Mean'),header=TRUE)
a<-table.element(a,qua)
a<-table.element(a,'')
a<-table.row.end(a)
for (j in 1:length(win[,1])) {
a<-table.row.start(a)
mylabel <- paste('Winsorized Mean (',j)
mylabel <- paste(mylabel,'/')
mylabel <- paste(mylabel,length(win[,1]))
mylabel <- paste(mylabel,')')
a<-table.element(a,hyperlink('winsorized_mean.htm', mylabel, 'click to view the definition of the Winsorized Mean'),header=TRUE)
a<-table.element(a,win[j,1])
a<-table.element(a,win[j,2])
a<-table.element(a,win[j,1]/win[j,2])
a<-table.row.end(a)
}
for (j in 1:length(tri[,1])) {
a<-table.row.start(a)
mylabel <- paste('Trimmed Mean (',j)
mylabel <- paste(mylabel,'/')
mylabel <- paste(mylabel,length(tri[,1]))
mylabel <- paste(mylabel,')')
a<-table.element(a,hyperlink('arithmetic_mean.htm', mylabel, 'click to view the definition of the Trimmed Mean'),header=TRUE)
a<-table.element(a,tri[j,1])
a<-table.element(a,tri[j,2])
a<-table.element(a,tri[j,1]/tri[j,2])
a<-table.row.end(a)
}
a<-table.row.start(a)
a<-table.element(a,hyperlink('median_1.htm', 'Median', 'click to view the definition of the Median'),header=TRUE)
a<-table.element(a,median(x))
a<-table.element(a,'')
a<-table.row.end(a)
a<-table.row.start(a)
a<-table.element(a,hyperlink('midrange.htm', 'Midrange', 'click to view the definition of the Midrange'),header=TRUE)
a<-table.element(a,midr)
a<-table.element(a,'')
a<-table.row.end(a)
a<-table.row.start(a)
mymid <- hyperlink('midmean.htm', 'Midmean', 'click to view the definition of the Midmean')
mylabel <- paste(mymid,hyperlink('method_1.htm','Weighted Average at Xnp',''),sep=' - ')
a<-table.element(a,mylabel,header=TRUE)
a<-table.element(a,midm[1])
a<-table.element(a,'')
a<-table.row.end(a)
a<-table.row.start(a)
mymid <- hyperlink('midmean.htm', 'Midmean', 'click to view the definition of the Midmean')
mylabel <- paste(mymid,hyperlink('method_2.htm','Weighted Average at X(n+1)p',''),sep=' - ')
a<-table.element(a,mylabel,header=TRUE)
a<-table.element(a,midm[2])
a<-table.element(a,'')
a<-table.row.end(a)
a<-table.row.start(a)
mymid <- hyperlink('midmean.htm', 'Midmean', 'click to view the definition of the Midmean')
mylabel <- paste(mymid,hyperlink('method_3.htm','Empirical Distribution Function',''),sep=' - ')
a<-table.element(a,mylabel,header=TRUE)
a<-table.element(a,midm[3])
a<-table.element(a,'')
a<-table.row.end(a)
a<-table.row.start(a)
mymid <- hyperlink('midmean.htm', 'Midmean', 'click to view the definition of the Midmean')
mylabel <- paste(mymid,hyperlink('method_4.htm','Empirical Distribution Function - Averaging',''),sep=' - ')
a<-table.element(a,mylabel,header=TRUE)
a<-table.element(a,midm[4])
a<-table.element(a,'')
a<-table.row.end(a)
a<-table.row.start(a)
mymid <- hyperlink('midmean.htm', 'Midmean', 'click to view the definition of the Midmean')
mylabel <- paste(mymid,hyperlink('method_5.htm','Empirical Distribution Function - Interpolation',''),sep=' - ')
a<-table.element(a,mylabel,header=TRUE)
a<-table.element(a,midm[5])
a<-table.element(a,'')
a<-table.row.end(a)
a<-table.row.start(a)
mymid <- hyperlink('midmean.htm', 'Midmean', 'click to view the definition of the Midmean')
mylabel <- paste(mymid,hyperlink('method_6.htm','Closest Observation',''),sep=' - ')
a<-table.element(a,mylabel,header=TRUE)
a<-table.element(a,midm[6])
a<-table.element(a,'')
a<-table.row.end(a)
a<-table.row.start(a)
mymid <- hyperlink('midmean.htm', 'Midmean', 'click to view the definition of the Midmean')
mylabel <- paste(mymid,hyperlink('method_7.htm','True Basic - Statistics Graphics Toolkit',''),sep=' - ')
a<-table.element(a,mylabel,header=TRUE)
a<-table.element(a,midm[7])
a<-table.element(a,'')
a<-table.row.end(a)
a<-table.row.start(a)
mymid <- hyperlink('midmean.htm', 'Midmean', 'click to view the definition of the Midmean')
mylabel <- paste(mymid,hyperlink('method_8.htm','MS Excel (old versions)',''),sep=' - ')
a<-table.element(a,mylabel,header=TRUE)
a<-table.element(a,midm[8])
a<-table.element(a,'')
a<-table.row.end(a)
a<-table.row.start(a)
a<-table.element(a,'Number of observations',header=TRUE)
a<-table.element(a,length(x))
a<-table.element(a,'')
a<-table.row.end(a)
a<-table.end(a)
table.save(a,file='mytable.tab')