Free Statistics

of Irreproducible Research!

Author's title

Author*Unverified author*
R Software Modulerwasp_centraltendency.wasp
Title produced by softwareCentral Tendency
Date of computationWed, 26 Feb 2014 09:54:11 -0500
Cite this page as followsStatistical Computations at FreeStatistics.org, Office for Research Development and Education, URL https://freestatistics.org/blog/index.php?v=date/2014/Feb/26/t1393426524oqx9wdht8h5t0z9.htm/, Retrieved Wed, 15 May 2024 00:24:18 +0000
Statistical Computations at FreeStatistics.org, Office for Research Development and Education, URL https://freestatistics.org/blog/index.php?pk=234056, Retrieved Wed, 15 May 2024 00:24:18 +0000
QR Codes:

Original text written by user:
IsPrivate?No (this computation is public)
User-defined keywords
Estimated Impact153
Family? (F = Feedback message, R = changed R code, M = changed R Module, P = changed Parameters, D = changed Data)
-       [Central Tendency] [] [2014-02-26 14:54:11] [c97636ecf0aef6cf672ffb6fe15d6b60] [Current]
-         [Central Tendency] [] [2014-05-19 08:49:23] [ccb4fa85fbb66dbee3adf4746bc114a3]
-         [Central Tendency] [] [2014-05-19 08:51:07] [ccb4fa85fbb66dbee3adf4746bc114a3]
Feedback Forum

Post a new message
Dataseries X:
80
80
80
80
80
80
80
80
80
80
80
80
80
80
85
85
85
85
85
85
85
85
85
85
85
85
85
85
85
85
85
85
85
85
85
85
90
90
90
90
90
90
90
90
90
90
90
90
90
90
90
90
90
90
90
90
90
90
90
90
90
90
90
90
90
90
90
90
90
90
90
90
90
90
90
90
90
90
90
90
90
90
90
90
90
90
90
90
90
90
90
90
90
90
90
90
90
90
90
90
90
90
100
100
100
100
100
100
100
100
100
100
100
100
100
100
100
110
110
110
110
110
110
110
110
110
110
110
110
110
120
120
120
120
120
120
120
120
120
120
120
120
120
120
120
120
120
120
120
120
120
200
210


Summary of computational transaction
Raw Inputview raw input (R code)
Raw Outputview raw output of R engine
Computing time3 seconds
R Server'Herman Ole Andreas Wold' @ wold.wessa.net

\begin{tabular}{lllllllll}
\hline
Summary of computational transaction \tabularnewline
Raw Input & view raw input (R code)  \tabularnewline
Raw Output & view raw output of R engine  \tabularnewline
Computing time & 3 seconds \tabularnewline
R Server & 'Herman Ole Andreas Wold' @ wold.wessa.net \tabularnewline
\hline
\end{tabular}
%Source: https://freestatistics.org/blog/index.php?pk=234056&T=0

[TABLE]
[ROW][C]Summary of computational transaction[/C][/ROW]
[ROW][C]Raw Input[/C][C]view raw input (R code) [/C][/ROW]
[ROW][C]Raw Output[/C][C]view raw output of R engine [/C][/ROW]
[ROW][C]Computing time[/C][C]3 seconds[/C][/ROW]
[ROW][C]R Server[/C][C]'Herman Ole Andreas Wold' @ wold.wessa.net[/C][/ROW]
[/TABLE]
Source: https://freestatistics.org/blog/index.php?pk=234056&T=0

Globally Unique Identifier (entire table): ba.freestatistics.org/blog/index.php?pk=234056&T=0

As an alternative you can also use a QR Code:  

The GUIDs for individual cells are displayed in the table below:

Summary of computational transaction
Raw Inputview raw input (R code)
Raw Outputview raw output of R engine
Computing time3 seconds
R Server'Herman Ole Andreas Wold' @ wold.wessa.net


Central Tendency - Ungrouped Data
MeasureValueS.E.Value/S.E.
Arithmetic Mean107.1621621621622.3684982930167745.2447706963171
Geometric Mean105.667736979648
Harmonic Mean104.446119065561
Quadratic Mean109.056147205205
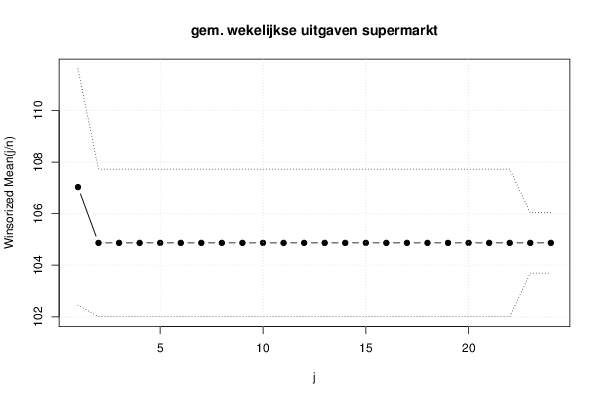
Winsorized Mean ( 1 / 24 )107.0270270270272.2906998499706846.7224141252714
Winsorized Mean ( 2 / 24 )104.8648648648651.430135843818773.3251077637901
Winsorized Mean ( 3 / 24 )104.8648648648651.430135843818773.3251077637901
Winsorized Mean ( 4 / 24 )104.8648648648651.430135843818773.3251077637901
Winsorized Mean ( 5 / 24 )104.8648648648651.430135843818773.3251077637901
Winsorized Mean ( 6 / 24 )104.8648648648651.430135843818773.3251077637901
Winsorized Mean ( 7 / 24 )104.8648648648651.430135843818773.3251077637901
Winsorized Mean ( 8 / 24 )104.8648648648651.430135843818773.3251077637901
Winsorized Mean ( 9 / 24 )104.8648648648651.430135843818773.3251077637901
Winsorized Mean ( 10 / 24 )104.8648648648651.430135843818773.3251077637901
Winsorized Mean ( 11 / 24 )104.8648648648651.430135843818773.3251077637901
Winsorized Mean ( 12 / 24 )104.8648648648651.430135843818773.3251077637901
Winsorized Mean ( 13 / 24 )104.8648648648651.430135843818773.3251077637901
Winsorized Mean ( 14 / 24 )104.8648648648651.430135843818773.3251077637901
Winsorized Mean ( 15 / 24 )104.8648648648651.430135843818773.3251077637901
Winsorized Mean ( 16 / 24 )104.8648648648651.430135843818773.3251077637901
Winsorized Mean ( 17 / 24 )104.8648648648651.430135843818773.3251077637901
Winsorized Mean ( 18 / 24 )104.8648648648651.430135843818773.3251077637901
Winsorized Mean ( 19 / 24 )104.8648648648651.430135843818773.3251077637901
Winsorized Mean ( 20 / 24 )104.8648648648651.430135843818773.3251077637901
Winsorized Mean ( 21 / 24 )104.8648648648651.430135843818773.3251077637901
Winsorized Mean ( 22 / 24 )104.8648648648651.430135843818773.3251077637901
Winsorized Mean ( 23 / 24 )104.8648648648650.584991962188687179.258642242748
Winsorized Mean ( 24 / 24 )104.8648648648650.584991962188687179.258642242748
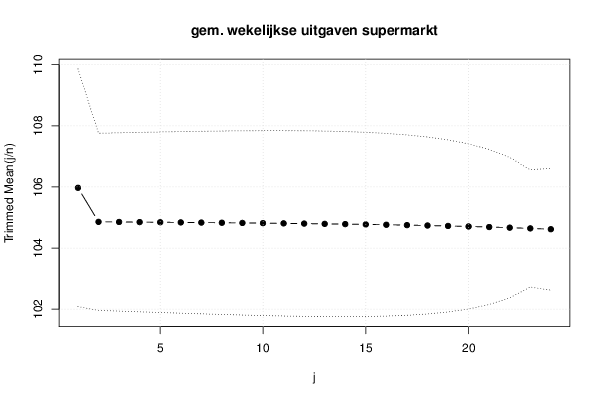
Trimmed Mean ( 1 / 24 )105.9722222222221.9446540240284154.4941264167379
Trimmed Mean ( 2 / 24 )104.8571428571431.4495356169753972.3384383447843
Trimmed Mean ( 3 / 24 )104.8529411764711.4590194648786671.8653477218627
Trimmed Mean ( 4 / 24 )104.8484848484851.4682724454289171.4094207617283
Trimmed Mean ( 5 / 24 )104.843751.4772109388093870.9741224124045
Trimmed Mean ( 6 / 24 )104.8387096774191.4857321691577470.5636667588964
Trimmed Mean ( 7 / 24 )104.8333333333331.4937093453166470.1832211614843
Trimmed Mean ( 8 / 24 )104.8275862068971.500985345055269.8391803439238
Trimmed Mean ( 9 / 24 )104.8214285714291.5073644202255169.5395401171449
Trimmed Mean ( 10 / 24 )104.8148148148151.5126011754308569.2944158164885
Trimmed Mean ( 11 / 24 )104.8076923076921.5163857317433269.1167755760926
Trimmed Mean ( 12 / 24 )104.81.5183234577813169.0235005346898
Trimmed Mean ( 13 / 24 )104.7916666666671.517906807300869.0369567898644
Trimmed Mean ( 14 / 24 )104.7826086956521.5144754176942869.1873948374674
Trimmed Mean ( 15 / 24 )104.7727272727271.5071582672923569.5167385844315
Trimmed Mean ( 16 / 24 )104.7619047619051.4947875069171870.0848142475873
Trimmed Mean ( 17 / 24 )104.751.4757657725345970.9800985695003
Trimmed Mean ( 18 / 24 )104.7368421052631.4478532745376472.339403409997
Trimmed Mean ( 19 / 24 )104.7222222222221.4078076568157574.3867400601357
Trimmed Mean ( 20 / 24 )104.7058823529411.3507305818518877.5179623233133
Trimmed Mean ( 21 / 24 )104.68751.2687604282107682.5116370847357
Trimmed Mean ( 22 / 24 )104.6666666666671.1480451484306991.1694690838071
Trimmed Mean ( 23 / 24 )104.6428571428570.959792589083161109.026531703914
Trimmed Mean ( 24 / 24 )104.6153846153850.997037030524286104.926277974222
Median100
Midrange150
Midmean - Weighted Average at Xnp104.444444444444
Midmean - Weighted Average at X(n+1)p104.444444444444
Midmean - Empirical Distribution Function104.444444444444
Midmean - Empirical Distribution Function - Averaging104.444444444444
Midmean - Empirical Distribution Function - Interpolation104.444444444444
Midmean - Closest Observation104.444444444444
Midmean - True Basic - Statistics Graphics Toolkit104.444444444444
Midmean - MS Excel (old versions)104.444444444444
Number of observations74

\begin{tabular}{lllllllll}
\hline
Central Tendency - Ungrouped Data \tabularnewline
Measure & Value & S.E. & Value/S.E. \tabularnewline
Arithmetic Mean & 107.162162162162 & 2.36849829301677 & 45.2447706963171 \tabularnewline
Geometric Mean & 105.667736979648 &  &  \tabularnewline
Harmonic Mean & 104.446119065561 &  &  \tabularnewline
Quadratic Mean & 109.056147205205 &  &  \tabularnewline
Winsorized Mean ( 1 / 24 ) & 107.027027027027 & 2.29069984997068 & 46.7224141252714 \tabularnewline
Winsorized Mean ( 2 / 24 ) & 104.864864864865 & 1.4301358438187 & 73.3251077637901 \tabularnewline
Winsorized Mean ( 3 / 24 ) & 104.864864864865 & 1.4301358438187 & 73.3251077637901 \tabularnewline
Winsorized Mean ( 4 / 24 ) & 104.864864864865 & 1.4301358438187 & 73.3251077637901 \tabularnewline
Winsorized Mean ( 5 / 24 ) & 104.864864864865 & 1.4301358438187 & 73.3251077637901 \tabularnewline
Winsorized Mean ( 6 / 24 ) & 104.864864864865 & 1.4301358438187 & 73.3251077637901 \tabularnewline
Winsorized Mean ( 7 / 24 ) & 104.864864864865 & 1.4301358438187 & 73.3251077637901 \tabularnewline
Winsorized Mean ( 8 / 24 ) & 104.864864864865 & 1.4301358438187 & 73.3251077637901 \tabularnewline
Winsorized Mean ( 9 / 24 ) & 104.864864864865 & 1.4301358438187 & 73.3251077637901 \tabularnewline
Winsorized Mean ( 10 / 24 ) & 104.864864864865 & 1.4301358438187 & 73.3251077637901 \tabularnewline
Winsorized Mean ( 11 / 24 ) & 104.864864864865 & 1.4301358438187 & 73.3251077637901 \tabularnewline
Winsorized Mean ( 12 / 24 ) & 104.864864864865 & 1.4301358438187 & 73.3251077637901 \tabularnewline
Winsorized Mean ( 13 / 24 ) & 104.864864864865 & 1.4301358438187 & 73.3251077637901 \tabularnewline
Winsorized Mean ( 14 / 24 ) & 104.864864864865 & 1.4301358438187 & 73.3251077637901 \tabularnewline
Winsorized Mean ( 15 / 24 ) & 104.864864864865 & 1.4301358438187 & 73.3251077637901 \tabularnewline
Winsorized Mean ( 16 / 24 ) & 104.864864864865 & 1.4301358438187 & 73.3251077637901 \tabularnewline
Winsorized Mean ( 17 / 24 ) & 104.864864864865 & 1.4301358438187 & 73.3251077637901 \tabularnewline
Winsorized Mean ( 18 / 24 ) & 104.864864864865 & 1.4301358438187 & 73.3251077637901 \tabularnewline
Winsorized Mean ( 19 / 24 ) & 104.864864864865 & 1.4301358438187 & 73.3251077637901 \tabularnewline
Winsorized Mean ( 20 / 24 ) & 104.864864864865 & 1.4301358438187 & 73.3251077637901 \tabularnewline
Winsorized Mean ( 21 / 24 ) & 104.864864864865 & 1.4301358438187 & 73.3251077637901 \tabularnewline
Winsorized Mean ( 22 / 24 ) & 104.864864864865 & 1.4301358438187 & 73.3251077637901 \tabularnewline
Winsorized Mean ( 23 / 24 ) & 104.864864864865 & 0.584991962188687 & 179.258642242748 \tabularnewline
Winsorized Mean ( 24 / 24 ) & 104.864864864865 & 0.584991962188687 & 179.258642242748 \tabularnewline
Trimmed Mean ( 1 / 24 ) & 105.972222222222 & 1.94465402402841 & 54.4941264167379 \tabularnewline
Trimmed Mean ( 2 / 24 ) & 104.857142857143 & 1.44953561697539 & 72.3384383447843 \tabularnewline
Trimmed Mean ( 3 / 24 ) & 104.852941176471 & 1.45901946487866 & 71.8653477218627 \tabularnewline
Trimmed Mean ( 4 / 24 ) & 104.848484848485 & 1.46827244542891 & 71.4094207617283 \tabularnewline
Trimmed Mean ( 5 / 24 ) & 104.84375 & 1.47721093880938 & 70.9741224124045 \tabularnewline
Trimmed Mean ( 6 / 24 ) & 104.838709677419 & 1.48573216915774 & 70.5636667588964 \tabularnewline
Trimmed Mean ( 7 / 24 ) & 104.833333333333 & 1.49370934531664 & 70.1832211614843 \tabularnewline
Trimmed Mean ( 8 / 24 ) & 104.827586206897 & 1.5009853450552 & 69.8391803439238 \tabularnewline
Trimmed Mean ( 9 / 24 ) & 104.821428571429 & 1.50736442022551 & 69.5395401171449 \tabularnewline
Trimmed Mean ( 10 / 24 ) & 104.814814814815 & 1.51260117543085 & 69.2944158164885 \tabularnewline
Trimmed Mean ( 11 / 24 ) & 104.807692307692 & 1.51638573174332 & 69.1167755760926 \tabularnewline
Trimmed Mean ( 12 / 24 ) & 104.8 & 1.51832345778131 & 69.0235005346898 \tabularnewline
Trimmed Mean ( 13 / 24 ) & 104.791666666667 & 1.5179068073008 & 69.0369567898644 \tabularnewline
Trimmed Mean ( 14 / 24 ) & 104.782608695652 & 1.51447541769428 & 69.1873948374674 \tabularnewline
Trimmed Mean ( 15 / 24 ) & 104.772727272727 & 1.50715826729235 & 69.5167385844315 \tabularnewline
Trimmed Mean ( 16 / 24 ) & 104.761904761905 & 1.49478750691718 & 70.0848142475873 \tabularnewline
Trimmed Mean ( 17 / 24 ) & 104.75 & 1.47576577253459 & 70.9800985695003 \tabularnewline
Trimmed Mean ( 18 / 24 ) & 104.736842105263 & 1.44785327453764 & 72.339403409997 \tabularnewline
Trimmed Mean ( 19 / 24 ) & 104.722222222222 & 1.40780765681575 & 74.3867400601357 \tabularnewline
Trimmed Mean ( 20 / 24 ) & 104.705882352941 & 1.35073058185188 & 77.5179623233133 \tabularnewline
Trimmed Mean ( 21 / 24 ) & 104.6875 & 1.26876042821076 & 82.5116370847357 \tabularnewline
Trimmed Mean ( 22 / 24 ) & 104.666666666667 & 1.14804514843069 & 91.1694690838071 \tabularnewline
Trimmed Mean ( 23 / 24 ) & 104.642857142857 & 0.959792589083161 & 109.026531703914 \tabularnewline
Trimmed Mean ( 24 / 24 ) & 104.615384615385 & 0.997037030524286 & 104.926277974222 \tabularnewline
Median & 100 &  &  \tabularnewline
Midrange & 150 &  &  \tabularnewline
Midmean - Weighted Average at Xnp & 104.444444444444 &  &  \tabularnewline
Midmean - Weighted Average at X(n+1)p & 104.444444444444 &  &  \tabularnewline
Midmean - Empirical Distribution Function & 104.444444444444 &  &  \tabularnewline
Midmean - Empirical Distribution Function - Averaging & 104.444444444444 &  &  \tabularnewline
Midmean - Empirical Distribution Function - Interpolation & 104.444444444444 &  &  \tabularnewline
Midmean - Closest Observation & 104.444444444444 &  &  \tabularnewline
Midmean - True Basic - Statistics Graphics Toolkit & 104.444444444444 &  &  \tabularnewline
Midmean - MS Excel (old versions) & 104.444444444444 &  &  \tabularnewline
Number of observations & 74 &  &  \tabularnewline
\hline
\end{tabular}
%Source: https://freestatistics.org/blog/index.php?pk=234056&T=1

[TABLE]
[ROW][C]Central Tendency - Ungrouped Data[/C][/ROW]
[ROW][C]Measure[/C][C]Value[/C][C]S.E.[/C][C]Value/S.E.[/C][/ROW]
[ROW][C]Arithmetic Mean[/C][C]107.162162162162[/C][C]2.36849829301677[/C][C]45.2447706963171[/C][/ROW]
[ROW][C]Geometric Mean[/C][C]105.667736979648[/C][C][/C][C][/C][/ROW]
[ROW][C]Harmonic Mean[/C][C]104.446119065561[/C][C][/C][C][/C][/ROW]
[ROW][C]Quadratic Mean[/C][C]109.056147205205[/C][C][/C][C][/C][/ROW]
[ROW][C]Winsorized Mean ( 1 / 24 )[/C][C]107.027027027027[/C][C]2.29069984997068[/C][C]46.7224141252714[/C][/ROW]
[ROW][C]Winsorized Mean ( 2 / 24 )[/C][C]104.864864864865[/C][C]1.4301358438187[/C][C]73.3251077637901[/C][/ROW]
[ROW][C]Winsorized Mean ( 3 / 24 )[/C][C]104.864864864865[/C][C]1.4301358438187[/C][C]73.3251077637901[/C][/ROW]
[ROW][C]Winsorized Mean ( 4 / 24 )[/C][C]104.864864864865[/C][C]1.4301358438187[/C][C]73.3251077637901[/C][/ROW]
[ROW][C]Winsorized Mean ( 5 / 24 )[/C][C]104.864864864865[/C][C]1.4301358438187[/C][C]73.3251077637901[/C][/ROW]
[ROW][C]Winsorized Mean ( 6 / 24 )[/C][C]104.864864864865[/C][C]1.4301358438187[/C][C]73.3251077637901[/C][/ROW]
[ROW][C]Winsorized Mean ( 7 / 24 )[/C][C]104.864864864865[/C][C]1.4301358438187[/C][C]73.3251077637901[/C][/ROW]
[ROW][C]Winsorized Mean ( 8 / 24 )[/C][C]104.864864864865[/C][C]1.4301358438187[/C][C]73.3251077637901[/C][/ROW]
[ROW][C]Winsorized Mean ( 9 / 24 )[/C][C]104.864864864865[/C][C]1.4301358438187[/C][C]73.3251077637901[/C][/ROW]
[ROW][C]Winsorized Mean ( 10 / 24 )[/C][C]104.864864864865[/C][C]1.4301358438187[/C][C]73.3251077637901[/C][/ROW]
[ROW][C]Winsorized Mean ( 11 / 24 )[/C][C]104.864864864865[/C][C]1.4301358438187[/C][C]73.3251077637901[/C][/ROW]
[ROW][C]Winsorized Mean ( 12 / 24 )[/C][C]104.864864864865[/C][C]1.4301358438187[/C][C]73.3251077637901[/C][/ROW]
[ROW][C]Winsorized Mean ( 13 / 24 )[/C][C]104.864864864865[/C][C]1.4301358438187[/C][C]73.3251077637901[/C][/ROW]
[ROW][C]Winsorized Mean ( 14 / 24 )[/C][C]104.864864864865[/C][C]1.4301358438187[/C][C]73.3251077637901[/C][/ROW]
[ROW][C]Winsorized Mean ( 15 / 24 )[/C][C]104.864864864865[/C][C]1.4301358438187[/C][C]73.3251077637901[/C][/ROW]
[ROW][C]Winsorized Mean ( 16 / 24 )[/C][C]104.864864864865[/C][C]1.4301358438187[/C][C]73.3251077637901[/C][/ROW]
[ROW][C]Winsorized Mean ( 17 / 24 )[/C][C]104.864864864865[/C][C]1.4301358438187[/C][C]73.3251077637901[/C][/ROW]
[ROW][C]Winsorized Mean ( 18 / 24 )[/C][C]104.864864864865[/C][C]1.4301358438187[/C][C]73.3251077637901[/C][/ROW]
[ROW][C]Winsorized Mean ( 19 / 24 )[/C][C]104.864864864865[/C][C]1.4301358438187[/C][C]73.3251077637901[/C][/ROW]
[ROW][C]Winsorized Mean ( 20 / 24 )[/C][C]104.864864864865[/C][C]1.4301358438187[/C][C]73.3251077637901[/C][/ROW]
[ROW][C]Winsorized Mean ( 21 / 24 )[/C][C]104.864864864865[/C][C]1.4301358438187[/C][C]73.3251077637901[/C][/ROW]
[ROW][C]Winsorized Mean ( 22 / 24 )[/C][C]104.864864864865[/C][C]1.4301358438187[/C][C]73.3251077637901[/C][/ROW]
[ROW][C]Winsorized Mean ( 23 / 24 )[/C][C]104.864864864865[/C][C]0.584991962188687[/C][C]179.258642242748[/C][/ROW]
[ROW][C]Winsorized Mean ( 24 / 24 )[/C][C]104.864864864865[/C][C]0.584991962188687[/C][C]179.258642242748[/C][/ROW]
[ROW][C]Trimmed Mean ( 1 / 24 )[/C][C]105.972222222222[/C][C]1.94465402402841[/C][C]54.4941264167379[/C][/ROW]
[ROW][C]Trimmed Mean ( 2 / 24 )[/C][C]104.857142857143[/C][C]1.44953561697539[/C][C]72.3384383447843[/C][/ROW]
[ROW][C]Trimmed Mean ( 3 / 24 )[/C][C]104.852941176471[/C][C]1.45901946487866[/C][C]71.8653477218627[/C][/ROW]
[ROW][C]Trimmed Mean ( 4 / 24 )[/C][C]104.848484848485[/C][C]1.46827244542891[/C][C]71.4094207617283[/C][/ROW]
[ROW][C]Trimmed Mean ( 5 / 24 )[/C][C]104.84375[/C][C]1.47721093880938[/C][C]70.9741224124045[/C][/ROW]
[ROW][C]Trimmed Mean ( 6 / 24 )[/C][C]104.838709677419[/C][C]1.48573216915774[/C][C]70.5636667588964[/C][/ROW]
[ROW][C]Trimmed Mean ( 7 / 24 )[/C][C]104.833333333333[/C][C]1.49370934531664[/C][C]70.1832211614843[/C][/ROW]
[ROW][C]Trimmed Mean ( 8 / 24 )[/C][C]104.827586206897[/C][C]1.5009853450552[/C][C]69.8391803439238[/C][/ROW]
[ROW][C]Trimmed Mean ( 9 / 24 )[/C][C]104.821428571429[/C][C]1.50736442022551[/C][C]69.5395401171449[/C][/ROW]
[ROW][C]Trimmed Mean ( 10 / 24 )[/C][C]104.814814814815[/C][C]1.51260117543085[/C][C]69.2944158164885[/C][/ROW]
[ROW][C]Trimmed Mean ( 11 / 24 )[/C][C]104.807692307692[/C][C]1.51638573174332[/C][C]69.1167755760926[/C][/ROW]
[ROW][C]Trimmed Mean ( 12 / 24 )[/C][C]104.8[/C][C]1.51832345778131[/C][C]69.0235005346898[/C][/ROW]
[ROW][C]Trimmed Mean ( 13 / 24 )[/C][C]104.791666666667[/C][C]1.5179068073008[/C][C]69.0369567898644[/C][/ROW]
[ROW][C]Trimmed Mean ( 14 / 24 )[/C][C]104.782608695652[/C][C]1.51447541769428[/C][C]69.1873948374674[/C][/ROW]
[ROW][C]Trimmed Mean ( 15 / 24 )[/C][C]104.772727272727[/C][C]1.50715826729235[/C][C]69.5167385844315[/C][/ROW]
[ROW][C]Trimmed Mean ( 16 / 24 )[/C][C]104.761904761905[/C][C]1.49478750691718[/C][C]70.0848142475873[/C][/ROW]
[ROW][C]Trimmed Mean ( 17 / 24 )[/C][C]104.75[/C][C]1.47576577253459[/C][C]70.9800985695003[/C][/ROW]
[ROW][C]Trimmed Mean ( 18 / 24 )[/C][C]104.736842105263[/C][C]1.44785327453764[/C][C]72.339403409997[/C][/ROW]
[ROW][C]Trimmed Mean ( 19 / 24 )[/C][C]104.722222222222[/C][C]1.40780765681575[/C][C]74.3867400601357[/C][/ROW]
[ROW][C]Trimmed Mean ( 20 / 24 )[/C][C]104.705882352941[/C][C]1.35073058185188[/C][C]77.5179623233133[/C][/ROW]
[ROW][C]Trimmed Mean ( 21 / 24 )[/C][C]104.6875[/C][C]1.26876042821076[/C][C]82.5116370847357[/C][/ROW]
[ROW][C]Trimmed Mean ( 22 / 24 )[/C][C]104.666666666667[/C][C]1.14804514843069[/C][C]91.1694690838071[/C][/ROW]
[ROW][C]Trimmed Mean ( 23 / 24 )[/C][C]104.642857142857[/C][C]0.959792589083161[/C][C]109.026531703914[/C][/ROW]
[ROW][C]Trimmed Mean ( 24 / 24 )[/C][C]104.615384615385[/C][C]0.997037030524286[/C][C]104.926277974222[/C][/ROW]
[ROW][C]Median[/C][C]100[/C][C][/C][C][/C][/ROW]
[ROW][C]Midrange[/C][C]150[/C][C][/C][C][/C][/ROW]
[ROW][C]Midmean - Weighted Average at Xnp[/C][C]104.444444444444[/C][C][/C][C][/C][/ROW]
[ROW][C]Midmean - Weighted Average at X(n+1)p[/C][C]104.444444444444[/C][C][/C][C][/C][/ROW]
[ROW][C]Midmean - Empirical Distribution Function[/C][C]104.444444444444[/C][C][/C][C][/C][/ROW]
[ROW][C]Midmean - Empirical Distribution Function - Averaging[/C][C]104.444444444444[/C][C][/C][C][/C][/ROW]
[ROW][C]Midmean - Empirical Distribution Function - Interpolation[/C][C]104.444444444444[/C][C][/C][C][/C][/ROW]
[ROW][C]Midmean - Closest Observation[/C][C]104.444444444444[/C][C][/C][C][/C][/ROW]
[ROW][C]Midmean - True Basic - Statistics Graphics Toolkit[/C][C]104.444444444444[/C][C][/C][C][/C][/ROW]
[ROW][C]Midmean - MS Excel (old versions)[/C][C]104.444444444444[/C][C][/C][C][/C][/ROW]
[ROW][C]Number of observations[/C][C]74[/C][C][/C][C][/C][/ROW]
[/TABLE]
Source: https://freestatistics.org/blog/index.php?pk=234056&T=1

Globally Unique Identifier (entire table): ba.freestatistics.org/blog/index.php?pk=234056&T=1

As an alternative you can also use a QR Code:  

The GUIDs for individual cells are displayed in the table below:

Central Tendency - Ungrouped Data
MeasureValueS.E.Value/S.E.
Arithmetic Mean107.1621621621622.3684982930167745.2447706963171
Geometric Mean105.667736979648
Harmonic Mean104.446119065561
Quadratic Mean109.056147205205
Winsorized Mean ( 1 / 24 )107.0270270270272.2906998499706846.7224141252714
Winsorized Mean ( 2 / 24 )104.8648648648651.430135843818773.3251077637901
Winsorized Mean ( 3 / 24 )104.8648648648651.430135843818773.3251077637901
Winsorized Mean ( 4 / 24 )104.8648648648651.430135843818773.3251077637901
Winsorized Mean ( 5 / 24 )104.8648648648651.430135843818773.3251077637901
Winsorized Mean ( 6 / 24 )104.8648648648651.430135843818773.3251077637901
Winsorized Mean ( 7 / 24 )104.8648648648651.430135843818773.3251077637901
Winsorized Mean ( 8 / 24 )104.8648648648651.430135843818773.3251077637901
Winsorized Mean ( 9 / 24 )104.8648648648651.430135843818773.3251077637901
Winsorized Mean ( 10 / 24 )104.8648648648651.430135843818773.3251077637901
Winsorized Mean ( 11 / 24 )104.8648648648651.430135843818773.3251077637901
Winsorized Mean ( 12 / 24 )104.8648648648651.430135843818773.3251077637901
Winsorized Mean ( 13 / 24 )104.8648648648651.430135843818773.3251077637901
Winsorized Mean ( 14 / 24 )104.8648648648651.430135843818773.3251077637901
Winsorized Mean ( 15 / 24 )104.8648648648651.430135843818773.3251077637901
Winsorized Mean ( 16 / 24 )104.8648648648651.430135843818773.3251077637901
Winsorized Mean ( 17 / 24 )104.8648648648651.430135843818773.3251077637901
Winsorized Mean ( 18 / 24 )104.8648648648651.430135843818773.3251077637901
Winsorized Mean ( 19 / 24 )104.8648648648651.430135843818773.3251077637901
Winsorized Mean ( 20 / 24 )104.8648648648651.430135843818773.3251077637901
Winsorized Mean ( 21 / 24 )104.8648648648651.430135843818773.3251077637901
Winsorized Mean ( 22 / 24 )104.8648648648651.430135843818773.3251077637901
Winsorized Mean ( 23 / 24 )104.8648648648650.584991962188687179.258642242748
Winsorized Mean ( 24 / 24 )104.8648648648650.584991962188687179.258642242748
Trimmed Mean ( 1 / 24 )105.9722222222221.9446540240284154.4941264167379
Trimmed Mean ( 2 / 24 )104.8571428571431.4495356169753972.3384383447843
Trimmed Mean ( 3 / 24 )104.8529411764711.4590194648786671.8653477218627
Trimmed Mean ( 4 / 24 )104.8484848484851.4682724454289171.4094207617283
Trimmed Mean ( 5 / 24 )104.843751.4772109388093870.9741224124045
Trimmed Mean ( 6 / 24 )104.8387096774191.4857321691577470.5636667588964
Trimmed Mean ( 7 / 24 )104.8333333333331.4937093453166470.1832211614843
Trimmed Mean ( 8 / 24 )104.8275862068971.500985345055269.8391803439238
Trimmed Mean ( 9 / 24 )104.8214285714291.5073644202255169.5395401171449
Trimmed Mean ( 10 / 24 )104.8148148148151.5126011754308569.2944158164885
Trimmed Mean ( 11 / 24 )104.8076923076921.5163857317433269.1167755760926
Trimmed Mean ( 12 / 24 )104.81.5183234577813169.0235005346898
Trimmed Mean ( 13 / 24 )104.7916666666671.517906807300869.0369567898644
Trimmed Mean ( 14 / 24 )104.7826086956521.5144754176942869.1873948374674
Trimmed Mean ( 15 / 24 )104.7727272727271.5071582672923569.5167385844315
Trimmed Mean ( 16 / 24 )104.7619047619051.4947875069171870.0848142475873
Trimmed Mean ( 17 / 24 )104.751.4757657725345970.9800985695003
Trimmed Mean ( 18 / 24 )104.7368421052631.4478532745376472.339403409997
Trimmed Mean ( 19 / 24 )104.7222222222221.4078076568157574.3867400601357
Trimmed Mean ( 20 / 24 )104.7058823529411.3507305818518877.5179623233133
Trimmed Mean ( 21 / 24 )104.68751.2687604282107682.5116370847357
Trimmed Mean ( 22 / 24 )104.6666666666671.1480451484306991.1694690838071
Trimmed Mean ( 23 / 24 )104.6428571428570.959792589083161109.026531703914
Trimmed Mean ( 24 / 24 )104.6153846153850.997037030524286104.926277974222
Median100
Midrange150
Midmean - Weighted Average at Xnp104.444444444444
Midmean - Weighted Average at X(n+1)p104.444444444444
Midmean - Empirical Distribution Function104.444444444444
Midmean - Empirical Distribution Function - Averaging104.444444444444
Midmean - Empirical Distribution Function - Interpolation104.444444444444
Midmean - Closest Observation104.444444444444
Midmean - True Basic - Statistics Graphics Toolkit104.444444444444
Midmean - MS Excel (old versions)104.444444444444
Number of observations74


Parameters (Session):
Parameters (R input):
R code (references can be found in the software module):
geomean <- function(x) {
return(exp(mean(log(x))))
}
harmean <- function(x) {
return(1/mean(1/x))
}
quamean <- function(x) {
return(sqrt(mean(x*x)))
}
winmean <- function(x) {
x <-sort(x[!is.na(x)])
n<-length(x)
denom <- 3
nodenom <- n/denom
if (nodenom>40) denom <- n/40
sqrtn = sqrt(n)
roundnodenom = floor(nodenom)
win <- array(NA,dim=c(roundnodenom,2))
for (j in 1:roundnodenom) {
win[j,1] <- (j*x[j+1]+sum(x[(j+1):(n-j)])+j*x[n-j])/n
win[j,2] <- sd(c(rep(x[j+1],j),x[(j+1):(n-j)],rep(x[n-j],j)))/sqrtn
}
return(win)
}
trimean <- function(x) {
x <-sort(x[!is.na(x)])
n<-length(x)
denom <- 3
nodenom <- n/denom
if (nodenom>40) denom <- n/40
sqrtn = sqrt(n)
roundnodenom = floor(nodenom)
tri <- array(NA,dim=c(roundnodenom,2))
for (j in 1:roundnodenom) {
tri[j,1] <- mean(x,trim=j/n)
tri[j,2] <- sd(x[(j+1):(n-j)]) / sqrt(n-j*2)
}
return(tri)
}
midrange <- function(x) {
return((max(x)+min(x))/2)
}
q1 <- function(data,n,p,i,f) {
np <- n*p;
i <<- floor(np)
f <<- np - i
qvalue <- (1-f)*data[i] + f*data[i+1]
}
q2 <- function(data,n,p,i,f) {
np <- (n+1)*p
i <<- floor(np)
f <<- np - i
qvalue <- (1-f)*data[i] + f*data[i+1]
}
q3 <- function(data,n,p,i,f) {
np <- n*p
i <<- floor(np)
f <<- np - i
if (f==0) {
qvalue <- data[i]
} else {
qvalue <- data[i+1]
}
}
q4 <- function(data,n,p,i,f) {
np <- n*p
i <<- floor(np)
f <<- np - i
if (f==0) {
qvalue <- (data[i]+data[i+1])/2
} else {
qvalue <- data[i+1]
}
}
q5 <- function(data,n,p,i,f) {
np <- (n-1)*p
i <<- floor(np)
f <<- np - i
if (f==0) {
qvalue <- data[i+1]
} else {
qvalue <- data[i+1] + f*(data[i+2]-data[i+1])
}
}
q6 <- function(data,n,p,i,f) {
np <- n*p+0.5
i <<- floor(np)
f <<- np - i
qvalue <- data[i]
}
q7 <- function(data,n,p,i,f) {
np <- (n+1)*p
i <<- floor(np)
f <<- np - i
if (f==0) {
qvalue <- data[i]
} else {
qvalue <- f*data[i] + (1-f)*data[i+1]
}
}
q8 <- function(data,n,p,i,f) {
np <- (n+1)*p
i <<- floor(np)
f <<- np - i
if (f==0) {
qvalue <- data[i]
} else {
if (f == 0.5) {
qvalue <- (data[i]+data[i+1])/2
} else {
if (f < 0.5) {
qvalue <- data[i]
} else {
qvalue <- data[i+1]
}
}
}
}
midmean <- function(x,def) {
x <-sort(x[!is.na(x)])
n<-length(x)
if (def==1) {
qvalue1 <- q1(x,n,0.25,i,f)
qvalue3 <- q1(x,n,0.75,i,f)
}
if (def==2) {
qvalue1 <- q2(x,n,0.25,i,f)
qvalue3 <- q2(x,n,0.75,i,f)
}
if (def==3) {
qvalue1 <- q3(x,n,0.25,i,f)
qvalue3 <- q3(x,n,0.75,i,f)
}
if (def==4) {
qvalue1 <- q4(x,n,0.25,i,f)
qvalue3 <- q4(x,n,0.75,i,f)
}
if (def==5) {
qvalue1 <- q5(x,n,0.25,i,f)
qvalue3 <- q5(x,n,0.75,i,f)
}
if (def==6) {
qvalue1 <- q6(x,n,0.25,i,f)
qvalue3 <- q6(x,n,0.75,i,f)
}
if (def==7) {
qvalue1 <- q7(x,n,0.25,i,f)
qvalue3 <- q7(x,n,0.75,i,f)
}
if (def==8) {
qvalue1 <- q8(x,n,0.25,i,f)
qvalue3 <- q8(x,n,0.75,i,f)
}
midm <- 0
myn <- 0
roundno4 <- round(n/4)
round3no4 <- round(3*n/4)
for (i in 1:n) {
if ((x[i]>=qvalue1) & (x[i]<=qvalue3)){
midm = midm + x[i]
myn = myn + 1
}
}
midm = midm / myn
return(midm)
}
(arm <- mean(x))
sqrtn <- sqrt(length(x))
(armse <- sd(x) / sqrtn)
(armose <- arm / armse)
(geo <- geomean(x))
(har <- harmean(x))
(qua <- quamean(x))
(win <- winmean(x))
(tri <- trimean(x))
(midr <- midrange(x))
midm <- array(NA,dim=8)
for (j in 1:8) midm[j] <- midmean(x,j)
midm
bitmap(file='test1.png')
lb <- win[,1] - 2*win[,2]
ub <- win[,1] + 2*win[,2]
if ((ylimmin == '') | (ylimmax == '')) plot(win[,1],type='b',main=main, xlab='j', pch=19, ylab='Winsorized Mean(j/n)', ylim=c(min(lb),max(ub))) else plot(win[,1],type='l',main=main, xlab='j', pch=19, ylab='Winsorized Mean(j/n)', ylim=c(ylimmin,ylimmax))
lines(ub,lty=3)
lines(lb,lty=3)
grid()
dev.off()
bitmap(file='test2.png')
lb <- tri[,1] - 2*tri[,2]
ub <- tri[,1] + 2*tri[,2]
if ((ylimmin == '') | (ylimmax == '')) plot(tri[,1],type='b',main=main, xlab='j', pch=19, ylab='Trimmed Mean(j/n)', ylim=c(min(lb),max(ub))) else plot(tri[,1],type='l',main=main, xlab='j', pch=19, ylab='Trimmed Mean(j/n)', ylim=c(ylimmin,ylimmax))
lines(ub,lty=3)
lines(lb,lty=3)
grid()
dev.off()
load(file='createtable')
a<-table.start()
a<-table.row.start(a)
a<-table.element(a,'Central Tendency - Ungrouped Data',4,TRUE)
a<-table.row.end(a)
a<-table.row.start(a)
a<-table.element(a,'Measure',header=TRUE)
a<-table.element(a,'Value',header=TRUE)
a<-table.element(a,'S.E.',header=TRUE)
a<-table.element(a,'Value/S.E.',header=TRUE)
a<-table.row.end(a)
a<-table.row.start(a)
a<-table.element(a,hyperlink('arithmetic_mean.htm', 'Arithmetic Mean', 'click to view the definition of the Arithmetic Mean'),header=TRUE)
a<-table.element(a,arm)
a<-table.element(a,hyperlink('arithmetic_mean_standard_error.htm', armse, 'click to view the definition of the Standard Error of the Arithmetic Mean'))
a<-table.element(a,armose)
a<-table.row.end(a)
a<-table.row.start(a)
a<-table.element(a,hyperlink('geometric_mean.htm', 'Geometric Mean', 'click to view the definition of the Geometric Mean'),header=TRUE)
a<-table.element(a,geo)
a<-table.element(a,'')
a<-table.row.end(a)
a<-table.row.start(a)
a<-table.element(a,hyperlink('harmonic_mean.htm', 'Harmonic Mean', 'click to view the definition of the Harmonic Mean'),header=TRUE)
a<-table.element(a,har)
a<-table.element(a,'')
a<-table.row.end(a)
a<-table.row.start(a)
a<-table.element(a,hyperlink('quadratic_mean.htm', 'Quadratic Mean', 'click to view the definition of the Quadratic Mean'),header=TRUE)
a<-table.element(a,qua)
a<-table.element(a,'')
a<-table.row.end(a)
for (j in 1:length(win[,1])) {
a<-table.row.start(a)
mylabel <- paste('Winsorized Mean (',j)
mylabel <- paste(mylabel,'/')
mylabel <- paste(mylabel,length(win[,1]))
mylabel <- paste(mylabel,')')
a<-table.element(a,hyperlink('winsorized_mean.htm', mylabel, 'click to view the definition of the Winsorized Mean'),header=TRUE)
a<-table.element(a,win[j,1])
a<-table.element(a,win[j,2])
a<-table.element(a,win[j,1]/win[j,2])
a<-table.row.end(a)
}
for (j in 1:length(tri[,1])) {
a<-table.row.start(a)
mylabel <- paste('Trimmed Mean (',j)
mylabel <- paste(mylabel,'/')
mylabel <- paste(mylabel,length(tri[,1]))
mylabel <- paste(mylabel,')')
a<-table.element(a,hyperlink('arithmetic_mean.htm', mylabel, 'click to view the definition of the Trimmed Mean'),header=TRUE)
a<-table.element(a,tri[j,1])
a<-table.element(a,tri[j,2])
a<-table.element(a,tri[j,1]/tri[j,2])
a<-table.row.end(a)
}
a<-table.row.start(a)
a<-table.element(a,hyperlink('median_1.htm', 'Median', 'click to view the definition of the Median'),header=TRUE)
a<-table.element(a,median(x))
a<-table.element(a,'')
a<-table.row.end(a)
a<-table.row.start(a)
a<-table.element(a,hyperlink('midrange.htm', 'Midrange', 'click to view the definition of the Midrange'),header=TRUE)
a<-table.element(a,midr)
a<-table.element(a,'')
a<-table.row.end(a)
a<-table.row.start(a)
mymid <- hyperlink('midmean.htm', 'Midmean', 'click to view the definition of the Midmean')
mylabel <- paste(mymid,hyperlink('method_1.htm','Weighted Average at Xnp',''),sep=' - ')
a<-table.element(a,mylabel,header=TRUE)
a<-table.element(a,midm[1])
a<-table.element(a,'')
a<-table.row.end(a)
a<-table.row.start(a)
mymid <- hyperlink('midmean.htm', 'Midmean', 'click to view the definition of the Midmean')
mylabel <- paste(mymid,hyperlink('method_2.htm','Weighted Average at X(n+1)p',''),sep=' - ')
a<-table.element(a,mylabel,header=TRUE)
a<-table.element(a,midm[2])
a<-table.element(a,'')
a<-table.row.end(a)
a<-table.row.start(a)
mymid <- hyperlink('midmean.htm', 'Midmean', 'click to view the definition of the Midmean')
mylabel <- paste(mymid,hyperlink('method_3.htm','Empirical Distribution Function',''),sep=' - ')
a<-table.element(a,mylabel,header=TRUE)
a<-table.element(a,midm[3])
a<-table.element(a,'')
a<-table.row.end(a)
a<-table.row.start(a)
mymid <- hyperlink('midmean.htm', 'Midmean', 'click to view the definition of the Midmean')
mylabel <- paste(mymid,hyperlink('method_4.htm','Empirical Distribution Function - Averaging',''),sep=' - ')
a<-table.element(a,mylabel,header=TRUE)
a<-table.element(a,midm[4])
a<-table.element(a,'')
a<-table.row.end(a)
a<-table.row.start(a)
mymid <- hyperlink('midmean.htm', 'Midmean', 'click to view the definition of the Midmean')
mylabel <- paste(mymid,hyperlink('method_5.htm','Empirical Distribution Function - Interpolation',''),sep=' - ')
a<-table.element(a,mylabel,header=TRUE)
a<-table.element(a,midm[5])
a<-table.element(a,'')
a<-table.row.end(a)
a<-table.row.start(a)
mymid <- hyperlink('midmean.htm', 'Midmean', 'click to view the definition of the Midmean')
mylabel <- paste(mymid,hyperlink('method_6.htm','Closest Observation',''),sep=' - ')
a<-table.element(a,mylabel,header=TRUE)
a<-table.element(a,midm[6])
a<-table.element(a,'')
a<-table.row.end(a)
a<-table.row.start(a)
mymid <- hyperlink('midmean.htm', 'Midmean', 'click to view the definition of the Midmean')
mylabel <- paste(mymid,hyperlink('method_7.htm','True Basic - Statistics Graphics Toolkit',''),sep=' - ')
a<-table.element(a,mylabel,header=TRUE)
a<-table.element(a,midm[7])
a<-table.element(a,'')
a<-table.row.end(a)
a<-table.row.start(a)
mymid <- hyperlink('midmean.htm', 'Midmean', 'click to view the definition of the Midmean')
mylabel <- paste(mymid,hyperlink('method_8.htm','MS Excel (old versions)',''),sep=' - ')
a<-table.element(a,mylabel,header=TRUE)
a<-table.element(a,midm[8])
a<-table.element(a,'')
a<-table.row.end(a)
a<-table.row.start(a)
a<-table.element(a,'Number of observations',header=TRUE)
a<-table.element(a,length(x))
a<-table.element(a,'')
a<-table.row.end(a)
a<-table.end(a)
table.save(a,file='mytable.tab')